Economy Monitoring Quarterly Update - (EMQU) Quarter 1 - 2021 Economic Growth Service - Cornwall Council
←
→
Page content transcription
If your browser does not render page correctly, please read the page content below
Information Classification: PUBLIC

Economy Monitoring
Quarterly Update
(EMQU)
Quarter 1 - 2021

Economic Growth Service
Economic Growth and Development

Part of the Intelligence Network
Information Classification: PUBLIC
Information Classification: PUBLIC
Contents
1 Commentary, Profile and Data Summary 4
1 Introduction 4
2 Cornwall Data Profile – April 6
3 Data Summary 7
2 Cornwall 10
1 Alternative Claimant Count 10
2 Universal Credit 13
3 Jobseekers Allowance 16
4 Claimant count 16
5 Labour Market – Resident Based 18
6 Labour market - Workplace data 24
7 Coronavirus Job Retention Scheme (CJRS) 26
8 Self-Employment Income Support Scheme 27
9 Vacancies 27
10 Housing 35
11 Commercial property 41
12 Chamber of Commerce 42
13 Defence Location Statistics 43
14 Finance – Loans 44
15 Qualifications 2020 46
3 South West England 48
1 NatWest South West PMI 48
4 United Kingdom 50
1 Business Surveys and barometers 50
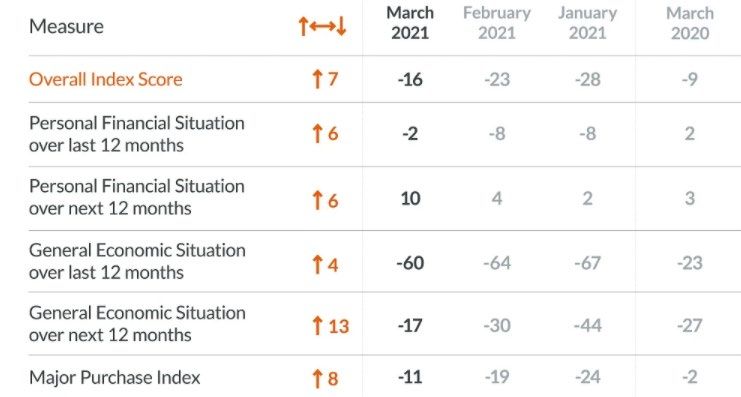
2 Consumer Surveys and barometers 54
3 Output 56
4 Investment 62
5 Trade and the Balance of payments 62
6 Labour market 64
7 Housing 65
8 Consumer and retail 67
9 Price inflation 68
10 Finance 70
11 Coronavirus Job Retention Scheme (CJRS) 72
12 Self-Employment Income Support Scheme (SEISS) 74
5 International 75
1 EU Data releases – monthly 75
2 Markit Eurozone Composite PMIs 76
3 EU Quarterly data 77
4 Annual data 78
5 Global data 78
Economy Monitoring Quarterly Update (EMQU) April 2021 3
Information Classification: PUBLIC

1 Commentary, Profile and Data Summary

1 Introduction
April 2021 – an Overview
Economy data continued to reflect the ongoing economic impact due to the COVID-19
situation. Business confidence was positive, although consumer confidence remained
mixed with the GfK index still in negative territory. On the output front, GDP growth was
negative as were Production and Services, though Construction was up on a quarterly
basis. Labour market data shows that the number of employees is still down over the
year. Both consumer prices and producer prices moved up which for the latter is a
turnaround in circumstances. House prices were up significantly over the year, with net
mortgage lending above average. Latest retail sales data showed a decrease in volume.
Data continues to be highly variable due to current circumstances.

In Cornwall
The most useful data sets which capture the current situation show that the numbers on
Universal Credit have risen substantially. Between March 2020 and March 2021 numbers
rose from 24,876 to 49,989 up 101%. Numbers on Jobseekers Allowance fell back from
1,573 in January to 1,426 in March.

Alternative Claimant Count figures for February were up compared to the January figures
and up considerably 104% compared to the February 2020 figure. Claimant count figures
for March continue the upward trend for the first quarter and were up by 119% on March
2020 figures.

Over the last year the total aged 16-64 was stable 1, but with changes in the numbers of
economically active – down and economically inactive - up. Employment numbers were
down with a large decrease in employees offsetting a small rise in self-employed
numbers. The number of those working full-time fell considerably while part-time
numbers moved up. The number of unemployed increased. Vacancies in Q1 2021 were
down by 2% on Q4 2020 totals, but up 17% on Q1 2020.

In Q4 2020, house prices averaged £256,300 up from £241,900 in Q3 2020 and up from
the figure for Q4 2019. In the year ending September 2020, median house prices in
Cornwall equalled £236,000 compared to £249,000 for England 2. Total sales in Q4 2020
at 2,879 were up on the Q3 figures and similar to the Q4 2019 totals. in Q1 2021 there
were 6,630 properties for sale with 499 to rent, a total of 7,129 properties. Compared to
Q4 2020 the total fell by 28%.

The latest Cornwall Chamber of Commerce survey takes the data up to Q1 2021 3.
Compared to Q4 2020, there were positive readings4 for 9 of the 12 indicators. Over the

1
  Due to the volatility of the data changes in figures from one period to another may not reflect underlying trends.
2
  UK figures not available.
3
  NB Smaller sample size than usual so take should be taken in interpreting data.
4
  A plus reading for ‘had experienced recruitment difficulties is regarded as negative!

Economy Monitoring Quarterly Update (EMQU) April 2021                                                    4
Information Classification: PUBLIC

year, there were negative readings for 6 and negative readings for 5 of the 12 indicators.
The share of businesses running at full capacity rose from 38% to 40%.

For the UK
Business confidence was in a relatively positive mood with Manufacturing, Services and
Construction all in a robust situation and Jobs up as hiring rose. Regional PMI showed
growth in activity and employment while the Lloyds Business Barometer saw business
confidence surge to a two and half year high. On the consumer front, Household finances
remained under pressure, but the GfK Consumer Confidence index increased by one
point, although remaining in negative territory.

On the output front, in the three months to February 2021, GDP growth fell back as did
Construction and Services though Production rose. The labour market was stable with a
small fall in pay rolled employee numbers, with employment down and unemployment
up. There were 607,000 fewer employees employed compared to the Marc 2020 total.
House prices rose 8.6% on the year to February, in part due to the incentive offered by
the stamp duty relief.

In the three months to March 2021, retail sales decreased compared with the previous
three months. March inflation figures saw the CPI rise to +0.7%, while the producer
output price index moved to upwards to +1.9%. Government borrowing in the FYE March
2021 is estimated to have been £303.1 billion, £246.1 billion more than in the FYE March
2020 and the highest nominal public sector borrowing in any financial year since records
began in the FYE March 1947. In January, consumer credit was weak with repayments of
£2.4 billion, Net mortgage borrowing was £5.2 billion in January, above the pre-COVID-
19 six months to February average of £4.0 billion.

European Union and International
At an EU27 level, comparing figures for February 2021 with February 2020, showed that
Industrial producer prices rose, while Industrial Production, Construction and Retail trade
all fell. The inflation rate in March was +1.7%, up from 1.2% a year earlier. The final March
composite PMI saw Euro area growth rise with Manufacturing booming. On the
international level, February saw both world trade volume momentum and industrial
production momentum both in positive territory.

Economy Monitoring Quarterly Update (EMQU) April 2021                                5
Information Classification: PUBLIC

2 Cornwall Data Profile – April
Population: 569,600 (MYE 2019). [NOMIS].
Enterprises: 24,630, Workplaces: 28,850, 2020. [UK Business Activity].
House prices: Mean: Q4 2020 £256,300. Median: Q3 2020 £236,000. [Land Registry].
Gross Value Added: Total GVA in 2018 £10,960 million. Ex OOIR = £ million.
Per head – 2018 was £19,288. Equal to 67.7% of UK average. Main sectors 2018:
Wholesale, retail & motors (13.8%, Construction (11.09%), Health & social work (9.9%).
GDP £12,555 million 2018. [ONS].
Productivity: In 2018, Nominal (smoothed) GVA per filled job was £40,725, 72.2% of the
UK average of £56,387. Nominal (smoothed) GVA Per hour was £26.50, 75.7% of UK
average. [ONS].
Gross Domestic Product: Total GDP equalled £12.3 bn in 2018; (12.4 bn PPS, up from
12.3bn PPS in 2017). Per capita = 21,900 PPS, 71% of the EU average. [Eurostat].
Employment (workplace): 235,859 in employment. 174,959 employees, 52,266 self-
employed. [Census 2011].
215,000 employees 2019; 236,000 employed 2019. [BRES].
243,400 employed YE Dec 2020. [APS, 16+].

Unemployed: 10,700 YE December 2020. [APS, 16-64]; Alternative Claimant Count:
19,355, February 2021. [DWP]; Universal credit: 49,989 March [DWP].

Vacancies: 3,265 job postings April. [Active Informatics, CIOS].

Workless households: 27,000, 15.3%, (UK 14.0%); Workless People: 34,000, 10.3%, (UK
9.7%) 2019. [APS].

Employee earnings: Total workplace gross annual median earning, 2020- £19,847 (77%
of the UK average. (Full-time £25,614, Part-time £10,707). [ASHE, Provisional]. Total
resident gross annual earnings in 2020 equalled £20,710, 80% of the UK average. CIoS
and Cornwall. [Annual Survey of Hours and Earnings].

Self-employed earnings (median): £13,600 for 2017-18. [UK £14,600]. [HMRC].

Gross Disposable Household Income: £18,568, 88.0% of UK average, 2018. [ONS].
Qualifications: 25% with Level 4 and above, 22.4% with no qualifications. [Census 2011,
16+]. 37% with NVQ4+ (UK 40.2%); 5.9% with no qualifications (UK 7.9%), 2019. [APS,
16-64].

Economy Monitoring Quarterly Update (EMQU) April 2021                            6
Information Classification: PUBLIC

    3 Data Summary

Cornwall [CIoS in brackets]
Alternative Claimant count
   • February 2021 19,355 [19,415] claimants, up by 1,152 on the January total of
      18,203 [18,261], and up by 9,887 on the February 2020 total of 9,468. [9,475].
Universal credit
   • March 5 49,989 [50,106] UC claimants 6, up on the February figure.
Jobseekers allowance
   • March 1,426 [1,429] down 132 on the February total of 1,558. Compared to March
      2020, the figure was up by 603 or 73%.
Labour market - resident based [Year ending December 2020] 7
   • 16-64 = 327,500.
     • Economically active = 256,000.
     • Economically inactive = 71,500.
     • Employed = 245,300, (employees 192,100, self-employed 52,900 8).
     • Full-time = 166,400, part-time = 78,500.
     • Unemployed = 10,700.
Labour market - workplace based [Year ending December 2020, 16+]
   • Working = 243,400.
     • Self-employed = 60,000.
     • Employees =169,600.
     • Flexible = 13,800.
Vacancies (job postings)
   • April 3,265 (CIoS). [April 2020 1,498].
Housing
  • Prices (Mean): Q4 2020, £256,300. £236,700 in Q4 2020].
     • Sales: November 2020 = 868 [November 2019 = 987].
     • Properties available: April – there were 1,728 properties for sale with 77 to rent, a
       total of 1,805 properties.
Commercial property

5
  NB Each month’s figures are provisional and revised a month later.
6
  This section presents details of Universal Credit data. The transfer of all claimants to UC is not complete and
therefore these figures are for the record rather than presenting a complete picture.
7
  Figures cover a year and are produced quarterly; all figures for age group 16-64.
8
  Numbers may not sum to all those employed.

Economy Monitoring Quarterly Update (EMQU) April 2021                                                7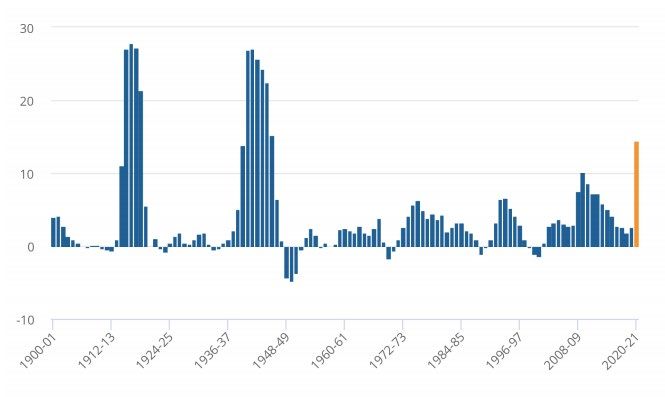
Information Classification: PUBLIC
• Properties available: April – 255 (Retail 46%, Leisure/hospitality 20%). 125
commercial properties for letting with 130 for purchase.
Chamber of Commerce Q1 2021
• Compared to Q4 2020, there were positive readings 9 for 9 of the 12 indicators.
• Over the year, there were negative readings for 6 of the 12 indicators.
• 40% of businesses operating at full capacity, [Q1 2020 38%].
Defence employment
• 2020 - 3,390 [2,960 (87%) military and 430 (13%) civilians].
United Kingdom
Business Surveys and barometers
• UK Manufacturing PMI: March – UK Manufacturing PMI at decade high. ↑
• UK services: March – Service economy returns to growth. ↑
• UK Construction PMI: March – output expands at sharpest pace. ↑
• Jobs: March – substantial increase in hiring activity. ↑
• NatWest IHS Markit - UK Regional PMI: March – Most regions see growth. ↑
Consumer Surveys and barometers
• Household Finance Index: Q1 21 - UK households pay down debt through winter
lockdown. ↓
• Gfk’s Consumer confidence index: April: UK Consumer Confidence increased by
one point to -15. ↓
Output
• GDP growth 3 months to February was 1.6% down on previous 3 months rate. ↓
• Index of Production – 3 months to February shows 0.1% increase on previous 3
months rate. ↑
• Output in the construction sector – 3 months to February shows 1.0% decrease
on previous 3 months rate. ↓
• The seasonally adjusted Index of Services – 3 months to February shows 1.9%
decrease on previous 3 months rate. ↓
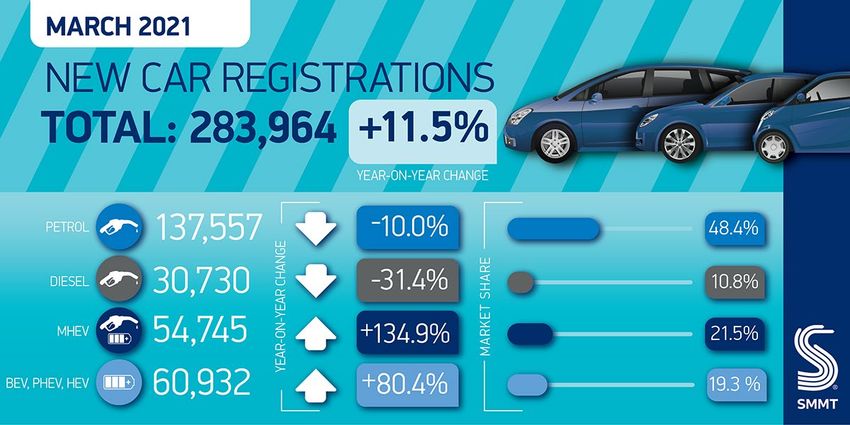
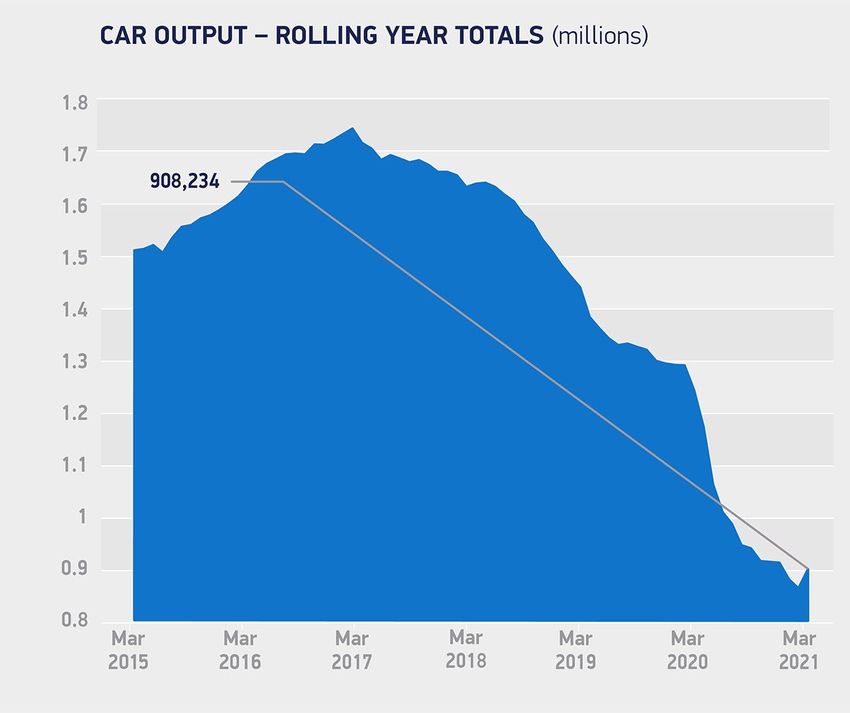
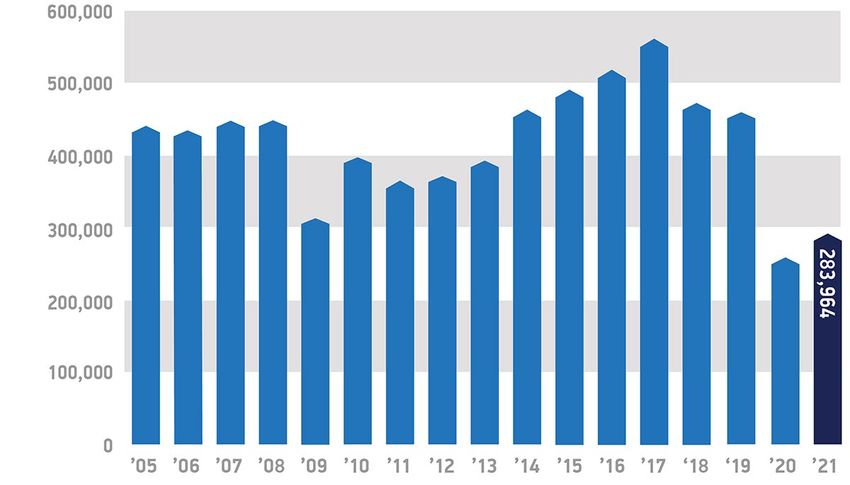
• New car output: production up 47% in March. ↑
Trade
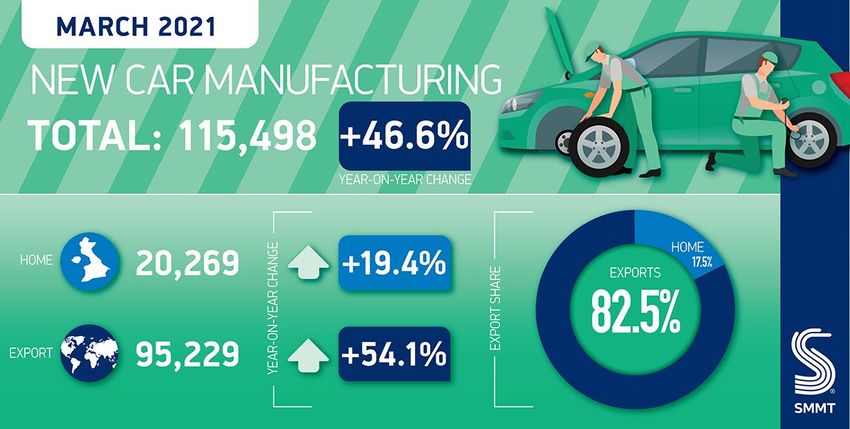
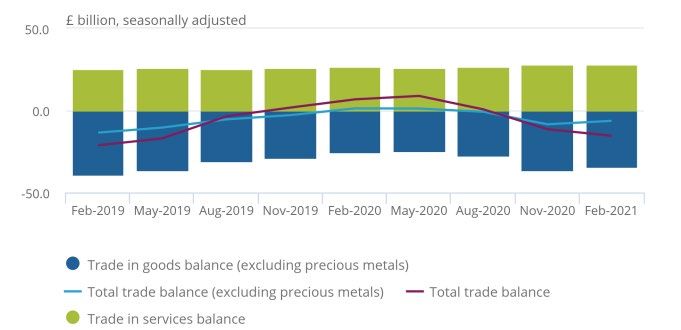
• Exports of goods, excluding non-monetary gold and other precious metals,
increased by £3.7 billion (46.6%) in February 2021. ↓
Labour market - Main points
• Employment rate down and unemployment up.
9
A plus reading for ‘had experienced recruitment difficulties is regarded as negative!
Economy Monitoring Quarterly Update (EMQU) April 2021 8
Information Classification: PUBLIC

      • 56,000 fewer people were in pay rolled employment in March 2021 when
        compared with February 2021. ↓
      •   Three months to February, regular pay growth at 4.4% 10. ↑

Housing
  • House prices – up 8.6% in year to February. ↑
      • UK sales –December = 91,735 up 8% on December 2019. ↑
Consumer, retail and prices
  • Consumer Trends – Q4 (Oct to Dec) 2020, household spending (adjusted for
     inflation) growth was negative 1.7% compared with Quarter 3 (July to Sept) 2020.
     ↓
      •   Retail – March 2021 5.8% decrease on three months to December. ↓
      •   CPI annual inflation: March 2021 +0.7%, up on February. ↑
      •   Producer prices: March 2021 shows1.9% annual increase. ↑

Public sector Borrowing: Financial year ending March 2021 – net borrowing £303.1
billion. ↑
Finance
     • Net mortgage borrowing: January remained robust at £5.2 billion. ↑
European Union
Annual:
   • EU27: February 2021 compared to February 2020: Industrial producer prices↑,
      Retail trade index ↓, Industrial production ↓, Construction ↓.
      • Inflation EU27: March annual inflation was 1.7%. [1.2% March 2020].
Unemployment: March 2021.
  • The EU27 unemployment rate was 7.3%, up from 6.4% in March 2020. ↑

Quarterly: GDP: Q1 2021.
  • Seasonally adjusted GDP fell by 0.4%. ↓
Eurozone
Markit Eurozone Composite PMI®– final data: March - Eurozone private sector returns
to growth. ↑
Global data
Developments in global international trade and industrial production – February 2021:
   • World trade momentum was 2.9% 11.
   • World industrial production momentum was 3.7%.

10
     An over-estimate due to the loss of low paid jobs.
11
     Momentum - based on three-month on three-month change

Economy Monitoring Quarterly Update (EMQU) April 2021                               9
Information Classification: PUBLIC
2 Cornwall
1 Alternative Claimant Count
[Released quarterly. Figures for CIoS in brackets]
The latest figure for February 2021 shows there were 19,355 [19,415] claimants, up by
1,152 on the January total of 18,203 [18,261], and up by 9,887 on the February 2020 total
of 9,468. [9,475]. Over the year the rate 12 rose from 3.6% to 5.9% 13.
Table 1.1: Alternative Claimant count
Date No's Rate
2020 Feb 9468 3.6
Mar 9541 3.6
Apr 19312 7.4
May 22579 8.6
June 21157 8.1
July 21089 8.1
Aug 20858 8.0
Sep 19214 7.3
Oct 17815 7.0
Nov 18285 5.6
Dec 18273 5.6
2021 Jan 18203 5.6
Feb 19355 5.9
No's Rate
Monthly change 1152 0.4
Annual change 9887 3.8
% %
Monthly change 6.3 6.3
Annual change 104.4 131.4
Fig 1.1 illustrates trends in the numbers on the ACC have changed over time. There is a
seasonal pattern with peaks in the winter months. This pattern replicates that of
jobseekers in the past suggesting that seasonal work impacts on the labour market. The
most important point about this chart is that it picks up the significant increase in
numbers in April and May reflecting the impact of the economic situation on claimant
levels. From May to October numbers fell back, with figures up in November then stable
before rising in February.
12
The rate is derived using the 16-64 economically active figures for residents from the Annual Population Survey.
13
Changes in APS numbers can alter the rates compared to previous versions.
Economy Monitoring Quarterly Update (EMQU) April 2021 10Information Classification: PUBLIC
No's Fig 1.1: Alternative Claimant Count trends
25000
20000
15000
10000
5000
0
Jan
Apr
Jul
Oct
Jan
Apr
Jul
Oct
Jan
Apr
Jul
Oct
Jan
Apr
Jul
Oct
Jan
Apr
Jul
Oct
Jan
Apr
Jul
Oct
Jan
Apr
Jul
Oct
Jan
Apr
Jul
Oct
Jan
2013 2014 2015 2016 2017 2018 2019 2020 2021
For most of the period covered by the data, numbers decreased each month compared
to the same month in the previous year. However, since October 2018, there has been
an increase in the number of claimants compared to the same month in the previous
year. The impact of the current economic situation can be seen with the dramatic
increases in April and May compared to the same months in the previous year. Despite
declines since then, number remain high.
Fig 1.2: Month on month on previous year change
16000
14000
12000
10000
8000
6000
No's
4000
2000
0
-2000
-4000
-6000
Jan July Jan July Jan July Jan July Jan July Jan July Jan July Jan
2014 2015 2016 2017 2018 2019 2020 2021
Over the year between February 2020 and February 2021 all constituencies saw an
increase in the number of claimants. The largest percentage increase was in Truro &
Falmouth at 139%. The highest rate was in St. Austell & Newquay at 8.8%, then Camborne
& Redruth at 8.7%. The largest increase was in St. Austell & Newquay up by 5.1 points.
Economy Monitoring Quarterly Update (EMQU) April 2021 11Information Classification: PUBLIC Table 1.2: Alternative Claimant count Numbers Feb-20 Feb-21 Change Constituency No's No's No's % Camborne and Redruth 1931 3427 1496 77 North Cornwall 1538 2981 1443 94 South East Cornwall 1422 2749 1327 93 St Austell and Newquay 1950 4288 2338 120 St Ives 1411 3029 1618 115 Truro and Falmouth 1226 2936 1710 139 CIoS 9475 19415 9940 105 Rate Feb-20 Feb-21 Change Constituency % % % % Camborne and Redruth 5.2 8.7 3.5 67 North Cornwall 3.7 7.5 3.9 105 South East Cornwall 3.2 6.6 3.5 109 St Austell and Newquay 3.8 8.8 5.1 134 St Ives 3.4 6.3 2.9 85 Truro and Falmouth 2.7 7.6 5.0 187 CIoS 3.6 7.6 4.0 111 The statistics form a modelled statistical series. The statistics are formed as a count of the number of people claiming a benefit that is – or would be under Universal Credit – related to being actively available and searching for work i.e. the number of people claiming Jobseeker’s Allowance (JSA), or Universal Credit Searching for Work conditionality (excluding those on the health journey pre-Work Capability Assessment), or a legacy benefit or Child tax Credit that would under Universal Credit place the claimant with Searching for Work conditionality. [DWP] Source: DWP, 20 April 2021. Economy Monitoring Quarterly Update (EMQU) April 2021 12
Information Classification: PUBLIC

2 Universal Credit
 In March 14 there were 49,989 UC claimants in Cornwall. The main group was ‘Searching
 for work’, which accounted for 17,883 or 35.8% of the total. [NB. Numbers may not sum
 to the total].

 Table 2.1: UC March 2021

 Conditionality
                                         Cornwall IoS           CIoS        Cornwall IoS           CIoS
 Regime/Area
                                           No’s        No’s      No’s         %           %         %
 Searching for work                         17883         59 17942           35.8        49.6      35.8
 Working – with
                                                                             17.8        16.0      17.8
 requirements                                 8911        19     8924
 No work requirements                         9717         9     9727        19.4         7.6      19.4
 Working – no
                                                                             20.3        26.9      20.4
 requirements                               10171        32 10204
 Planning for work                            971         0   975             1.9         0.0   1.9
 Preparing for work                          2336         0 2339              4.7         0.0   4.7
 Total                                      49989       119 50106            100.0       100.0 100.0

Table 2.2 shows the changes in UC numbers from March 2020 onwards. Between March
2020 and March 2021, the number of claimants in Cornwall rose from 24,876 to 49,989
up 101%. Between February 2021 and March 2021, numbers in Cornwall rose by 646 or
1.3%.

 Table 2.2: UC trends

 Month                                                      Cornwall              CIoS
 2020                                     March                           24876          24901
                                          April                           40278          40386
                                          May                             47397          47534
                                          June                            48130          48278
                                          July                            48274          48411
                                          Aug                             48334          48465
                                          Sept                            48382          48512
                                          Oct                             47784          47906
                                          Nov                             48220          48333
                                          Dec                             48860          48979
 2021                                     Jan                             48997          49111
                                          Feb (Rev)                       49343          49462

14
     NB Each month’s figures are provisional and revised a month later.

Economy Monitoring Quarterly Update (EMQU) April 2021                                            13
Information Classification: PUBLIC
Mar (prov) 49989 50106
Change, month on month
Change - No's 646 644
Change - % 1.3 1.3
Change from March 2020
Change - No's 25113 25205
Change - % 101.0 101.2
Table 2.3 shows the breakdown by Parliamentary Constituency 15. St. Austell and
Newquay had the largest number with 10,791, with a rate of 17.8% 16. The highest rate of
all the constituencies was in Camborne & Redruth at 18.7%. The lowest rate was in St Ives
at 12.6%.
Table 2.3: UC March 2021 – Parliamentary Constituency
Parliamentary Constituency No's % 16-64
Camborne and Redruth 8841 18.7 47,300
North Cornwall 7879 15.0 52,600
South East Cornwall 7184 12.8 56,100
St Austell and Newquay 10791 17.8 60,500
St Ives 7453 12.6 59,100
Truro and Falmouth 7479 14.4 51,900
Total 49631 15.2 327,500
[Rate based on UC claimants as % of those aged 16-64 resident in the area – APS data].
In March 17, of the 49,631 in CIoS, 19,449 (39.2%) were in employment with 30,182
(60.8%) not in employment.
Table 2.4: UC Employment status
In employment Not in employment Total
No's % No's % No's %
Jan-20 8444 36.7 14538 63.3 22983 100.0
Feb-20 9017 37.3 15189 62.8 24203 100.0
Mar-20 9409 37.8 15496 62.2 24901 100.0
Apr-20 15290 37.9 25093 62.1 40386 100.0
May-20 17247 36.3 30289 63.7 47534 100.0
15
Revised figures.
16
As a % of all those aged 16-64.
17
Revised
Economy Monitoring Quarterly Update (EMQU) April 2021 14Information Classification: PUBLIC
Jun-20 18620 38.6 29655 61.4 48278 100.0
Jul-20 19814 40.9 28596 59.1 48411 100.0
Aug-20 20444 42.2 28021 57.8 48465 100.0
Sep-20 21121 43.5 27386 56.5 48512 100.0
Oct-20 21145 44.1 26757 55.9 47906 100.0
Nov-20 20546 42.5 27791 57.5 48333 100.0
Dec-20 20582 42.0 28396 58.0 48979 100.0
Jan-21 19939 40.6 29171 59.4 49111 100.0
Feb-21 19461 39.3 30000 60.7 49462 100.0
Mar-21 19449 39.2 30182 60.8 49631 100.0
Month -12 -0.2 182 0.2 169 0
March to March 10040 1.4 14686 -1.4 24730 0
UC claimants can be grouped into various categories relating to conditionality. These are
set out in table 2.5.
[As the transition from providing a various range of benefits to Universal Credit continues,
it will be possible to track the numbers of UC claimants. However, as people are still being
transferred it is not possible to draw any conclusions from changes in numbers over time].
Table 2.5: Universal Credit – Conditionality
Description a) Aged 1 - 2, prior to April 2017. (b) Aged 3 - 4, prior to
Conditionality
April 2017.
Not working, or with very low earnings. Claimant is required to take
Searching for
action to secure work - or more / better paid work. The Work Coach
work
supports them to plan their work search and preparation activity.
Working - with In work but could earn more, or not working but has a partner with
requirements low earnings.
No work Not expected to work at present. Health or caring responsibility
requirements prevents claimant from working or preparing for work.
Individual or household earnings over the level at which
Working - no conditionality applies. Required to inform DWP of changes of
requirements circumstances, particularly if at risk of decreasing earnings or losing
job.
Expected to work in the future. Lone parent / lead carer of child
Planning for
aged 1(a). Claimant required attending periodic interviews to plan for
work
their return to work.
Expected to start preparing for future even with limited capability
Preparing for for work at the present time or a child aged 2(b), the claimant is
work expected to take reasonable steps to prepare for work including
Work Focused Interview.
Source: DWP, Stat-Xplore, 20 April 2021.
Economy Monitoring Quarterly Update (EMQU) April 2021 15Information Classification: PUBLIC
3 Jobseekers Allowance
In March, the latest JSA figure for Cornwall was 1,426 [1,429], down 132 on the February
total of 1,558. Compared to March 2020, the figure was up by 603 or 73.3%. The rate rose
from 0.2% to 0.4%.
Table 3.1: Job Seekers Allowance
Cornwall CIoS
Year Month No’s No’s %
2020 Mar 823 824 0.2
Apr 1,633 1,640 0.5
May 1,814 1,822 0.5
Jun 1,852 1,861 0.6
Jul 1,780 1,788 0.5
Aug 1,735 1,740 0.5
Sep 1,771 1,775 0.5
Oct 1,559 1,563 0.5
Nov 1,616 1,620 0.5
Dec 1,523 1,526 0.5
2021 Jan 1,573 1,578 0.5
Feb 1,558 1,561 0.5
Mar 1,426 1,429 0.4
Change
Month on month - no's -132 -132 -0.1
Month on month year - no's 603 605 0.2
Month on month - % -8.5 -8.5 -20.0
Month on month year - % 73.3 73.4 100.0
Source: NOMIS, 20 April 2021.
4 Claimant count
In March there were 19,300 included in the Claimant count in Cornwall, representing a
rate of 5.8%. Numbers rose by 100 or 0.5% compared to February while the rate remained
the same. Compared to March 2020, numbers increased by 10,495 or 119.2%, while the
rate rose from 2.7% to 5.8%.
Table 4.1: Claimant count
Numbers Rate
Cornwall CIoS Cornwall CIoS
2020 Mar 8,805 8,810 Mar 2.7 2.7
Apr 19,150 19,230 Apr 5.8 5.8
Economy Monitoring Quarterly Update (EMQU) April 2021 16Information Classification: PUBLIC
May 21,595 21,680 May 6.5 6.5
Jun 19,920 19,995 Jun 6 6
Jul 20,160 20,225 Jul 6.1 6.1
Aug 20,095 20,155 Aug 6.1 6.1
Sep 18,760 18,800 Sep 5.7 5.7
Oct 17,280 17,315 Oct 5.2 5.2
Nov 17,925 17,965 Nov 5.4 5.4
Dec 17,950 17,995 Dec 5.4 5.4
2021 Jan 18,085 18,145 Jan 5.5 5.5
Revised Feb 19,200 19,260 Feb 5.8 5.8
Provisional Mar 19,300 19,360 Mar 5.8 5.8
Cornwall CIoS Cornwall CIoS
No’s 100 100 0.0 0.0
Monthly change
% 0.5 0.5
Cornwall CIoS Cornwall CIoS
No’s 10,495 10,550 3.1 3.1
Month on month in previous year
% 119.2 119.8
Claimant count
This experimental series counts the number of people claiming Jobseeker's Allowance plus
those who claim Universal Credit and are required to seek work and be available for work
and replaces the number of people claiming Jobseeker's Allowance as the headline
indicator of the number of people claiming benefits principally for the reason of being
unemployed. The Claimant Count includes people who claim unemployment-related
benefits but who do not receive payment. For example, some claimants will have had their
benefits stopped for a limited period of time by Jobcentre Plus. Some people claim JSA in
order to receive National Insurance Credits.
Under Universal Credit it is expected that a broader span of claimants will claim benefit
principally for the reason of being unemployed and therefore be included within the
Claimant Count. This means that, with the roll-out of Universal Credit, the level of the
Claimant Count series is likely to be higher than it would have been otherwise, even if
labour market conditions remain unchanged.
NOMIS
Source: NOMIS, 20 April 2021.
Economy Monitoring Quarterly Update (EMQU) April 2021 17Information Classification: PUBLIC
5 Labour Market – Resident Based
Labour market figures for Cornwall and the Isles of Scilly from the Annual Population
Survey are available up to December 2020 18. This data set covers those of working age
namely the 16-64 age groups who are resident in the area 19.
In total there were 327,500 aged 16-64, of whom 256,000 were economically active and
71,500 who were economically inactive. A total of 245,300 were employed. Of these,
192,100 were employees with 52,900 self-employed 20; while 166,400 worked full-time
with 78,500 working part-time. There were 10,700 who were unemployed.
Over the last year the total aged 16-64 was stable 21, but with changes in the numbers of
economically active – down and economically inactive - up. Employment numbers were
down with a large decrease in employees offsetting a small rise in self-employed
numbers. The number of those working full-time fell considerably while part-time
numbers moved up. The number of unemployed increased.
All data in Table 5.1.
Table 5.1: Labour Market Indicators – Cornwall & IoS
Period Change
Jan-19 Apr-19 Jul-19 Oct-19 Jan-20 Prev
Date Year
Dec-19 Mar-20 Jun-20 Sep-20 Dec-20 Qtr
Group No's No's No's No's No's No's No's
16-64 327,000 327,600 328,100 329,900 327,500 -2,400 500
Econ active 261,600 263,500 261,400 261,500 256,000 -5,500 -5,600
Econ inactive 65,400 64,100 66,800 68,500 71,500 3,000 6,100
Employed 252,900 254,800 252,600 251,800 245,300 -6,500 -7,600
Unemployed 8,600 8,700 8,700 9,700 10,700 1,000 2,100
Employees 199,900 204,100 199,300 196,700 192,100 -4,600 -7,800
Self 52,900
51,900 49,700 52,700 54,100 -1,200 1,000
employed
Full-time 180,800 177,800 171,400 168,300 166,400 -1,900 -14,400
Part-time 71,600 76,600 80,800 83,000 78,500 -4,500 6,900
18
Figures cover a year and are produced quarterly; all figures for age group 16-64.
19
Data has been reweighted in line with the latest ONS estimates.
20
Numbers may not sum to all those employed.
21
Due to the volatility of the data changes in figures from one period to another may not reflect underlying trends.
Economy Monitoring Quarterly Update (EMQU) April 2021 18Information Classification: PUBLIC
Looking at percentage changes over the year, numbers in the 16-64 age group were
stable, while the numbers of economically active fell by 2% and economically inactive
increased by 9%. Numbers employed fell by 3%, with a decrease of 4% in employee
numbers while the self-employed numbers rose by 2%. Full-time numbers were down by
7% while Part-time were up by 10%.
Table 5.2: Labour Market indicators – Cornwall & IoS
Jan 19 to Dec Jan 20 to Dec Change year-on-
Date
19 20 year
Group No's No's No's %
16-64 327,000 327,500 500 0
Econ active 261,600 256,000 -5,600 -2
Econ inactive 65,400 71,500 6,100 9
Employed 252,900 245,300 -7,600 -3
Unemployed 8,600 10,700 2,100 24
Employees 199,900 192,100 -7,800 -4
Self employed 51,900 52,900 1,000 2
Full-time 180,800 166,400 -14,400 -8
Part-time 71,600 78,500 6,900 10
Over the year: the economically active rate fell from 80.0% to 78.2%, the employment
rate fell from 77.4% to 74.9%, the self-employment share of employment moved up from
20.5% to 20.6%. The share taken by full-time decreased from 71.5% to 67.8% while part-
time rose from 28.3% to 32%. Unemployment rates rose from 3.3% to 4.2%. 22
Table 5.3: Labour Market Indicators – Cornwall & IoS
Period Change
Jan-19 Apr-19 Jul-19 Oct-19 Jan-20
Date Previous year
Dec-19 Mar-20 Jun-20 Sep-20 Dec-20
Group % % % % % %
Econ active 80.0 80.4 79.6 79.3 78.2 -1.8
Econ inactive 20.0 19.6 20.4 20.7 21.8 1.8
Employed 77.4 77.8 77.0 76.3 74.9 -2.5
Unemployed 3.3 3.3 3.3 3.7 4.2 0.9
Employees 79.0 80.1 78.9 78.1 78.3 -0.7
Self employed 20.5 19.5 20.8 21.5 21.6 1.1
Full-time 71.5 69.8 67.9 66.9 67.8 -3.7
Part-time 28.3 30.1 32.0 33.0 32.0 3.7
22
NB totals for sub-categories may not sum to 100, due to rounding.
Economy Monitoring Quarterly Update (EMQU) April 2021 19Information Classification: PUBLIC
Table 5.4 compares the latest figures with those from the base year of 2004.shows trends
over time. Overall, since 2004:
• The number aged 16-64 rose from 313,700 to 327,5000 up by 13,800 or 4%;
• Economically active rose by 19,900 from 236,100 to 256,100 or 8%;
• Economically inactive fell by 6,100 from 77,600 to 71500 or 8%;
• Employment increased by 20,100 from 225,200 to 245,300 or 9%;
• Much of the increase in economically active can be related to the overall increase
in population with a transfer from the economically inactive. The increase in
employment was largely a result of bigger rises in self-employment;
• Unemployment fell by 100 from 10,800 to 10,700;
• Employee numbers went up by 11,700 from 180,400 to 192,100, (an increase of
6%);
• The number of self-employed rose from 41,800 to 54,100, an increase of 11,100
or 27%;
• The trend towards part-time also continued, with part-time numbers up from
67,800 to 78,500 (+10,700 or 16%);
• Full-time numbers rose by 9,200 from 157,200 to 166,400 or 6%;
Table 5.4: Trend data
Jan 2004 Jan 2020
Change
Dec 2004 Dec 2020
Category No’s No’s No’s %
16-64 313,700 327,500 13,800 4
Econ active 236,100 256,000 19,900 8
Econ inactive 77,600 71,500 -6,100 -8
Employed 225,200 245,300 20,100 9
Unemployed 10,800 10,700 -100 -1
Employees 180,400 192,100 11,700 6
Self employed 41,800 52,900 11,100 27
Full-time 157,200 166,400 9,200 6
Part-time 67,800 78,500 10,700 16
Table 5.5 compares the latest data with the baseline year of 2004. Since then:
• Economically active rate went up from 75.3% to 78.2%, up 2.9% points;
• Economically inactive rate fell back from 24.7% to 21.8%, down 2.9% points;
Economy Monitoring Quarterly Update (EMQU) April 2021 20Information Classification: PUBLIC
• Employment rate rose from 71.8% to 74.9%, up 3.1% points;
• Of those in employment, the employee share fell - 80.1% to 78.3%, down 1.8%
points;
• Conversely, the self-employed share rose from 18.5% to 21.6%, up 3.1% points.
The steady move towards more part-time and less full-time employment continued:
• Part-time up from 30.1% to 32.0, up 1.9% points;
• Full-time down from 69.8% to 67.8%, down 2.0% points;
• The unemployment rate fell back 0.9% points from 4.6% to 4.2%.
Table 5.5: Trend data
Jan 2004-Dec Jan 2020-Dec
Change
2004 2020
% % %
Economic activity rate 75.3 78.2 2.9
Economically inactive 24.7 21.8 -2.9
Employment rate 71.8 74.9 3.1
Unemployment rate 4.6 4.2 -0.4
Employees 80.1 78.3 -1.8
Self employed 18.5 21.6 3.1
Full-time 69.8 67.8 -2.0
Part-time 30.1 32.0 1.9
Comparing Cornwall to the UK using the average for four sets of yearly data 23, removes
some of the volatility in the data. Comparing the averages in Table 5.6 below shows that:
economically active and inactive rates are similar to the UK rates, as are employment
levels. As expected, both self-employment and part-time employment are higher in
Cornwall and conversely employee levels and full-time employment are lower. Average
unemployment runs at 3.6%, below the UK average of 4.2%.
Table 5.6: Labour market indicators - Cornwall and UK
Cornwall UK Ratio
Status % % %
Economic activity 79.4 78.9 1.0
Economically inactive 20.6 21.1 1.0
Employment rate 76.5 75.6 1.0
Unemployment rate 3.6 4.2 0.9
23
Each period covers one year, and each year includes 3 of the quarters covered in the previous dataset.
Economy Monitoring Quarterly Update (EMQU) April 2021 21Information Classification: PUBLIC
Employees 78.9 85.9 0.9
Self employed 20.9 13.8 1.5
Full-time 68.1 75.6 0.9
Part-time 31.8 24.3 1.3
[The ratio shows with the figure for Cornwall divided by the UK figure. E.g. 3.6 divided by
4.2 gives a ratio of 0.9. Numbers greater than 1 show Cornwall has a higher percentage
than the UK, less than 1 shows that Cornwall has a lower percentage share than the UK.]
All employment, flexible and 65+
The 16 plus+ group fell over the year, as did the numbers of economically inactive and
those employed. Numbers of those who were economically active and unemployed rose.
Those working on a non-permanent/flexible basis rose over the year by 5,800 from
10,000 to 16,200.
Table 5.7: Labour market indicators 16+
Jan-19 Apr-19 Jul-19 Oct-19 Jan-20
Change
Dec-19 Mar-20 Jun-20 Sep-20 Dec-20
Year
No’s No’s No’s No’s No’s Qtr
ago
16+ 470,100 468,800 467,000 468,100 461,100 -7,000 -9,000
Econ active 272,500 277,400 274,800 277,800 273,300 -4,500 800
Econ inactive 197,700 191,400 192,100 190,400 187,900 -2,500 -9,800
Employed 263,800 268,800 266,100 267,700 262,000 -5,700 -1,800
Unemployed 8,600 8,700 8,700 10,000 11,300 1,300 2,700
Employees 204,700 209,600 204,100 203,000 199,300 -3,700 -5,400
Self-employed 56,800 57,200 60,600 63,400 62,100 -1,300 5,300
Non-permanent
10,000 12,100 17,500 17,000 16,200 -800 6,200
employment
The share of those in employment rose over the year, as did the unemployment rate. The
rate of those in non-permanent employment moved up from 3.8% to 6.2% 24.
24
Those working on a non-permanent basis as a % of all employed 16+.
Economy Monitoring Quarterly Update (EMQU) April 2021 22Information Classification: PUBLIC
Table 5.8: Labour market indicators 16+
Jan-19 Apr-19 Jul-19 Oct-19 Jan-20
Change
Dec-19 Mar-20 Jun-20 Sep-20 Dec-20
% % % % % Qtr Year ago
Econ active 58 59.2 58.9 59.3 59.3 0.0 1.3
Econ inactive 42 40.8 41.1 40.7 40.7 0.0 -1.3
Employed 56.1 57.3 57 57.2 56.8 -0.4 0.7
Unemployed 3.2 3.1 3.2 3.6 4.1 0.5 0.9
Employees 77.6 78 76.7 75.8 76.1 0.3 -1.5
Self-employed 21.5 21.3 22.8 23.7 23.7 0.0 2.2
Non-permanent
3.8 4.5 6.6 6.4 6.2 -0.2 2.4
employment
The latest figures show that there were 16,700 people aged 65 plus in the workforce. This
represents 6.4% of the workforce, up from the figure of 4.1% a year earlier. All details in
Table 5.9.
Table 5.9: Labour market indicators 16+
Jan-19 Apr-19 Jul-19 Oct-19 Jan-20 Change
Year
Dec-19 Mar-20 Jun-20 Sep-20 Dec-20 Qtr
ago
Group No's No's No's No's No's No's No's
65+ 10,900 14,000 13,500 15,900 16,700 800 5,800
16-64 252,900 254,800 252,600 251,800 245,300 -6,500 -7,600
All 263,800 268,800 266,100 267,700 262,000 -5,700 -1,800
Group % % % % % % %
65+ 4.1 5.2 5.1 5.9 6.4 0.4 2.2
16-64 95.9 94.8 94.9 94.1 93.6 -0.4 -2.2
All 100 100 100 100 100 0 0
Source: NOMIS, Annual Population Survey, 20 April 2021.
Economy Monitoring Quarterly Update (EMQU) April 2021 23Information Classification: PUBLIC
6 Labour market - Workplace data
Table 6.1 shows all those in employment, including those aged 65+, whose workplace is
in Cornwall 25, up to the year ending December 2020. The data shows there were 243,400
working in Cornwall. Of these 60,000 were self-employed, with 169,600 employees, and
with another13,800 employees deemed to be working on a flexible basis. Compared to
the previous quarter total employment fell back with a significant decline in employee,
partially offset by growth in the numbers of the self-employed and flexible workers. Over
the year numbers in employment fell back, due to a significant fall in employee numbers,
while the number of self-employed and those on flexible contracts increased.
Table 6.1: Workplace Employment (No’s)
Period Change
Jan-19 Apr-19 Jul-19
Oct-19 Jan-20
Prev Year
Mar-
Dec-19 Jun-20 Sep-20 Dec-20 Qtr ago
20
Group No's No's No's No's No's No's No's
Employees 194500 191500 178500 173900 169600 -4300 -24900
Self-employed 52900 54100 57400 59200 60000 800 7100
Other flexibility 8100 9500 14000 12400 13800 1400 5700
All 255500 255100 249900 245500 243400 -2100 -12100
Over the year as a share of the workforce, the self-employed share was up by 3.9% points,
while the employee share fell by 6.4% points. In contrast, those on flexible contracts
moved up by 2.5% points. All data in Table 6.2.
Table 6.2: Workplace Employment (%)
Period Change
Jan- Apr- Jul- Oct- Jan-
19 19 19 19 20 Prev Year
Dec- Mar- Jun- Sep- Dec- Qtr ago
19 20 20 20 20
Group No's No's No's No's No's No's No's
Employees 76.1 75.1 71.4 70.8 69.7 -1.2 -6.4
Self-employed 20.7 21.2 23.0 24.1 24.7 0.5 3.9
Other flexibility 3.2 3.7 5.6 5.1 5.7 0.6 2.5
All 100 100 100 100 100 0 0
25
Data has been reweighted in line with the latest ONS estimates.
Economy Monitoring Quarterly Update (EMQU) April 2021 24Information Classification: PUBLIC
Fig 6.1 shows workplace employment since 2004. Numbers peaked in early 2008 pre-
recession, with a decline and lower figures before peaking in mid-2014 and falling back
to late 2015. There was then a recovery in numbers up to late 2016. Since early 2019,
numbers for both categories have declined, the total from 263,500 to 243,4000, and 16-
64 from 243,900 to 227,800.
[Some of the movement in the data reflects the sample size; however, the dip from mid-
2013 to 2015 seems real enough].
Fig 6.1: Workplace workforce
270,000
260,000
250,000
240,000
No's
230,000
220,000
210,000
200,000
04 05 06 07 08 09 10 11 12 13 14 15 16 17 18 19 20
16-64 All
Sixty-five plus
Fig 6.2 illustrates what has happened to those aged 65 plus in the workplace workforce.
Overall since 2004 there has been a general upward trend in both the numbers and share
of the workforce of those aged 65 plus. In 2004 there were 6,600 followed by an upward
trend until the 2011 downturn. From 2014 onwards, numbers recovered to peak in late
2016 at 20,000. Numbers then fell back before rising from early 2017 onwards to peak at
20,100 in 2018. Since then the total has seen a downward movement in each quarter but
with an upturn in the last three quarters and now stands at 15,600.
Economy Monitoring Quarterly Update (EMQU) April 2021 25Information Classification: PUBLIC
Fig 6.2: 65+ workforce
25000 9
8
20000 7
6
15000
5
No's
%
4
10000
3
5000 2
1
0 0
04 05 06 07 08 09 10 11 12 13 14 15 16 17 18 19
65+ % share
In 2004, the 65+ age group constituted 2.8% of the workforce, by early 2010 it had
reached 6.0%, peaking in 2018 at 7.7%. Since then it has fallen back and now stands at
6.4%.
[NB Workplace data is now provided at both a Cornwall and Cornwall and Isles of Scilly
level. However, there are issues about the accuracy of the latter set of data as the
discrepancy between the two data sets is substantial. Therefore, data for Cornwall is used
instead].
Source: NOMIS, Annual Population Survey, Workplace analysis, 20 April 2021.
7 Coronavirus Job Retention Scheme (CJRS)
Data from HMRC showed that at the end of February 26, 44,400 or 19% of those eligible in
Cornwall and the Isles of Scilly, were furloughed. Of these, 24,500 were female and
20,000 male.
Table 7.1: CJRS Furloughed (28 February 2021)
Area Female Male Total
No's % No's % No's %
United Kingdom 2,244,900 15 2,144,700 14 4,557,100 15
England 1,960,000 16 1,793,500 14 3,753,600 15
South West 207,700 16 174,800 14 382,500 15
Cornwall UA and Isles of Scilly UA 24,500 21 20,000 18 44,400 19
Source: HMRC, Coronavirus Job Retention Scheme Official Statistics, Official Statistics, 25
March 2021.
26
December figures are provisional.
Economy Monitoring Quarterly Update (EMQU) April 2021 26Information Classification: PUBLIC
8 Self-Employment Income Support Scheme
The SEISS is designed to assist those self-employed who have been adversely affected by
the Covid-19 situation. A total of 24,400 in Cornwall and 100 in the Isles of Scilly had been
supported under the scheme up to 31st January 2021. This represented 60% and 55% of
those eligible. Across Cornwall, the highest rates of claim were in St. Austell & Newquay
at 63%, the lowest in North Cornwall at 58%.
Table 8.1: SEISS claims to 31 January 2021
Total Average
Total Total Take-
potentially value of
Area no. of value of Up
eligible claims
claims claims (£) Rate5
population1 (£)
Cornwall UA 40,300 24,400 66,300,000 2,700 60%
Isles of Scilly UA 300 100 500,000 3,500 55%
Parliamentary
Constituencies
Camborne and Redruth 5,800 3,500 9,300,000 2,700 60%
North Cornwall 7,800 4,500 12,300,000 2,700 58%
South East Cornwall 6,500 3,800 10,500,000 2,700 60%
St Austell and Newquay 7,500 4,800 13,400,000 2,800 63%
St Ives 6,900 4,300 11,500,000 2,700 62%
Truro and Falmouth 6,100 3,600 9,800,000 2,800 59%
Source: HMRC, Self-Employment Income Support Scheme, 25 February 2021.
9 Vacancies
In quarter 1 2021 there were 8,202 job postings in Cornwall and the Isles of Scilly. This
was down by 185 (2%) from 8,387 in Q4 2020, but up 17% on the 7,026 in Q1 2020. [NB.
The vacancy data used here is from a different source than that used by ONS at a UK
level].
Fig 9.1: Quarterly totals
10000
8000
6000
No's
4000
2000
0
1 2 3 4 1 2 3 4 1 2 3 4 1 2 3 4 1 2 3 4
2016 2017 2018 2019 2020
Economy Monitoring Quarterly Update (EMQU) April 2021 27Information Classification: PUBLIC
Table 9.1 shows the vacancy numbers for each month this year, the latest for April was
3,265.
Table 9.1: Vacancies by month
Year Month Numbers
2021 Jan 2664
2021 Feb 2625
2021 Mar 2913
2021 Apr 3265
Vacancy data at Parliamentary Constituency level shows that the highest rates – the
vacancy number as a percentage of all those employed aged 16-64 - occurred in Truro &
Falmouth at 2.2% with the lowest rate in St. Ives, at 0.5%.
Table 9.2: Vacancies by Parliamentary Constituency
PC Vacancies % Rate Employed (YE Dec 2020)
Camborne & Redruth 778 0.7 39,100
North Cornwall 1241 1.1 36,000
SE Cornwall 723 0.6 40,200
St. Austell & Newquay 900 0.6 46,600
St. Ives 692 0.5 45,700
Truro & Falmouth 2486 2.2 37,700
Cornwall 6,820 0.9 245,300
[Parliamentary Constituency data based on best-fit towns. Not all vacancies can be
allocated to towns or Parliamentary Constituencies, therefore both numbers and the rate
are an under-estimate of the total. Employed derived from APS resident based, 16-64 age
group]
Truro was the top town accounting for 1,882 or 22.9% of all vacancies. Altogether the
top ten towns accounted for 62.3% of all vacancies.
Table 9.3: Top ten towns
Town No's % Town No's %
Truro 1,882 22.9 Falmouth 393 4.8
Bodmin 490 6.0 Penzance 338 4.1
Redruth 473 5.8 Bude 244 3.0
St. Austell 425 5.2 Launceston 233 2.8
Newquay 406 5.0 Liskeard 227 2.8
Sub-total 5111 62.3
[As % of total vacancies]
Economy Monitoring Quarterly Update (EMQU) April 2021 28Information Classification: PUBLIC
Table 9.4 shows the top 10 vacancies by job title. ‘Staff Nurse’ was the top job title
followed by ‘Care Assistant’ and ‘Healthcare Assistant’.
Table 9.4: Top ten vacancies by job title
Title No's %
Staff Nurse 79 1.0
Care Assistant 71 0.9
Healthcare Assistant 62 0.8
Support Worker 56 0.7
Registered Nurse 53 0.6
Teaching Assistant 46 0.6
Sen Teaching
Assistant 46 0.6
Administrator 41 0.5
Accounts Assistant 38 0.5
Cleaner 33 0.4
Sub-total 525 6.4
[% based on vacancies where the title was given]
Table 9.5 shows vacancies by sector. Not all vacancies can be allocated to a sector, so the
table below presents only a partial picture. The highest share was in ‘Health and social
work’ at 35.6%, then ‘Education ‘at 10.6% and ‘Wholesale, retail & motors’
at 9.7%.
Table 9.5: Vacancies by sector
Code Sector No’s % Code Sector No’s %
Agriculture,
A K Financial & insurance
forestry & fishing 3 0.1 58 1.1
B Mining & quarrying 17 0.3 L Real estate 89 1.7
Professional, scientific
C Manufacturing M
487 9.6 & technical 389 7.6
Administrative &
D Energy N
14 0.3 support services 156 3.1
Water, sewerage &
E O Public admin etc.
waste 49 1.0 132 2.6
F Construction 188 3.7 P Education 540 10.6
Wholesale, retail &
G Q Health & social work
motors 492 9.7 1,809 35.6
Transportation & Arts, entertainment &
H R
storage 113 2.2 recreation 6 0.1
Economy Monitoring Quarterly Update (EMQU) April 2021 29Information Classification: PUBLIC
Accommodation &
I S Other services
food services 366 7.2 66 1.3
Information &
J T Households
communication 109 2.1 5 0.1
All 5088 100.0
[% based on vacancies where the industry sector was named]
Table 9.6 shows the top ten employers including recruitment agencies, with vacancies.
The top employer was the NHS with 754 and then Checkatrade Limited with 147[These
are for identifying local traders and do not represent vacancies as such].
Table 9.6: Vacancies by employer - top ten
Sector No's % Sector No's %
National Health Service 754 19.8 Truro and Penwith College 54 1.4
Checkatrade Limited 147 3.9 Barchester Healthcare 49 1.3
Cera Care 125 3.3 Aggregator Network 48 1.3
Concorde Limited 92 2.4 Falmouth University 42 1.1
Walgreens Boots Alliance 78 2.0 Nurseplus Limited 40 1.1
Sub-total 1429 37.5
[% share based on those vacancies with named employers].
Of the 8,202 jobs advertised, 5,893 (71.8%) were permanent with 1,380 (16.8%)
temporary. 6,438 (78.5%) were full-time, 699 (8.5%) were part-time. 349 (4.3%) were for
jobs where people could work from home.
Table 9.7: Job type
Type No's % Type No's %
Permanent 5893 71.8 Full-time 6438 78.5
Temporary 1380 16.8 Part-time 699 8.5
Internship 28 0.3 Unknown 1065 13.0
Apprenticeships 109 1.3 Work from home 349 4.3
Unknown 792 9.7 All 8202 100
[% based on total vacancies]
0.7% of vacancies were jobs with salaries below £15,000, with 19.8% between £15,000
and £19,999 and 40.4% between £20,000 and £29,999.
Economy Monitoring Quarterly Update (EMQU) April 2021 30Information Classification: PUBLIC
Table 9.8: Salaries
Range No's %
Range No's %
More than £90,000 48 0.9 £40,000 to £49,999 463 8.7
£80,000 to £89,999 34 0.6 £30,000 to £39,999 1,188 22.4
£70,000 to £79,999 62 1.2 £20,000 to £29,999 2,140 40.4
£60,000 to £69,999 88 1.7 £15,000 to £19,999 1,051 19.8
£50,000 to £59,999 189 3.6 £10,000 to £14,999 36 0.7
Total 5,299 100.00
[% share based on those vacancies where a salary was included].
Fig 9.2 shows salaries since Quarter one 2126 for all vacancies. There was a degree of
volatility in 2019 probably reflecting the labour market conditions with lockdowns and
re-openings. After a low of £24,900 in Q3 2020, salaries have moved up to stand at
£26,500 in Q1 2021.
Fig 9.2: Quarterly median salary trends
30000
29000
28000
27000
26000
25000
£
24000
23000
22000
21000
20000
1 2 3 4 1 2 3 4 1 2 3 4 1 2 3 4 1 2 3 4 1
2016 2017 2018 2019 2020 2021
[Labour Insight uses data from real-time job postings. Salary figures are pro rata to reflect
full-time, annual wage status].
Table 9.9 shows vacancies by occupational groups (using the one-digit SOC code).
‘Professional Occupations’ (28.2%), was the largest category.
Table 9.9: Standard Occupational Classification (1 digit)
SOC Occupation No's %
1 Managers, directors and senior officials 768 9.4
2 Professional occupations 2,302 28.2
3 Associate professional and technical occupations 1,077 13.2
Economy Monitoring Quarterly Update (EMQU) April 2021 31Information Classification: PUBLIC
4 Administrative and secretarial occupations 682 8.3
5 Skilled trades occupations 857 10.5
6 Caring, leisure and other service occupations 1,000 12.2
7 Sales and customer service occupations 595 7.3
8 Process, plant and machine operatives 397 4.9
9 Elementary occupations 491 6.0
Total 8,169 100
[% based on total vacancies with an occupation]
Table 9.10 shows vacancies by occupational groups (using the two-digit SOC code). The
top three occupations were: Caring personal service occupations’ (11.0%), ‘Health
professionals’ (10.5%), ‘and ‘Business, media and public service professionals’ (7.3%).
Table 9.10: Top ten occupations (2 digit)
Occupation No's %
Caring personal service occupations 900 11.0
Health professionals 861 10.5
Business, media and public service professionals 598 7.3
Administrative occupations 539 6.6
Science, research, engineering and technology professionals 495 6.1
Corporate managers and directors 456 5.6
Business and public service associate professionals 435 5.3
Science, engineering and technology associate professionals 420 5.1
Sales occupations 393 4.8
Elementary administration and service occupations 381 4.7
Sub-total 5,478 67.1
[% based on total vacancies with an occupation]
Table 9.11 shows that the most required education level is ‘GCSEs, Standard Grades, Level
2S/NVQs’ at 39.2% of the total. However, the figures are only for those vacancies where
the education level is specified. Not all vacancies can be allocated to an education level,
so the table below presents only a partial picture.
Table 9.11: Vacancies by education level
Level No's %
Postgraduate Degrees, Level 5 Certificates/Diplomas, Level 5
31 2.8
S/NVQs
Bachelor's Degrees, Graduate Certificates/Diplomas 349 32.0
Foundation Degrees, HNDs 26 2.4
Economy Monitoring Quarterly Update (EMQU) April 2021 32Information Classification: PUBLIC
HNCs, Level 4 Certificates/Diplomas, Level 4 S/NVQs 70 6.4
A-Levels, Highers, Level 3 S/NVQs 186 17.0
GCSEs, Standard Grades, Level 2 S/NVQs 428 39.2
Level 1 S/NVQs 1 0.1
Total 1,091 100
[% share based on those vacancies with a specified education requirement]
Table 9.12 shows the most in demand skills are ‘CUSTOMER AND CLIENT SUPPORT: Basic
Customer Service’ at 33%, and ‘EDUCATION AND TRAINING: Teaching’ at 23%. Not all
vacancies have required skills, so the table below presents only a partial picture. Of those
vacancies where skills were included, many may have several required skills listed 27.
Table 9.12: Top ten skill clusters
Skill cluster No's %
CUSTOMER AND CLIENT SUPPORT: Basic Customer Service 947 33
EDUCATION AND TRAINING: Teaching 650 23
BUSINESS: People Management 524 18
SALES: General Sales 478 17
INFORMATION TECHNOLOGY: Microsoft Office And Productivity Tools 451 16
FINANCE: Budget Management 442 15
PERSONAL CARE AND SERVICES: Food and Beverage Service 424 15
FINANCE: General Accounting 369 13
ADMINISTRATION: General Administrative and Clerical Tasks 324 11
HEALTH CARE: Mental and Behavioural Health Specialties 310 11
[% based on those vacancies where the information was available]
Table 9.13 shows the top ten certifications in demand, headed by the ‘Disclosure and
Barring Service (DBS) Clearance’.
Table 9.13: Top ten Certifications required
Certification No's
Disclosure and Barring Service (DBS) Clearance 979
Construction Skills Certification Scheme (CSCS) Card 191
Registered General Nurse (RGN) 114
Cavendish Care Certificate 95
Nursing and Midwifery Council (NMC) Registration 70
Health and Care Professions Council (HCPC) Registration 43
HGV Licence 42
27
For skill clusters, unspecified postings are those that have fewer than three skill clusters listed.
Economy Monitoring Quarterly Update (EMQU) April 2021 33Information Classification: PUBLIC First Aid at Work 40 Moving and Handling Certificate 34 General Medical Council (GMC) Registration 28 Forklift Truck Licence 28 City and Guilds Diploma in Accounting 28 AAT/City and Guilds Certificate in Accounting 28 Table 9.14 below shows vacancies by automation risk level. Although the low risk level is the largest category at 51% of vacancies, there were 17.2% of vacancies at a high risk of being automated. Table 9.14: Vacancies by automation risk level Automation risk level No's % High 1410 17.2 Medium 2553 31.1 Low 4185 51.0 NA 54 0.7 All 8202 100 [% share based on total vacancies] The table below shows the top vacancies (10 or more) at the highest risk of automation. Table 9.15: Vacancies with highest risk of automation (50 or more) Occupation No's Other administrative occupations n.e.c. 218 Chartered and certified accountants 177 Book-keepers, payroll managers and wages clerks 128 Sales and retail assistants 103 Elementary construction occupations 87 Kitchen and catering assistants 76 Receptionists 65 Source: Labour Insight/Jobs, Active Informatics. Economy Monitoring Quarterly Update (EMQU) April 2021 34
Information Classification: PUBLIC

10 Housing
Quarterly mean house prices
In Q4 2020, house prices averaged £256,300 up from £241,900 in Q3 2020, and up from
£236,700 in Q4 2019.
House prices peaked in Q4 2007 at £216,200; they then fell back to £180,800 in Q2 2009.
There was then a recovery with prices reaching £199,400 in Q4 2010. This was followed
by a decline down to £187,700 in Q4 2012. Thereafter prices rose to reach £212,500 in
Q4 2015 then fell back. Since Q4 2016 prices have increased to reach £232,700 in Q4
2018, before falling back but have since resumed an upward trend. Prices have now been
above the Q4 2007 peak of £216,200 for the last 14 quarters.
House prices in Cornwall equal 104% of the UK average, up from 102% in Q4 2019.

    £
                      Fig 10.1: House prices by quarter
   300000

   250000

   200000

   150000

   100000

    50000

        0
            1995

                   1998

                            2001

                                     2004

                                              2007

                                                       2010

                                                                2013

                                                                         2016

                                                                                    2019

Monthly mean house prices
In February, house prices in Cornwall averaged £266,246, up 0.6% on the January total of
£264,757. The 0.6% increase compares to a 0.9% increase for England and 0.5% increase
for the UK.
“Recent price increases may reflect a range of factors including pent-up demand, some
possible changes in housing preferences since the pandemic and a response to the
changes made to property transaction taxes across the nations”. [ONS]
Source: Land Registry, House Price Index, 21 April 2021.

Quarterly median house prices, Land Registry
“The quarterly House Price Statistics for Small Areas also use the Land Registry data, but
they report simple median house prices which are not mix-adjusted. These figures give an
indication of the price of properties which actually sold in a given period and area (they're
also available for small geographic areas). Note that these figures cover a rolling 12-
month period, to ensure that a robust median price is reported, and this is updated each
quarter”.

Economy Monitoring Quarterly Update (EMQU) April 2021                              35
You can also read