Ecosystem Goods and Services Valuation Report - Mataniko Watershed Catchment 2022 - Pacific R2R
←
→
Page content transcription
If your browser does not render page correctly, please read the page content below
Ecosystem Goods Services – using Freshwater Health Index for
                                                          Waimanu Catchment

Ecosystem Goods and Services
      Valuation Report

Mataniko Watershed Catchment
            2022

                                                                                  A
Ecosystem Goods and Services
      Valuation Report
Mataniko Watershed Catchment
                              2022

                         Prepared by
                        Joseph Airahui
       Environmental Consultant - Honiara. Solomon Islands

                     Produced and published by
   GEF Pacific International Waters Ridge to Reef Regional Project,
                  Pacific Community (SPC), Suva, Fiji

                         Suva, Fiji, 2022

                                                                      i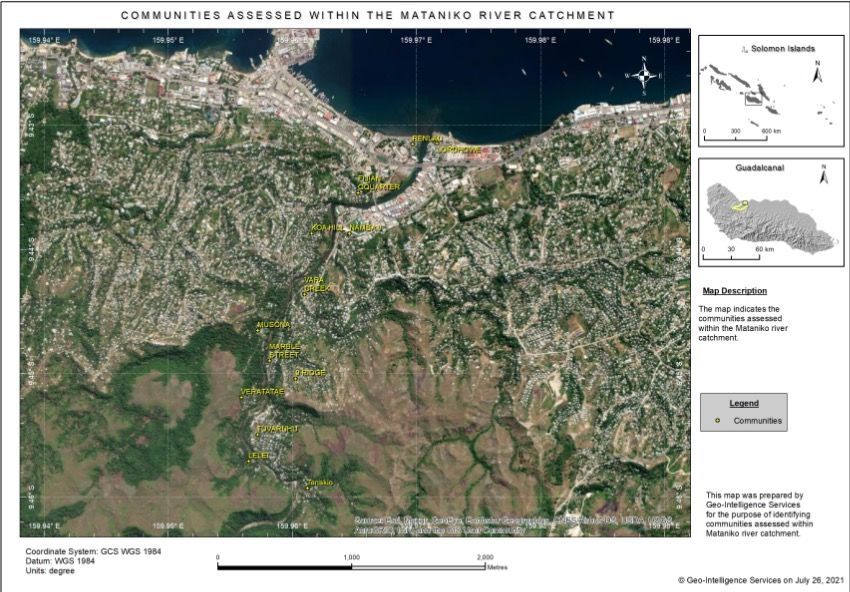
© Pacific Community (SPC) 2022
     All rights for commercial/for profit reproduction or translation, in any form, reserved. SPC authorises the partial
     reproduction or translation of this material for scientific, educational or research purposes, provided that SPC
     and the source document are properly acknowledged. Permission to reproduce the document and/or translate
     in whole, in any form, whether for commercial/for profit or non-profit purposes, must be requested in writing.
     Original SPC artwork may not be altered or separately published without permission.

                                                   Original text: English

     Citation Boseto, D. 2021. Solomon Islands National Pilot Project Area Diagnostic Report. Prepared for the Ministry
     of Environment, Climate Change, Disaster Management and Meteorology, Solomon Islands Government,
     Honiara. Produced and published by GEF Pacific International Waters Ridge to Reef Regional Project, Pacific
     Community (SPC), Suva, Fiji, 20pp.

     Reviewed by George Naboutuiloma, Samasoni Sauni, Salome Taufa, Fononga Vainga Mangisi-Mafileo, John
     Carreon and Aliti Vunisea.

     Conceptual Design: Navneet Lal, Pacific Community (SPC)

     Layout and Design: Sailesh Sen, Tanisha Graphics

     Cover Photo: Vuniniudrovu villagers planting vetiver grass to control soil erosion along the Waimanu river

     Produced by GEF Pacific International Waters Ridge to Reef Regional Project, Pacific Community (SPC), Suva, Fiji.

                                 Prepared for publication at SPC’s Suva Regional Office,
                                            Private Mail Bag, Suva, Fiji, 2022
                                               www.spc.int | spc@spc.int
                                         Printed by Quality Print, Suva, Fiji, 2022

ii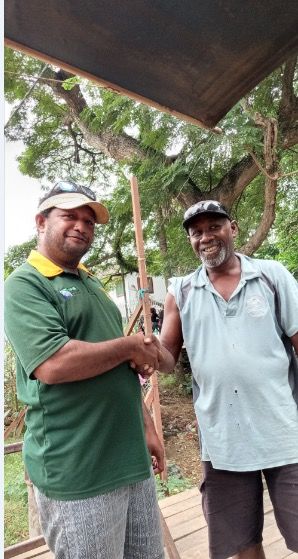
Ecosystem Goods and Services Valuation Report
                                                                                                                                                Mataniko Watershed Catchment

CONTENTS
ABBREVIATIONS...................................................................................................................................................... iv

LIST OF FIGURES....................................................................................................................................................... v

LIST OF TABLES......................................................................................................................................................... v

EXECUTIVE SUMMARY............................................................................................................................................ vi

1 INTRODUCTION................................................................................................................................................... 1

2 OBJECTIVE.............................................................................................................................................................2

3 LIMITATION...........................................................................................................................................................3

4 METHODOLOGY...................................................................................................................................................4

5 SURVEY HOUSEHOLD POPULATION................................................................................................................5

6 SCOPE.....................................................................................................................................................................6

7 RESULTS AND ANALYSIS.....................................................................................................................................7
     7.1 Total Number of interviewed Households.............................................................................................................. 7
     7.2 Sex disaggregated data for each of the surveyed households within the communities....................... 7
		           7.2.1 Local Population Statistics................................................................................................................................ 8
     7.3 Types of Ecosystem......................................................................................................................................................... 9
		           7.3.1 Ecosystem Goods................................................................................................................................................. 9
		           7.3.2 Ecosystem Services............................................................................................................................................. 9
		           7.3.3 Key Summary of Ecosystem Goods Valuation......................................................................................... 10

8 SUMMARY OF MATANIKO ECOSYSTEM GOODS AND SERVICES VALUATION.......................................... 13

9 REFERENCE.......................................................................................................................................................... 14

ANNEX A: PHOTOGRAPHS OF THE SURVEY........................................................................................................ 15

ANNEX B: SURVEY MATRIX..................................................................................................................................... 16

ANNEX C.................................................................................................................................................................... 17

                                                                                                                                                                                         iii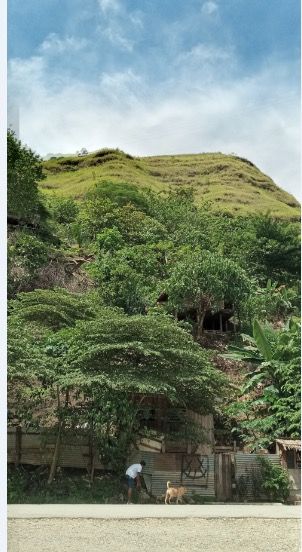
Abbreviations
     EBA      Ecosystem Base Adaptation
     EGS      Environment Goods and Services
     ESSI     Ecological Solutions Solomon Islands
     EST      Ecosystem Services Toolkit
     GEF      Global Environment Facility
     GIS      Geospatial Information System
     Ha       Hectare
     IUCN     International Union for Conservation of Nature
     IW-R2R   International Waters Ridge to Reef
     MECDM    Ministry of Environment, Climate Change and Disaster Management and Meteorology
     NDS      National Development Strategy
     PA-BAT   Protected Areas Benefit Assessment Tool
     PES      Payment for Ecosystem Services
     R2R      Ridge to Reef
     SIG      Solomon Islands Government
     SPREP    Secretariat of the Pacific Regional Environment Programme
     TESSA    Toolkit for Ecosystem Service Site-based Assessment

iv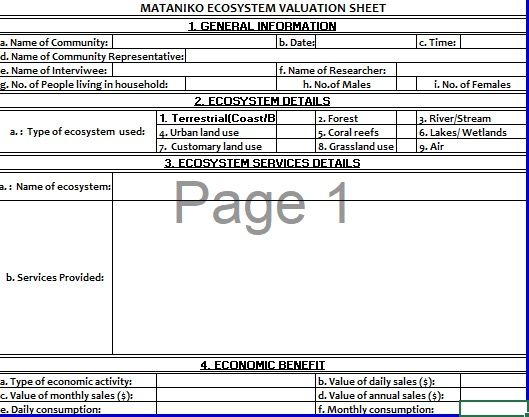
Ecosystem Goods and Services Valuation Report
                                                                                                                                                       Mataniko Watershed Catchment

List of Figures
Figure 1 The map below shows the location of the study sites. Source (GIS Unit, MECDM, 2021)..........................6

List of Tables
Table 1          List of Communities Surveyed within the Mataniko Watershed........................................................................6
Table 2          Types of Ecosystems observed in the survey............................................................................................................6
Table 3          Summary table of the number of households and communities in the survey...........................................7
Table 4          Average sex aggregated data of the households surveyed in selected communities..............................7
Table 5          Estimated Population of the communities within the Mataniko Watershed.................................................8
Table 6          Types of goods that are provided by each of the three (3) ecosystems..........................................................9
Table 7          Types of provisioning services offered by the Mataniko catchment system.................................................9
Table 8          Summary table of the Ecosystem Goods Valuation (i.e., estimated monetary values)............................11
Table 9          Renlau Community...........................................................................................................................................................17
Table 10 Ridge Community.............................................................................................................................................................17
Table 11 Koa Hill Community.........................................................................................................................................................17
Table 12 Tuvaruhu Community..................................................................................................................................................... 18
Table 13 Lelei Community.............................................................................................................................................................. 18
Table 14 Musona Community....................................................................................................................................................... 18
Table 15 Vara Creek Community.................................................................................................................................................. 19
Table 16 Number 3 Community................................................................................................................................................... 19
Table 17 Fijian Quarter Community............................................................................................................................................ 19
Table 18 Cana Hill Community...................................................................................................................................................... 20

                                                                                                                                                                                                 v
EXECUTIVE SUMMARY
The Consultant carried out work on the Mataniko Catchment Ecosystem Goods and Services valuation from
the 19th of May 2021 to 07th July 2021. Survey fieldwork was conducted on 70 households randomly selected
from twelve (12) communities along the Mataniko Watershed area, starting from Renlau informal settlement at
the lower catchment area to Lelei informal settlement at the upper catchment area of the Mataniko River. The
household surveys aimed to estimate the value of ecosystem goods and services in the Mataniko Catchment.
Consequently, the study estimated the total monetary value of ecosystem goods in the Mataniko Catchment
at a little over US$402,000 a year; the value of ecosystem services is unknown. There was potential difference
comparing ecosystem goods valuation of the three ecosystems, with terrestrial ecosystem goods valuation
dominating at over US$360,000, followed by coastal ecosystem at close to US$30,000 and freshwater ecosystem
at around US$14,000.
The study adopted a basic economic valuation approach, which rely on combination of revealed and stated
preference methods, as well as cost-based approaches. The report referenced other tools available that provide
for the determination of quick estimates and capturing the values of the ecosystem goods and services –
examples: ecosystem services toolkit (EST), toolkit for ecosystem service site-based assessment (TESSA), and
protected areas benefit assessment tool (PA-BAT).
There are limitations in the study and worth considering before the results can be reliably used to guide
preparation of strategic policies and management plans. There was limited accessibility to, or lack of new data
for Environment Goods and Service (EGS) valuation. The study did not collect both market and non-market
information and use and non-use values, which are important datasets for EGS valuation. Rather, the study
only concentrated on household surveys to collect market and use values of three (3) selected ecosystems –
terrestrial ecosystem (forest, agriculture), freshwater ecosystem (flora/fauna), and coastal (beach, intertidal
zones). Therefore, the information collected was incomplete for capturing full inventory of goods and services
valuation estimates for the Mataniko Catchment.
In 2018, a similar study was also being conducted by the SPREP on the Ecosystem Based Adaptation Assessment
in the whole of Honiara, Solomon Islands. This study set out to identify and determine the whole ecosystem
goods and services that are available for residents and other informal settlements within the Honiara City
boundary. The study did not extend to cover the full valuation of ecosystem goods and services documented for
Honiara. Nonetheless, the results provide useful reference in the conduct of the Mataniko catchment valuation.
The household survey in the current study has a wider scope and some of the data might are estimates or best
guess and based on actual facts and statistics. For example, the watercress plant is introduced and growing only
several locations along the Mataniko River, which provide alternative and subsistence food provision for local
communities. At the Mataniko watershed area, there was no watercress aquaculture farms or even an area along
the river where the watercress is growing naturally. This is one of the factors which have prompted the need for
the ecosystem valuation to be carried out in specific locations along the Mataniko Watershed area.
Notwithstanding, the results in this study provide useful starting points and inputs in the preparation of the
Mataniko Integrated Catchment Management Plan, and to fulfill the project theme, “Integrating watershed and
coastal area management for strengthened water resource protection and coastal hazard reduction in Honiara,
Solomon Islands”. It is recommended that a more complete and comprehensive ecosystem goods and services
valuation of the Mataniko Catchment can be carried out to better inform strategic policies and plans into the
future.
viEcosystem Goods and Services Valuation Report
Mataniko Watershed Catchment
1 INTRODUCTION
In early 2020 the Ministry of Environment, Climate Change, Meteorology and Disaster Management, through the
Solomon Islands International Waters Ridge to Reef (IW R2R) Project, commissioned a consultancy to undertake
an Ecosystem Goods and Service (EGS) Valuation for the Mataniko watershed catchment. The rationale of the
GEF/SPC IW R2R Project Implementation in the Solomon Islands is reflected in its title, “Integrating watershed
and coastal area management for strengthened water resource protection and coastal hazard reduction in
Honiara, Solomon Islands”.
The Ecological Solutions Solomon Islands (ESSI) consulting entity was selected and following brief inception and
planning meetings, commenced household surveys targeting seventy (70) households randomly selected from
twelve (12) select communities along the Mataniko catchment from 19th May to 7th July 2021.
Generally, the Ecosystem Goods and Service Valuation for the Mataniko Watershed communities is very important
to support the Solomon Islands Government’s long-term policies and legislative frameworks on Environment
and the Biodiversity Protection and Restoration. For instance, the Solomon Islands Government (SIG) approved
National Development Strategy (NDS) 2016-2035 working document objective four, which supports the
mitigation and adaptation efforts towards the negative impacts of climate change, resilient developments, and
disaster risk management. The results of this study will contribute towards the greater achievements of the
entire NDS 2016-2035 framework of the SIG within the specified time schedule by the year 2035. The study
investigated three main ecosystems of the Mataniko Watershed, which are: - forest ecosystem, water ecosystem
and the terrestrial ecosystem.
The household survey was carried out using simple methodologies coupled with other community approach
techniques to retrieve the specific information relevant for the study. The study encountered several setbacks
and challenges during the course of this study. The details on limitations are provided briefly in the executive
summary section earlier and later sections of this report.
Furthermore, this report is predominantly focused on how each of the surveyed households within the
respective communities have utilized the goods and the services of the Mataniko catchment ecosystems. It is
generally established that the dependency and utilization of ecosystem goods and services is linked to effective
participation in a range of micro economic activities that supported the livelihoods and alternative earnings.
Therefore, the household surveys aim at collecting market and resource use data, which in turn, dataset will be
analyzed to generate estimates of economic monetary values.
For instance, relevant data from household surveys and interviews can help with the calculation of the economic
value to consume garden food compare with the monetary values that would have spent on direct purchase at
the Honiara Central Main Market, for daily and monthly consumption, as an example.
12 OBJECTIVE
The two objectives of the study are: -
a. To have an overall view on how the Mataniko Watershed communities are utilizing the ecosystem goods
and services; and
b. To carry out a valuation of the ecosystem goods and services in the Mataniko Watershed communities.
2Ecosystem Goods and Services Valuation Report
Mataniko Watershed Catchment
3 LIMITATION
This study encountered the following limitations: -
• Certain interviewees tend to ask for money in exchange for information for the survey which if not handled
properly may lead to inaccurate information to questions;
• The unpredictable weather pattern (rain) of the country disrupting planned schedule to conduct the
survey;
• The number of households planned for interviews at each community reduced from ten (10) to around
5-7 houses;
• Limited access to non-market and non-use resources dataset; if this data was available and added on to
market and resource use data should generate a more complete accurate evaluation of ecosystem goods
and services;
• The whole study is dependent on household surveys and interviews; a valuation of the SPREP study on
documented goods and services for Honiara and scaled down to Mataniko Catchment alone would be
more ideal; and
• There are IUCN ecosystem valuation reports for the Solomon Islands published and available; this
study could have benefited from the use of those past studies and use the same methods for accurate
comparison.
34 METHODOLOGY
For this survey, the consultants gathered the information from the communities on the basis of applying simple
approaches. The first approach was on the identification of the communities and the informal settlements
who are living along the Mataniko River and those that are in close proximity to the Mataniko River. After
identification of the communities and the informal settlements, a list of the community names was generated.
Based on the list of the community names, the identification of the number of households took place. Since
most of these communities have been involved in various surveys with other different organizations such
as the Oxfam and SPREP in the past, they have setup their own community committees whereby they have
appointed a Chairperson or a community representative who was in charge of any outside activities that was
to be carried out within their respective communities. Secondly, after identifying the communities with their
official communal representatives, a contact point was established and the delivery of the invitation letter for
the community participation was distributed to them. The chairpersons then inform their respective community
households on the proposed survey and the expected dates that the survey team will visit their households.
Prior to these arrangements with the communities, the survey matrix was developed in preparation for the
survey fieldwork. Then finally, the proceeding of this survey can go ahead after the community representatives
has given the authority for the survey team to conduct the EGS survey within their communities. Hence, the
other methodologies such as observation, interviews and photograph snap shots were taken during the actual
survey to fulfill the requirements of this task.
4Ecosystem Goods and Services Valuation Report
Mataniko Watershed Catchment
5 SURVEY HOUSEHOLD POPULATION
The number of households that was determined for the survey was one hundred (100) households, however,
only seventy (70) households was surveyed based on the allowable timeframe for this survey. This is 0.7% out of
the total number of determined households at 1% which is more than half of the required household number.
The researcher used the non-randomized research technique to assist in the determination of the appropriate
sample number of households to survey amongst selected communities.
56 SCOPE
The survey starts from Lelei community at the upper catchment area and extends down to Renlau community at
the river mouth area by the sea. There are twelve (12) communities that are being identified for this Ecosystem
Goods and Service Valuation along the Mataniko watershed area. The survey excludes Tanakio community,
which was situated further up the river catchment area as shown on the map Figure 1. It was considered too
difficult working in this community.
Figure 1. The map below shows the location of the study sites. Source (GIS Unit, MECDM, 2021)
The communities surveyed are listed on Table 1 and the common ecosystems considered for this survey are
listed on Table 2. However, due to unforeseen circumstances, only 3 out of the 9 ecosystems listed in the table
were surveyed.
Table 1. List of Communities Surveyed
within the Mataniko Watershed. Table 2. Types of Ecosystems observed in the survey.
No. Communities 1. Terrestrial 4. Urban Land Use 7. Customary Land Use
2. Forest 5. Coral Reefs 8. Grass Land Use
1 Lelei 7 Kena Hill
3. Streams/Rivers 6. Lakes/Wetlands 9. Air
2 Tuaruhu 8 Vara reek
3 Ngalitatae 9 Number 3
4 Marble Street 10 Fijian Quarter
5 9 Ridge 11 Renlau
6 Musona 12 Koa Hill
6Ecosystem Goods and Services Valuation Report
Mataniko
Ecosystem Goods Watershed
and Services Catchment
Valuation Report
Mataniko Watershed Catchment
7 RESULTS
7.1 Total Number of interviewed Households
Table 3 presents the total number of houses that were interviewed at each selected community along the
Mataniko watershed area. There were seventy (70) houses surveyed in twelve (12) communities. The number of
houses in these communities’ range between 5 and 7.
Table 3. Summary table of the number of households and communities in the survey.
Total Number Of Household Surveyed
Name of Community No. of Household
9 Ridge 5
Koa Hill 6
Tuvaruhu 7
Lelei 5
Musona 6
Ngalitatae 6
Marble street 6
Vara Creek 6
Number 3 5
Fijian Quarter 5
Renlau 6
Kena Hill 7
Total household 70
7.2 Summary table showing the average sex
aggregation data for each of the surveyed
communities
Table 4 shows the average sex aggregated data of the households surveyed in selected communities. The sex
disaggregated data of the households surveyed in selected communities, and the total numbers of males and
females across average households can be found in Annex C.
Table 4. Average sex aggregated data of the households surveyed in selected communities.
Total No. of households
Community Av. Number of males Av. Number of females
surveyed
Renlau 6 5.3 5.3
Ridge 5 3.2 4.8
Koa Hill 6 4.3 6
7Total No. of households
Community Av. Number of males Av. Number of females
surveyed
Tuvaruhu 7 4.7 6
Lelei 5 3.2 3.8
Musona 6 3.8 3.3
Vara Creek 6 4 5
Number 3 5 6.6 9
Fijian Quarter 5 7.4 10.8
Cana Hill 7 3.4 5
7.2.1 Local Population Statistics
During the course of this survey, the estimated population data was also retrieved from the visited sites along
the Mataniko watershed area.
Table 5. Estimated Population of the communities within the Mataniko Watershed.
Name of Total number of Average number of
No. Total population
community households (estimate) household members
1 Tuvaruhu About180 5 More than 800
2 Lelei 22 5 Less than 115
3 Ngalitatae 22 7 150
4 Musona 21 5 110
5 Marble street 58 5 Less than 300
6 Nine (9) ridge 100 5 500
7 Cana hill 75 5 Less than 400
8 Vara Creek 65 5 About 320
9 Number 3 68 5 About 334
10 Fijian quarter 22 5 110
11 Koa hill 240 7 1700
12 Renlau 95 5 475
Total 968 64 5,314
Total number of household Total number of survey household
Total number of Survey household
members (estimate) in % (Actual)
70 968 7.2%
Note
1. This data was retrieved from the Community Elders and the chiefs who have resided within the identified communities
for more than 20 years.
2. People who moved into these communities on a short-term basis, for example, renting residential homes are not
counted.
3. Empty houses with non-occupants are not counted.
4. This data was based on the actual estimates that was done with the community chairperson(s) and the chiefs during
the survey.
8Ecosystem Goods and Services Valuation Report
Mataniko Watershed Catchment
7.3 Types of Ecosystems
The study found three (3) ecosystems; Forest, Water/River and Coastal Ecosystem that was primarily used and
accessed by the Mataniko watershed communities. This was lower compared to the nine (9) ecosystems originally
identified in the planning stage and documented in chapter 6 of this report. These three (3) ecosystems have
provided some of the needed goods and services for the communities in terms of supporting their livelihoods
whilst living in Honiara. These are specified in the sections below.
7.3.1 Ecosystem Goods
Several households within the surveyed communities have utilized and benefited from the Mataniko catchment
ecosystem goods as set out below in Table 6.
Table 6. Types of goods that are provided by each of the three (3) ecosystems.
ECOSYSTEM GOODS
Timber, firewood, traditional medicines, bush materials, sago palm, source of food-wild pigs,
a. Forest
possum, ara’arana (heron bird), leaves for motu (lovo),turmeric and ginger.
Source of food fish, mussels, eels, freshwater prawns, kangku, source of drinking water, riverbank
b. Fresh Water/River
gravels, stones, and sand.
Source of marine food fish (buma, roma, katukatu, mamula, shark and stingray), prawns, eels,
c. Coastal
Sand, and gravel.
Based on the study findings, there was a significant decrease in the number of ecosystem goods in the Mataniko
watershed area. This was a foregone conclusion due to the rapid growth of the local population in the area
as a result of increased urbanization rates. As a result, there was a greater demand for housing and informal
settlements, putting more pressure on the harvesting and extracting of ecosystem goods, resulting in its
depletion within the Mataniko watershed area.
According to the SPREP assessment report (EBA Options Assessment and Masterplan for Honiara, 2018), “Honiara
is experiencing rapid rural- urban migration, predominantly in informal settlements that are highly exposed to the
multiple natural hazards, overcrowding and lack of basic service provisions. In both the upper and lower catchments,
many households are largely subsistence-based relying heavily on the ecosystem services for their water and food
provisions, shelter, income-generation and overall health and well-being.” This confirms the current situation at the
Mataniko Watershed area as well as it also faces the same problems as experienced within other parts of Honiara.
7.3.2 Ecosystem Services
Table 7. Types of provisioning services offered by the Mataniko catchment system.
ECOSYSTEMS ECOSYSTEM SERVICES
• Supports forest habitats and biodiversity.
• Protects soil losses from erosions and stabilization of land.
• Supports reforestation and botany.
• Support livelihoods of species population through the provision of food supply, firewood, and
timber.
a. Forest • Supports flora and fauna distribution and speciation.
• Supports the regulatory function of the natural carbon and nutrient cycles.
• Supports the logging and milling industry.
• Supports cultural identifications-cultural taboo sites.
• Support the provision of waste management. (toilet and sanitation).
• The provision of raw bush materials-sago palm leaves and wood for housing.
9ECOSYSTEMS ECOSYSTEM SERVICES
• Supports freshwater habitats and biodiversity.
• Provision of smooth flow and efficient water channeling.
• Supports provision of freshwater replenishment
• Support the normal hydrological processes.
• Supports flora and fauna distribution and speciation.
• Supports the regulatory function of the natural underwater carbon and nutrient cycles.
• Supports the recreational purposes such as bathing and swimming.
b. Fresh Water/River • Supports cultural identifications-cultural taboo sites.
• Support the provision of waste management. (soak way, toilet, and sanitation).
• Support the tourism sector through river trekking to the waterfall.
• Provision of income generation- River crossing on rafts and the sale of freshwater goods such
as prawns and mussels.
• Provision of residential waste disposals for plastics and trashcans.
• Provision of river gravel, sand, and stones for residential and commercial use.
• Provision of rock breakdown-gobbles, gravels, sand.
• Supports terrestrial habitats and biodiversity.
• The beach supports the provision of renewable energy replenishment rates.
• Provision of protecting the shoreline from coastal erosion.
• Regulating flood control and climate regulation.
• Provision of supporting normal hydrological cycle.
• Supports the flora and fauna distribution and speciation.
• Supports the regulatory function of the natural carbon and nutrient cycles.
• Supports the recreational purposes such as bathing, swimming, beach soccer, beach volleyball
and other water sports such as water ball.
• The provision of cultural identifications and taboos-such as the saltwater people and the shark
c. Coastal calling.
• Support the provision of waste management. (soak away, toilet and sanitation).
• Support the tourism sector through surfing and sailing.
• Provision of income generation- the sale of seafood such as katukatu, buma, roma, mud crab
and mussels.
• Provision of residential and commercial waste disposals-wreckages, plastics, and trash cans.
• Provision of natural production of gravel and sand for residential and commercial use such as
brick construction and fine sand for concrete wall plastering of residential homes.
• Kastom medicines provided by coastal plants such as Rararo plants to cast out sea evil spirits.
• Provision of artisanal fisheries.
• Provision of wave strength reduction.
For this subsection, the survey found that there were several significant services offered through the Mataniko
catchment ecosystems. Most of these services provisionally support both the natural biological diversity of flora
and fauna species and the human population of the Mataniko watershed communities. The study, however, is
unable of to perform valuation of these ecosystem services in the Mataniko River but the information obtained
can be used as baseline information for future studies.
7.3.3 Key Summary of Ecosystem Goods Valuation
The Ecosystem Goods within the table are derived from the surveyed households of the selected communities
along the Mataniko watershed areas. Based on the information collected and documented from the household
surveys, it is possible to suggest that the Forest ecosystem along the Mataniko River has been significantly used.
Most of this forest ecosystem usage was for collection of firewood for household cooking whilst other usage are
raw bush materials and timber for housing and leaf thatch for outdoor kitchens.
10Table 8. Summary table of the Ecosystem Goods Valuation (i.e., estimated monetary values)
Local Total
Est.
Est. Est. Average Monetary average Total Total
Average Total local
Average N0. Of items EST. Total value/ local value average monetary
ECOSYSTEM Type of goods N0. Of monetary
No. of required/ Hectare goods for 6 mtns local annual value in
people/ value /SBD
Household household item/ SBD/ value USD
household
YR 2021
Sawn Timbers
(e.g., 4x2x12ft- 10 5 50 pieces 1 $42 $630,000 $1,260,000 $1,260,000 $157,500
single piece)
Bundle Firewood 20 5 1 0.5 $30 $9,000 $18,000 $18,000 $2,250
Kastom medicine 5 5 2 0.5 $50 $7,500 $15,000 $15,000 $1,875
Bush materials
5 5 5 1 $100 $75,000 $150,000 $150,000 18,750
(swing vines,
Forest Bush Materials
10 5 50 pieces 2 $30 $450,000 $900,000 $900,000 112,500
(wood)
Sago Palm leave
10 5 5 0.5 $300 $225,000 $450,000 $450,000 $56,250
bundle
Wild pigs 10 5 1 1 $100 $30,000 $60,000 $60,000 $7,500
Araárana
1 5 1 1 $50 $1,500 $3,000 $3,000 $375
(heron bird)
1x Possum 1 5 1 1 $100 $3,000 $6,000 $6,000 $750
1x heap Turmeric 10 5 2 0.5 $10 $3,000 $6,000 $6,000 $750
Land
1x heap Ginger 10 5 2 0.5 $10 $3,000 $6,000 $6,000 $750
Fish 5 5 2 0.5 $10 $1,500 $3,000 $3,000 $375
Eel 5 5 1 0.5 $10 $750 $1,500 $1,500 $187.50
River/
Prawn 10 5 2 0.5 $50 $15,000 $30,000 $30,000 $3,750
Freshwater
Mussels 10 5 1 1 $20 $6,000 $12,000 $12,000 $1,500
Kangku 5 5 2 1 10 $3,000 $6,000 $6,000 $750
Mataniko Watershed Catchment
Ecosystem Goods and Services Valuation Report
1112
Local Total
Est.
Est. Est. Average Monetary average Total Total
Average Total local
Average N0. Of items EST. Total value/ local value average monetary
ECOSYSTEM Type of goods N0. Of monetary
No. of required/ Hectare goods for 6 mtns local annual value in
people/ value /SBD
Household household item/ SBD/ value USD
household
YR 2021
Sand 5 5 10 bags 0.5 $20 $15,000 $30,000 $30,000 $3,750
Stones 5 5 10 bags 0.5 $10 $7,500 $15,000 $15,000 $1,875
Gravel 5 5 10bags 0.5 $10 $7,500 $15,000 $15,000 $1,875
Brick 5 5 50 bricks 0.5 $10 $37,500 $75,000 $75,000 $9,375
Bag sand sales 5 5 20 bags 0.5 $20 $30,000 $60,000 $60,000 $7,500
Fish (buma) 5 5 20 0.5 $20 $30,000 $60,000 $60,000 $7,500
Coastal
(Beach/
Fish (katukatu) 5 5 2 heaps 0.5 $20 $3,000 $6,000 $6,000 $750
Intertidal
zone)
Fish (Mamula) 5 5 1 0.5 $50 $3,750 $7,500 $7,500 $937.50
Fish (Shark) 5 5 1 0.5 $100 $7,500 $15,000 $15,000 $1,875
Sting ray 5 5 1 0.5 $50 $3,750 $7,500 $7,500 $937.50
Note
1. Forest Ecosystem
• Timber SBD$3.50 per lineal meter 12 ft = SBD$42.00 per pieces
• Slaughtered wild pig =SBD$100.00 per plastic
• Sago palm leaves for thatch roofing SBD$300.00 per bundle unit
2. All the values are taken from the current local market value of year 2021.
3. Note that time was not calculated in because the value will increase enormously
4. The Hectare (Ha) refers to the certain space or area in distance that the goods can be found and collectedEcosystem Goods and Services Valuation Report
Mataniko Watershed Catchment
8 SUMMARY OF MATANIKO ECOSYSTEM
GOODS AND SERVICES VALUATION
Despite its limitations, the Ecosystem Goods and Services valuation survey for the Mataniko Watershed
Communities has been a great success for the GEF/SPC IWR2R Project Implementation in the Solomon Islands.
The study identified three (3) main ecosystems where the communities along the Mataniko watershed have
used to support their livelihoods including benefiting from the provisioning of ecosystem services. The results
will assist and provide opportunities for further comprehensive EGS valuation but most importantly, the analysis
and trends emerging from the study are already informative and useful for the project implementing partner
institutions to work on strategic interventions to safeguard the three (3) vulnerable ecosystems of the Mataniko
watershed area.
The study found relatively few ecosystem goods remaining within the Mataniko watershed area. This is due
to the high level of exploitation and usage along with corresponding environmental disturbances which have
occurred to date. For instances, land clearance for residential homes and gardening, informal settlements,
urbanization, and the high population growth, which have put higher demands and pressure on the supply
rates of the ecosystem goods and services.
The increasing human activities in clearing the ecosystem and demands for the ecosystem goods within the
Mataniko Watershed have put a lot of pressures on ecosystem to sustain the goods provided. At the sometime
Mataniko watershed is highly degraded with a very slow rate of replenishments of ecosystem services. For
example, the slow break down level of organic matters in the river for aquatic nutrient cycling. This is largely
influenced by the ongoing heavy discharge of human and animal waste disposals into the Mataniko River from
the residential and other informal settlement population who live up stream.
In conclusion, this study has collected and documented some of the important Payment for Ecosystem Services
(PES) data that will support the facilitation of future R2R investments and practical interventions into the area.
This would safeguard the Mataniko catchment ecosystem goods and services from further depletion and
provide quick remedies or mitigation for ecosystem recovery.
13REFERENCES
Hopkin S. 2018. Ecosystem-based adaptation options assessment and masterplan for Honiara, Solomon Islands. Apia,
Samoa: SPREP, 65 p
Warren R,K., Schwar M A.,Boyle N, L., Albert J., Agolo S, S., Warren R., Bana A., Paul C., Kodosiko R., Bosma W., Yee
D., Ronnback, P., Crona B., and Duke N. 2011. Mangrove ecosystem series and the potential for carbon revenue
programmes in Solomon Islands. Environmental Conservation. 38 (4): 485 – 496 DOI:
https://doi.org/10.1017/S0376892911000373
14Ecosystem Goods and Services Valuation Report
Mataniko Watershed Catchment
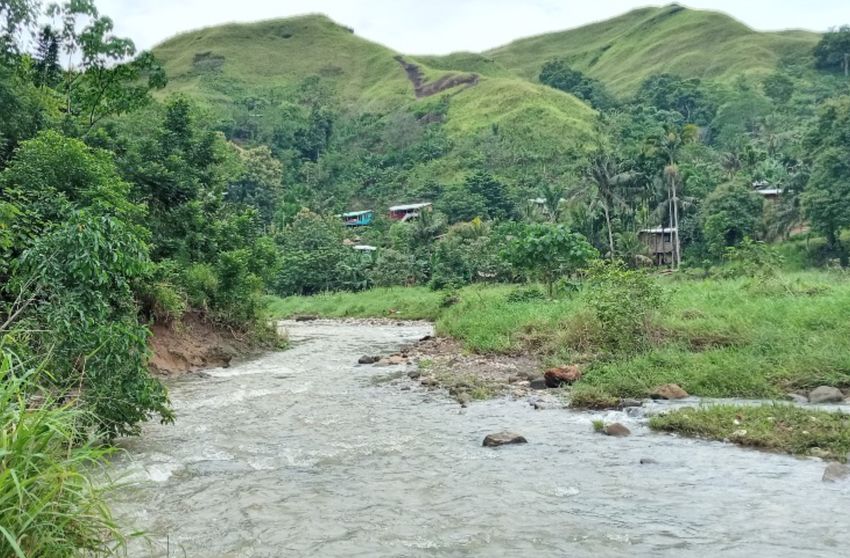
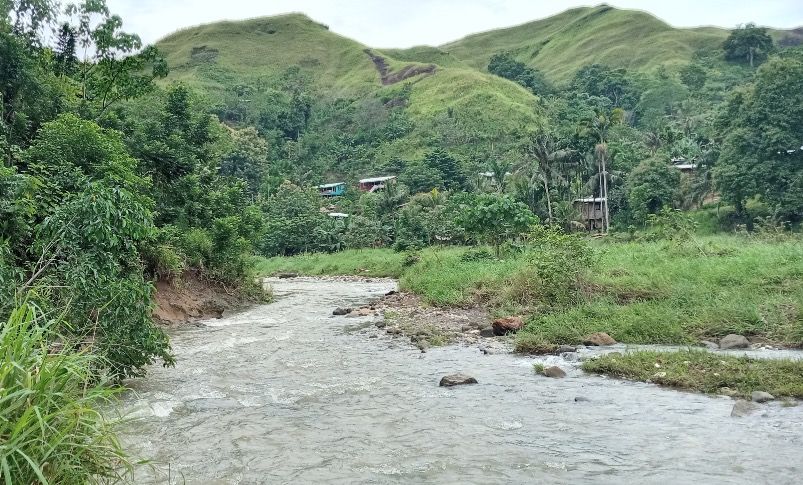
ANNEX A: PHOTOGRAPHS OF THE SURVEY
Community Reps of Renlau and Fijian Quarter Community
15ANNEX B: SURVEY MATRIX 16
Ecosystem Goods and Services Valuation Report
                                                                                          Mataniko Watershed Catchment

ANNEX C
Sex disaggregated data of the households surveyed in selected communities, generally showing similar number
of males and females across average households. The results suggest the level of dependency on the Mataniko
catchment ecosystem goods and services to meet subsistence needs, not only by communities residing by the
river but the whole population of Honiara and in areas close by the river.

Table 9. Renlau Community

    Household Number               No. of Males             No. of Females                        Total

             1.                         4                         7                                 11

             2.                         5                         3                                  8

             3.                         7                         2                                  9

             4.                         5                         3                                  8

             5.                         4                         5                                  9

             6.                         7                         12                                19

            Total                      32                         32                                64

Table 10. Ridge Community

    Household Number               No. of Males             No. of Females                        Total

             1.                         4                         6                                 10

             2.                         3                         5                                  8

             3.                         4                         7                                 11

             4.                         3                         4                                  7

             5.                         2                         2                                  4

            Total                      16                         24                                40

Table 11. Koa Hill Community

    Household Number               No. of Males             No. of Females                        Total

             1.                         9                         12                                21

             2.                         3                         5                                  8

             3.                         3                         4                                  7

             4.                         3                         3                                  6

             5.                         4                         7                                 11

             6.                         4                         5                                  9

            Total                      26                         36                                62

                                                                                                                             17
Table 12. Tuvaruhu Community
Household Number No. of Males No. of Females Total
1. 6 5 11
2. 5 7 12
3. 5 5 10
4. 5 7 12
5. 4 5 9
6. 3 5 8
7. 5 8 13
Total 33 42 75
Table 13. Lelei Community
Household Number No. of Males No. of Females Total
1. 4 5 9
2. 3 4 7
3. 3 2 5
4. 4 5 9
5. 2 3 5
Total 16 19 35
Table 14. Musona Community
Household Number No. of Males No. of Females Total
1. 4 5 9
2. 5 3 8
3. 4 3 7
4. 5 3 8
5. 3 3 6
6. 2 3 5
Total 23 20 43
18Ecosystem Goods and Services Valuation Report
Mataniko Watershed Catchment
Table 15. Vara Creek Community
Household Number No. of Males No. of Females Total
1. 3 5 8
2. 4 3 7
3. 3 3 6
4. 4 5 9
5. 6 8 14
6. 4 6 10
Total 24 30 54
Table 16. Number 3 Community
Household Number No. of Males No. of Females Total
1. 5 7 12
2. 4 3 7
3. 11 15 26
4. 9 15 24
5. 4 5 9
Total 33 45 78
Table 17. Fijian Quarter Community
Household Number No. of Males No. of Females Total
1. 7 7 14
2. 3 11 14
3. 3 6 9
4. 15 20 35
5. 9 10 19
Total 37 54 91
19Table 18. Cana Hill Community
Household Number No. of Males No. of Females Total
1. 4 7 11
2. 3 4 7
3. 3 4 7
4. 3 4 7
5. 3 5 8
6. 4 5 9
7. 4 6 10
Total 24 35 59
20Mainstreaming a Ridge to Reef Approach for Sustainable Development in the Pacifi
A Practitioners’ Guide
22You can also read