Effects of Regulation Intensity on Marijuana Black Market After Legalization
←
→
Page content transcription
If your browser does not render page correctly, please read the page content below
Portland State University
PDXScholar

Dissertations and Theses                                                               Dissertations and Theses

Spring 7-10-2019

Effects of Regulation Intensity on Marijuana Black
Market After Legalization
Sikang Song
Portland State University

Follow this and additional works at: https://pdxscholar.library.pdx.edu/open_access_etds

    Part of the Criminology Commons
Let us know how access to this document benefits you.

Recommended Citation
Song, Sikang, "Effects of Regulation Intensity on Marijuana Black Market After Legalization" (2019).
Dissertations and Theses. Paper 5043.
https://doi.org/10.15760/etd.6919

This Thesis is brought to you for free and open access. It has been accepted for inclusion in Dissertations and
Theses by an authorized administrator of PDXScholar. Please contact us if we can make this document more
accessible: pdxscholar@pdx.edu.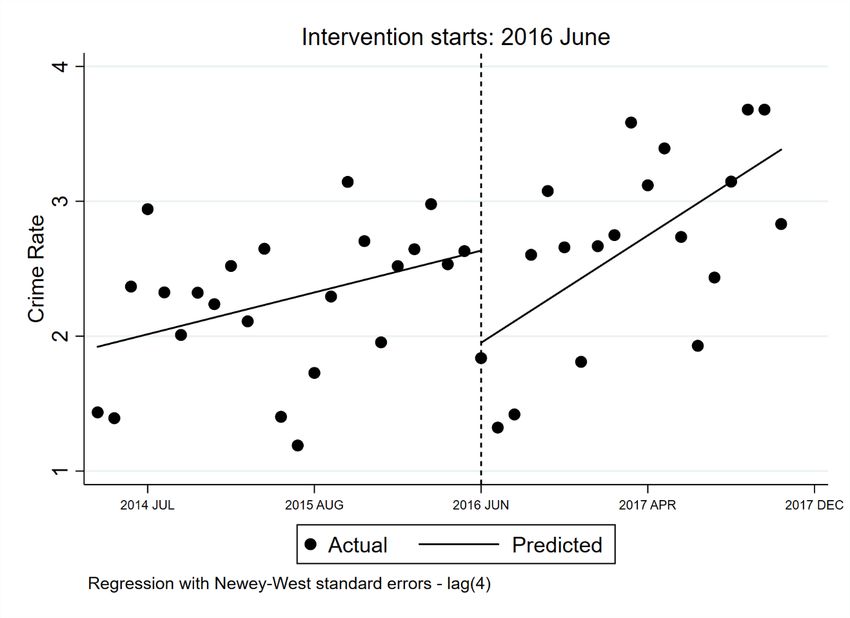
Effects of Regulation Intensity on Marijuana Black Market After Legalization

                                     by

                                Sikang Song

               A thesis submitted in partial fulfillment of the
                       requirements for the degree of

                            Master of Science
                                   in
                     Criminology and Criminal Justice

                            Thesis Committee:
                           Mark Leymon, Chair
                           Danielle McGurrin
                             Aaron Roussell

                         Portland State University
                                   2019
© 2019 Sikang Song
i

                                          Abstract

     Since 2012, many states and Canada have legalized the use and sale of recreational

marijuana. One of the expected benefits of the legalization is that the establishment of a

legal cannabis market would eliminate the black market which has been the main form of

marijuana trade for decades. Even though legal options are available for marijuana

producers and consumers, the black market is still thriving in states where recreational

marijuana has been legalized. The reasons behind the persistence of the marijuana black

market are complex. One of the main arguments is that the legalized states have failed to

establish a regulatory framework which effectively keeps both producers and consumers

in the legal market. Instead, strict regulations and high cost of compliance have created an

environment in favor of big players while driving small-scale businesses into the black

market. The current research attempts to study this issue by answering the research

question of whether overregulation is pushing some marijuana businesses back to the black

market or preventing them from entering the legal market.

    This thesis employs a mix-method design to analyze qualitative data of news articles

reporting the reasons that marijuana businesses decide to stay in the black market and a

quasi-experimental time series analysis of National Incident-Based Reporting System

(NIBRS) data regarding marijuana offenses in Colorado and Washington between 2014

and 2017. The qualitative analysis of news reports reveals that regulation is one of the main

reasons that people stay in the illicit market. The comparison of marijuana crime trends in

Colorado and Washington shows mixed findings. While marijuana offense rates in

Colorado largely remained steady over the years, those in Washington increased
ii dramatically after the implementation of more intensive regulations. The results of this study have several policy implications for the marijuana legalization as well as implications for future research on the black-market issue.
iii

                                    Acknowledgments

     I would like to express my appreciation to the chair of my thesis committee, Dr. Mark

Leymon, for his support of my study and research in the past two years. His assistance and

knowledge not only guided the writing of this thesis, but also accompanied me on my

graduate career at Portland State University. I also would like to express immense gratitude

to the members of my thesis committee, Dr. Aaron Roussell and Dr. Danielle McGurrin,

whose expertise and dedication to the fields of drug policy, law and society, and criminal

justice studies inspired me greatly. Without their guidance and persistent help, this thesis

would not have been possible.

     I am also very grateful to the faculty and staff in the Department of Criminology and

Criminal Justice at Portland State University. Their advice and assistance have helped me

to navigate this graduate program. Particularly, for professors who taught the graduate

courses and those who I worked with as a teaching assistant, I thank them for providing

me with academically rigorous coursework and giving me the opportunity to further my

learning through teaching. Both the learning and teaching experiences have been

invaluable in developing my skills as a criminal justice professional. I will continue to

practice the knowledge and skills I learned in my future career.
iv
Table of Contents
Abstract ................................................................................................................................ i
Acknowledgments.............................................................................................................. iii
Table of Contents ............................................................................................................... iv
List of Tables ...................................................................................................................... v
List of Figures .................................................................................................................... vi
Introduction ......................................................................................................................... 1
Literature Review................................................................................................................ 5
From Prohibition to Legalization .................................................................................... 5
Regulations and Black Market ........................................................................................ 9
Regulation Intensity and Black Market ......................................................................... 12
Method .............................................................................................................................. 18
Content Analysis of News Articles ............................................................................... 18
Sampling .................................................................................................................... 19
Analytic Plan ............................................................................................................. 22
Interrupted Time Series Quasi-Experiment................................................................... 23
Data and Measurement .............................................................................................. 26
Analytic Plan ............................................................................................................. 28
Results ............................................................................................................................... 30
Content Analysis of News Articles ............................................................................... 31
Interrupted Time Series Quasi-Experiment................................................................... 41
Discussion and Policy Implications .................................................................................. 45
Limitations ........................................................................................................................ 50
Future Research ................................................................................................................ 53
Conclusion ........................................................................................................................ 55
References ......................................................................................................................... 57
Appendix A – Interrupted Time Series Modeling ACTEST Results ............................... 64v
List of Tables
Table 1. Annual Marijuana Crimes in Colorado and Washington State…….….………..30
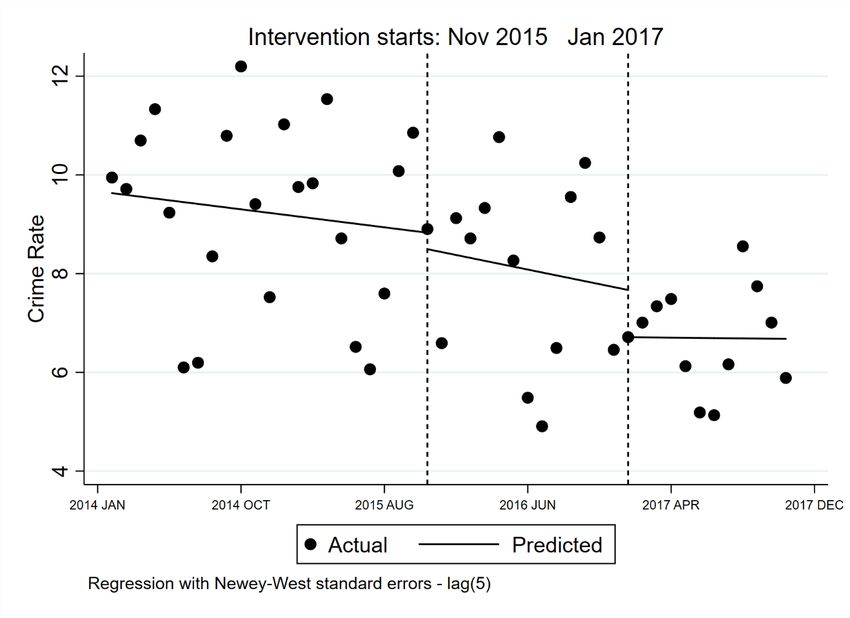
Table 2. ITSA Results on Monthly Marijuana Crime Rates in Colorado…………….….41
Table 3. ITSA Results on Monthly Marijuana Crime Rates in Washington…………….43
Table 4. Colorado ITSA Modeling ACTEST Results …………………………………..64
Table 5. Washington State ITSA Modeling ACTEST Results ...………………………..64vi
List of Figures
Figure 1. Distribution of News Articles by Year of Publication…………….….……….22
Figure 2. Marijuana Crime Rates in Colorado…………….……..………………………42
Figure 3. Marijuana Crime Rates in Washington…………….……….…………………441
Introduction
Marijuana has been a prohibited substance in the United States since the federal
government passed Marihuana Tax Act of 1937 (Newton, 2013). For decades, it remained
a contraband under both federal regulations and the statutes of all 50 states until 1996 when
voters in California started to permit cannabis use for qualified patients with certain
medical conditions (California Proposition 215, 1996). In recent years, the national trend
is changing from prohibition to regulating a legal marijuana market. In 2012, Colorado and
Washington State first reformed their drug laws to permit the legal recreational use of
marijuana. As of 2019, while medical marijuana is legal in 28 states and District of
Columbia, 10 states and District of Columbia have legalized the use of marijuana for
recreational purposes. Although it is still illegal on the federal level, these 10 states allow
adult citizens over the age of 21 to possess small amount of cannabis and permit licensed
businesses to grow, process, and sell marijuana products within their state boundaries
(Berke & Gould, 2019).
In the last several years, a massive legal marijuana industry has been created in
states where recreational marijuana has been legalized. For example, the most recent
numbers show that Washington State has issued 1947 licenses to businesses that deal with
marijuana growing, processing, retailing, or transportation. (Washington State Liquor and
Cannabis Board, 2019). As of October 2018, there were 548 licensed marijuana retail stores
and 287 retail product manufactures in Colorado (Colorado Department of Revenue, 2018).
By April 2019, the State of Oregon has issued a total of 4326 licenses to marijuana
businesses and research institutions (Oregon Liquor Control Commission, 2019). Although2
the legalization only has been in effect for over a year, California has already issued over
10,000 commercial cannabis licenses (California Cannabis Portal, 2019). There is no
question that the marijuana industry is growing quickly in the states where recreational
marijuana is legal.
However, while the legal marijuana industry is thriving, the black market persists
on a large scale in these states. Government reports and news stories show that unlicensed
marijuana transactions account for a large portion of the marijuana business. A Cable News
Network (CNN) report claimed that in late 2014, two years after the legalization, about 40%
of cannabis transactions in Colorado were made through illegal channels (Lobosco, 2014).
It also indicated that the primary cause of the black market is the high taxation on legal
cannabis and the high price difference between legal and illegal cannabis products. Another
news report revealed a similar situation in the Seattle area of Washington in 2016, four
years after the legalization. It documented that many marijuana consumers preferred to
purchase cannabis products from the black market because relatively cheaper prices and
easy accessibility (Coughlin-Bogue, 2016). At the same time, Oregon’s post-legalization
cannabis market also included large scale illegal production and sales. In 2016, Oregon law
enforcement agencies destroyed over 26,500 plants grown illegally on public lands across
Oregon (Oregon-Idaho High Intensity Drug Trafficking Area, 2018). Since legalization at
the beginning of 2018, the first quarter revenue from cannabis taxes in California was only
one-fifth of the revenue the state projected. People in the legal marijuana business believed
that the slow growth of the industry was due to the well-entrenched black market (Stagges,
2018). State-level authorities are well-aware of the situation. According to Washington
State Liquor and Cannabis Board’s (2018) press releases, Washington State marijuana3
enforcement officers have seized multiple illegally grown or produced marijuana products
in the past several years.
Advocates of marijuana legalization have been arguing that a regulated marijuana
market can benefit the public by eliminating the illicit trade of marijuana and generating
substantial tax revenue (Cohen & McGowan, 2012; Caputo & Ostrom, 1994; Gettman &
Kennedy, 2014). However, several years after the legalization, the regulated marijuana
business is yet to take over the black market in the states where marijuana is fully legalized.
Certainly, some illicit marijuana production in these states is for markets in states where
recreational marijuana is still illegal or even for oversea markets. But a considerable
portion of the black market serves local consumers (Kaste, 2018; Stewart, 2018).
The reasons behind the persistence of the black market are complex and cover the
entire marijuana business from production and distribution to consumption. Looking at this
issue from the end of consumption, one possible explanation is that the high taxation on
marijuana products provides opportunities for illicit production and trade because the price
of marijuana on the black market is much lower than those on the legal market. Moreover,
similar to the situation in alcohol and tobacco markets, underage teenage and young adult
consumers also create demand for illicit cannabis as they are unable to purchase marijuana
products through legal means. From the end of production and distribution, the intensive
regulation intimidates aspiring marijuana businessowners because it is too demanding for
them to abide the law. A variety of taxes and fees associated with regulation worsens the
situation by imposing heavy financial burdens on legal marijuana businesses. Thus, they
retreat to illegal trades to dodge the regulations.4
In this thesis, I explore whether certain aspects of recreational cannabis legislations
and regulations push some marijuana growers and retailers back to the black market or
prevent them from entering the legal market. Using arrest data of marijuana offenses from
Colorado and Washington State and news reports on marijuana black market in legalized
states and Canada, this thesis investigates if the intensity of marijuana regulation can
explain the persistence of marijuana black market after the legalization. Ultimately, this
exploratory research aims to provide preliminary empirical explanations for the persistence
of the marijuana black market after legalization and indicate directions for future studies
on this complex issue.5
Literature Review
From Prohibition to Legalization
While the exact time when marijuana was first used medically and recreationally is
unknown, hemp has been used industrially in the United States since the 1600s as a
common commodity. It was not until the prohibition era during the early twentieth century,
federal and state governments first began to regulate the production, sale, and consumption
of cannabis (Houser & Rosacker, 2014). A black market of marijuana emerged as a result
of the prohibition. To study the current situation of the marijuana black market, we must
first examine its prohibition and regulation, namely the evolution of the laws that
prohibited or regulate marijuana use and trade.
In the early twentieth century, there was a movement in the United States to label
drugs as a dangerous narcotic which eventually led to a nationwide constitutional ban on
alcoholic beverages from 1920 to 1933. Although marijuana was not specifically included
in the prohibition, that movement reflected a more general cultural trend toward the
prohibition of any type of mind-altering substance. In 1913, influenced by concerns over
the use of narcotic drugs by the state’s Chinese residents, California became the first state
to prohibit the use of marijuana (Houser & Rosacker, 2014). On the federal level, the
Uniform Narcotics Drug Act of 1932 first included cannabis as one of the substances it
intended to regulate. Shortly after, federal government adopted the Marihuana Tax Act of
1937, specifically addressing the issue of marijuana by imposing a complex system of
taxation and regulation. Even though the production, sale, and consumption of cannabis6
were not outlawed, people were arrested and sentenced for possession and selling
marijuana on the name of violating this law (Newton, 2013).
After World War II, legislation on marijuana continued to intensify as a response to
an apparent increase in drug use among young people during that period. The Boggs Act
of 1951 dramatically increased penalties for drug possession and use. In this Act, marijuana,
cocaine, and opiates had been included together in a single piece of federal legislation for
the first time. More importantly, this legislation set up a model of drug laws that many
states followed right after. Some of the state laws carried even stricter rules and severe
penalties than those in the federal bill. In 1956, Congress passed the Narcotics Control Act.
The key provisions of this act included even more severe penalties for the sale of and
trafficking in illegal substances. As a result, marijuana prohibition was universal across the
United States through the 1960s. Those who were found guilty of producing, possessing,
or selling marijuana received sentences of incarceration (Newton, 2013).
Between 1937 and 1969, the Marihuana Tax Act of 1937, the 1951 Boggs Act, the
Narcotics Control Act of 1956, and a cluster of state and local laws established the
prohibition of marijuana. However, the U.S. Supreme Court’s ruling on Leary v. United
States in 1969 made the Marihuana Tax Act of 1937 and subsequent legislations
unconstitutional on the ground of exposing an individual to self-incrimination (Newton,
2013). Consequently, the nation experienced a brief period of liberalization with the
absence of federal policy regarding the use of marijuana. In the 1970s, 12 states removed
or substantially reduced criminal penalties for possession of small amounts of marijuana.
At the time, many observers believed that marijuana would soon be legalized (Houser &
Rosacker, 2014).7
However, Congress quickly began working on a new drug policy legislation. In 1970,
it introduced the Comprehensive Drug Abuse Prevention and Control Act. This act
comprehensively covered every aspect of drug production, distribution, registration, and
consumption. Especially, Title II of the act, the Controlled Substances Act of 1970,
provided the basic legislative framework for U.S. drug policy that is still in use up to today.
One of the significant changes the act made on the nation’s drug policy was replacing
taxation as a primary mechanism of drug control with direct penalties and punishment
(Newton, 2013). This feature of the act provided basis for the “war on drugs” which was
introduced by President Richard M. Nixon in the 1970s and implemented nationwide
during the Regan administration in the 1980s. Influenced by the new drug legislation and
policy, among states where the possession of small amounts of marijuana was
decriminalized, South Dakota eventually reversed its decriminalization a few years later,
and no state initiated decriminalization in the subsequent twenty years (Houser & Rosacker,
2014).
In the late 1990s and 2000s, although the federal government had not changed its
legislation and attitude towards cannabis, the prohibition of marijuana started to loosen on
the state level. More states fully decriminalized possessing small amounts of marijuana. In
addition, more than 20 states passed laws to allow marijuana to be used for medicinal
purposes. While in many states, the medical-marijuana system is serving more as an
adjunct to the health system than as a loophole for recreational users, a few states, such as
California and Colorado, have expansive definitions of what conditions can justify
obtaining a medical recommendation. Nevertheless, these developments show that the8
United States had entered a new age of liberalization of marijuana policies that eventually
led to the legalization of recreational marijuana in many states during the 2010s.
In 2010, a California ballot initiative that attempted to legalize recreational marijuana
received 46.5 percent of the vote. Shortly after, in 2011, public opinion polls showed that
over 50 percent of the population nationally favored legalizing marijuana use for
recreational purposes (Swift, 2013; Hughes, 2014). Encouraged by these results, in 2012,
through the passage of ballot Amendment 64 and Initiative 502 respectively, Colorado and
Washington voters authorized commercial cannabis production and retail sale of
recreational marijuana (Amendment 64 of Colorado, 2012; Ferner, 2012; Initiative 502 of
Washington, 2012; Martin, 2012). Adults over 21 in Colorado and Washington are
permitted to purchase or possess a limited amount of marijuana for personal use. While
Washington does not allow home growth for recreational purposes, Colorado allows a
household to grow, process, and transport up to six marijuana plants. (Amendment 64 of
Colorado, 2012; Initiative 502 of Washington, 2012).
Following Colorado and Washington’s footsteps, many other states also passed
legislation to legalize cannabis for recreational use. Alaska, Oregon, and the District of
Colombia passed Measure 2, Measure 91, and Initiative 71 respectively in 2014 (WTSP,
2017). In 2016, voters in Nevada, Massachusetts, California, and Maine also passed ballot
initiatives to legalize recreational marijuana (WTSP, 2017). Michigan did the same in 2018
(Angell, 2018). In the same year, Vermont became the first state to legalize recreational
cannabis by the way of state legislature as the senate passed a bill that eliminates the
penalties for possessing limited amounts of marijuana by adults over 21 years old
(Montpelier, 2018).9
In addition to limited personal use and home growth of cannabis, the new
legislation also permits licensed business to cultivate, manufacture, and sell marijuana
under state regulations. The production and retail of recreational marijuana soon began
after the legislations took effect. On July 8, 2014, the first recreational cannabis dispensary
was opened in Washington (Johnson, 2014). Oregon Liquor Control Commission issued
the first license to a recreational marijuana producer in April 2016 and the first retail license
in October (Crombie, 2014). Legal sales also began in Nevada and Massachusetts in 2017
and 2018 (Lochhead, 2017; Bartlett, 2018). State-sanctioned marijuana businesses,
including cannabis growing, processing, transportation, and retail launched in California
at the beginning of 2018 (Staggs, 2017). As of 2018, a legal marijuana market had been
created in many states across the United States. Individuals living in these states who are
21 and older can purchase cannabis legally at licensed stores and apply for licenses to
produce, process, transport, and sell recreational marijuana.
At the same time, the legalization of marijuana also has become a global trend.
While many countries across the world are legalizing medical marijuana and
decriminalizing recreational use, on October 17, 2018, Canada became the second country
in the world to fully legalize marijuana following Uruguay (Bilefsky, 2018). This change
made Canada the single largest legal marijuana market in the world.
Regulations and Black Market
The definition of marijuana black market changed overtime with the evolvement of
drug laws. In general, it refers to illicit production, trade, and use of cannabis in violation10
of the laws and official regulations. Until the legalization of recreational marijuana in
recent years, any activity related to cannabis production, sale, and consumption had to
operate in the black market except those for medical purposes sanctioned by state laws.
The legalization has significantly reduced the scope of cannabis black market as many
types of activities regrading marijuana have been included in the legal framework. It also
marks a line between the legal and illegal markets with the law and regulation. At the same
time, however, it also complicates the composition of the marijuana black market as illegal
activities must be differentiated from the legal ones, even though they are conducted in the
same manner. In practice, the boundary between legal and illegal transactions could
become ambiguous for some people depending on their knowledge or willingness to
comply with the laws and regulations. Current study focuses on a loosely defined black
market that consist of all the cannabis production and distribution that violate existing
marijuana laws and regulations.
One of the main goals of marijuana legalization is to eliminate the black market by
introducing a well-regulated legal market. However, evidence clearly shows that the black
market in states where recreational marijuana is legal has not yet diminished entirely as
expected. The reason may lay in the regulations themselves. In legalized states, the legal
marijuana industry is under tight regulations. A common key provision of the ballots
legalizing recreational marijuana is to establish a system, overseen by state government, to
set out regulations and taxation for marijuana retail businesses. For example, California’s
Proposition 64 asks the state government to establish standards and restrictions for
packaging, labeling, advertising, and marking marijuana products (California Proposition
64, 2016). Although state-level regulations for legal marijuana producers and retailers vary11
in detail, they usually focus on several main categories including licensing, production and
distribution limits, packaging and labeling regulations, the installation of tracking and
security systems, advertising, and taxation. Each marijuana business establishment must
meet certain requirements in order to acquire a license from the regulatory agency. More
importantly, these regulations are very detailed and oftentimes strict. For instance, in
Washington State, marijuana production must take place (1) within a fully enclosed secure
indoor facility or greenhouse with rigid walls, a roof, and doors; or (2) outdoors in nonrigid
greenhouses, other structures, or an expanse of open or cleared ground fully enclosed by a
physical barrier at least eight feet tall (Washington State Liquor and Cannabis Board, 2018).
Moreover, these regulations sometimes impose heavy financial responsibilities to
legal marijuana businesses and their products, including license fees, testing fees, insurance,
and taxation. To open a new retail marijuana store in Alaska, the business owner needs to
pay a $1,000 application fee and a $5,000 annual license fee (Alaska Department of
Commerce, Community, and Economic Development, 2018). The so-call “sin tax” on
marijuana is usually heavy. Colorado has 15% excise tax from marijuana cultivation to
processing or retail while this kind of tax is 25% in Washington State at each stage of sales
(from producer to processor to retailer to customer) (Colorado Department of Revenue,
2018; Washington State Liquor and Cannabis Board, 2018). In practice, the overall tax rate
on cannabis products is much higher. In California, for example, it could be as high as 45%,
including a 15% state excise tax, state cultivation taxes of $9.25 per ounce for cannabis
flower and $2.75 per ounce for leaves, as well as state and local sales taxes currently
ranging from 7.75% to 9.75% (The Bond Buyer, 2017).12
These intensive and strict regulations and taxations reflect legislators’ caution on
opening the legal cannabis market and their intention to closely regulate the production and
use of marijuana. But it also may be one of the main reasons behind the persistence of the
black market in states where recreational marijuana has been legalized. For instance, some
observers have already begun to argue that heavy financial and tax burdens on marijuana
businesses may “complicate such [increased enforcement] efforts by diverting in-state
sales to the black market” (The Bond Buyer, 2017). Some academic studies also raise
similar arguments. Caulkins et al. (2014) indicate that price is a major factor contributing
to black market activities encouraged by excessively high taxation, expensive regulatory
compliance, variation between medical and recreational costs, and the lack of ability to
deduct legitimate business expenses. In discussing possible issues associated with
legalization, Caulkins (2014) points out that the current marijuana legislation favors large
for-profit companies and warns us about the dangers of corporate takeover of the legal
marijuana market. This trend would only prevent legal cannabis to replace the black market.
Regulation Intensity and Black Market
Although there have not been many studies focusing on the correlation between the
intensity of marijuana regulations and the black market, some research provides valuable
insights for the study of this subject. A case study of the local recreational cannabis supply
chain in Eastern Washington, including a producer/processor, an analytic facility, and retail
establishments, shows that state regulations mainly emphasize preventing diversions to the
black market (Jensen & Roussell, 2016). For example, licensed cannabis growers are13
prohibited from reserving even a tiny portion of their retail production for personal use.
Jensen and Roussell (2016) also suggest that safety-oriented regulations, on the other hand,
were shifted from the state to independent laboratories. This finding is consistent with
Room (2011)’s prediction that the responsibility of controlling the safety of substances is
being placed on self-regulated individuals while state’s control is loosened to promote
profit. Both literatures suggest that state regulations on recreational marijuana should leave
room for retail marijuana establishments to gain profit and the main regulatory focus should
be preventing the diversion of marijuana to the black market (Jensen & Rousell, 2016;
Room, 2011).
Gettman and Kennedy (2014) identify the practice in the forgoing states as the
“interventionist model,” meaning marijuana trade is permitted yet access to the market is
limited by government licensing. The characteristics of an interventionist model include
limited market access through licensing, high levels of tax revenue, high prices, and low
levels of competitions among merchants (Gettman & Kennedy, 2014). While recognizing
the interventionist model is better than prohibition, the authors criticize that the controlled
model would not eliminate the illegal marijuana trade. They argue that the failure of
compulsory prohibition of marijuana indicates successful marijuana regulations must be
able to incentive voluntary compliance. However, the interventionist model would not be
able to incentive voluntary compliance because pre-legalization and small-scale marijuana
producers are still shunned from the legal market. The small-scale producers would
continue to produce illegally and consequently undermine the regulated marijuana market
in the same way as they undermine marijuana prohibition. Meanwhile, those who can
obtain licenses will make legal marijuana expensive due to the lack of competition among14
legal producers and prices adjusted to reflect the high taxation. Therefore, Getteman and
Kennedy (2014) argue that the high prices and lack of access will result in continuation of
illicit small-scale production. The alternative recommended by Gettman and Kennedy
(2014) is an open-competitive market which provides producers unrestricted access to the
market with only some perfunctory regulatory requirements. In this way, many small-scale
producers will be willing to join the legal market. The competition among legal marijuana
businesses will substantially lower marijuana prices and incentivize voluntary compliance
to market regulations.
Prior economic literatures also identify increasing regulation as one of the main
causes of black-market economy (Johnson, Kaufmann, & Zoido-Lobatón, 1998; Schneider
& Enste, 2000; Schneider, 2005). When comparing the magnitude of unofficial economies,
Johnson et al. (1998) find countries that have fewer regulations and provide a more
business-friendly environment have lower shares of unofficial economy in their countries.
They find that for every one-point increase of the regulation index (ranging from 1 to 5,
indicating a country with most regulation), there is an 8.1 percent increase in the share of
black-market economy in the country’s total gross domestic product (GDP). Schneider’s
(2005) study on the size of black-market economy in developing, transition countries such
as Eastern Europe and Soviet Union and western countries also find consistent evidence
that regulation intensity is one of the major factors that explain the size and growth of the
black-market economy.
As cannabis and other controlled substances are either illegal or recently regulated,
there is no direct empirical evidence on the effects of restricted licensing policies on
marijuana market and what factors can explain the persistence of illicit cannabis market15
after the legalization. Yet, a comparison among cannabis policies in Colorado, Washington,
and Uruguay expresses the concern the strict policies adopted by Uruguay, such as
regulating the amount of cannabis a person can access per year and maintaining personal
information on a government registry, may encourage people to continue to seek cannabis
in the criminal market (Pardo, 2014). It argues that, although the restrictive policies
adopted by Uruguay may suppress the negative health consequences of marijuana
legalization, they also limit the new policy’s capacity of eliminating the illicit cannabis
market.
Research on tobacco regulation can also shed light on the prevalence and situations
of illicit transactions of substances that are legal yet subject to strict public health scrutiny.
On the one hand, an examination of cigarette sales pre- and post- the anti-smoking policies
in Turkey shows that increasing taxation and implementing harsher cigarette smoking
regulations reduced the sales of cigarettes (Cetin, 2017). After implementing a higher
cigarette taxation and more intensive public health regulations in 2004, cigarette sales
drastically declined for a decade in Turkey (Cetin, 2017). Yet, as recognized by Cetin
(2017), the decline of cigarette sales and the decline of people’s demand for tobacco
products are two different concepts. One would not be able to show the whole-picture of
tobacco consumption without accounting for smuggling data or the number of people
substituting cigarette with “self-rolled” tobacco products. On the other hand, another study
on the topic argues that the decline of cigarette sale may also indicate a flourishing black
market (Gabler & Katz, 2010). This report on the effects of anti-smoking initiatives in
Canada show that, although the number of cigarette cartons sold per capita had been
decreasing after the anti-smoking lobby in 2001, the increased taxation has stimulated the16
growth of contraband cigarette trade, which now constitutes about 27% of the overall
tobacco market in Canada. Imposing higher taxes on tobacco directly led to the emergence
of a black market for contraband cigarettes. (Gabler & Katz, 2010).
In conclusion, previous literature suggests the intensive marijuana controlling
policies such as high taxation and strict licensing requirements may explain why marijuana
black market is still prevalent when there are legitimate channels to produce and trade
cannabis. However, no study to date has specifically investigated this explanation. While
recognizing the necessities of supervising, regulating, or even restricting growing,
processing, and sales of marijuana to protect tax revenue, public health, and other social
interests, legislators also need to be on the alert of the potential unintended consequences
of restrictive marijuana-control policies—a prevalent and persistent black market. As
replacing illicit cannabis transactions with regulated ones is one of the main goals of
marijuana law reform, policy-makers need to be more cautious with “where to draw the
line.”
This thesis attempts to fill the gap in the literature by examining the relationship
between the intensity of recreational marijuana regulations and the extent of illegal
marijuana growing and trade. It reveals how Colorado and Washington State control
marijuana establishments, the monetary and procedural costs for operating a legitim ate
marijuana business, and the scope of illegal cannabis activities since the legalization. It
also explores how regulation intensity impacts individual business’s decision of staying in
the black market for marijuana when there are legal options available. The findings of this
thesis would present to policy-makers new evidence and conclusions on the unexpected
consequences of implementing strict marijuana policies. Policy implications regarding how17 to adjust current regulations and eliminate the black market as well as implications for future research are also provided.
18

                                          Method

       This thesis employs a mixed-method design to evaluate the impact of regulation

intensity on marijuana black market both qualitatively and quantitatively. Specifically, I

conducted a content analysis of news articles exploring why the marijuana black market

still exists in states and Canada that have legalized recreational marijuana growing and

retail and an interrupted time-series quasi-experiment to examine the changes of marijuana

crime rates over time in Colorado and Washington State since the legalization. Adopting

this congruent mixed method gives this research two methodological strengths. First, a

qualitative inquiry reveals the main factors that drive marijuana growers and sellers to

choose the black market rather than making their businesses legal. It generates contextual

explanations for the relationship between regulation intensity and illicit marijuana

activities. Second, conducting the quasi-experimental time series analysis enables me to

triangulate two sets of results to examine whether the findings from data analysis support

those from the content analysis of news articles.

Content Analysis of News Articles

     The methodology of content analysis has been commonly used to study phenomenon

in media articles (Hesse-Biber & Leavy, 2011; Kirppendorff, 2013). Although this method

includes a quantitative approach of counting the numbers of occurrences of the events

under study, it is essentially a qualitative strategy for identifying themes embedded in the

sources that reflect a phenomenon (Mayring, 2000). A certain pattern that is common and

thematic in a group of articles may imply something about the frequency, typicality, or
19
even intensity of a finding (Sandelowsk, 2001). Specifically, content analysis attempts to
summarize common characteristics of the textual content of a number of documents by
examining who says what, to whom, and with what effect (Bloor & Wood, 2006). Applying
this methodology to this thesis, I examined the interviews with people involved in
marijuana black market that have been documented in news reports. In doing so, I
attempted to find the reasons behind their decisions to remain in the black market or not
take the legal path by identifying common themes from their explanations. While the
analysis was qualitative in nature, I referred to the number of articles and the number of
relevant interview passages in which a particular reason was mentioned (n = X) as a way
to contextualize the narratives.
Sampling
The sample consisted of 126 textual news articles published by US and Canadian
media between late 2013, roughly the time when Colorado became the first state to sell
legal recreational marijuana, and April 2019. The majority of articles were retrieved from
several comprehensive full-text newspaper databases including InfoTrac, Newsstand,
Newspaper Source, Nexis Uni, New York Times, and Wall Street Journal. In addition, a
search on Google News yielded articles from a variety of digital media such as online
magazines, media outlet web pages, online editions of newspapers, and blogs. The sample
not only consists of news stories, but also includes other common types of news article
such as columns, opinions, editorials, and blogs. Blog content was included only from those
affiliated with credible sources, typically mainstream media outlets. For articles published20
multiple times in difference sources, only the versions from the original sources were
included. All database retrieval and sample selection were conducted by the author.
Articles were selected based on the occurrence of keywords appearing in their
headlines or texts. Keywords included “marijuana black market”, “marijuana illicit
market”, “cannabis black market”, “cannabis illicit market”, “marijuana legalization”, and
“marijuana law reforms”. The sample included articles focused on the black-market
situation in legalized states. Those discussing the black-market issue in Canada were also
included for several reasons. First, the legalization of marijuana in Canada has drawn much
attention from the media and drug policy observers. There has been a substantial amount
of news articles focusing on the issues and effects of Canada’s legalization, including the
subject of black-market persistence. Second, Canada has similar cultural, social, economic,
and legal systems to the United States. Therefore, their experience has referential
significance for the study of marijuana legalization in US. While all retrieved articles
referenced marijuana black market, the sample includes only articles in which it was a main
focus such that the term of “marijuana black market” or similar terms appear in the headline
and/or the issue is discussed in the lead paragraph or an entire section of the article text.
Articles addressing the marijuana black market but fell into the following categories were
excluded: those discussing the marijuana black market prior to the legalization in 2012;
those discussing the marijuana black market in states or countries where recreational
marijuana is still illegal; those discussing illicit activities on the medical marijuana market;
those covering particular events of local law enforcement cracking down illegal marijuana
operations. Most importantly, in order to be included in the sample, an article must contain
interviews or direct quotes from persons participating or closely observing the marijuana21
black market, such as illegal growers, sellers, or consumers as well as law enforcement
officers and policy observers.
The sampled articles were selected from more than 60 unique media outlets
throughout the United States and Canada, most of which yielded fewer than five articles.
About 91% of the 126 sampled articles consisted of news stories (n = 110), while the rest
(n = 16) are other types of media text such as column, editorial, and blogs. Regional
distribution is led by articles from regional media outlets (46%, n = 58), of which those
from outlets in legalized states, such as Colorado (n = 9), Oregon (n = 10), and California
(n = 13), are well represented. National media outlets contribute 42% (n = 53) of the sample.
Twelve percent of the articles (n = 15) are from media based in Canada. The publication
time of the articles stretched from late 2013 to 2019. As Figure 1 shows, five articles were
published in late 2013 when the sale of legal recreational marijuana was about to begin. In
2014, the first year of legal sale in Colorado and Washington, 19 articles raised the concern
of the persistent marijuana black market and discussed this issue from different angles. The
subject drew less media attention in 2015 and 2016, but there was an increase in the
numbers of articles discussing the issue of the black market in the flowing years. Especially,
large numbers of articles published in 2018 and 2019 because Canada, California, and
several more states began the legal sale of recreational marijuana.22
Number of Articles by Year of Publication
35
30
25
20
15
10
5
0
2013 2014 2015 2016 2017 2018 2019
Figure 1. Distribution of News Articles by Year of Publication (2013-2019)
Analytic Plan
The date analysis was conducted in two stages. The first stage of data coding, all
articles were examined and individual recording units (relevant textual passages from
articles) were identified. Retrieved articles were first saved in a Microsoft Word document.
Then the author conducted careful review of each article and recorded information
regarding types of article, publication year, media outlet locations, geographical locations
of the coverage, and interviewees’ reasons for staying in the black market in the form of
tally sheets. At the same time, recording units were highlighted and then recorded in a
separate Word file. Keyword searches within the Word document were used to assist the
reviewing process, but the majority of the work was done thorough the author’s reading of
each article.
The second-level analysis involved arranging and categorizing first-level recording
units to identify themes. Specifically, recording units were grouped to reflect opinions23
about reasons behind people’s decisions to stay in or go back to the black market. For
example, one grouping of recording units reflected that some marijuana growers chose to
stay in the black market because of the high taxes imposed on legal marijuana businesses.
Terms that frequently appeared in interviews were “high taxation” and “excessive tax”.
The theme of this group was labelled as “high tax” to the legal market. Recording units, in
form of story headlines and text, are displayed thematically in the “Results” section below
to best convey larger thematic ideas. Article headlines are presented in capital letters, while
article text is quoted and/or block formatted throughout.
Interrupted Time Series Quasi-Experiment
Interrupted time series models have long been recognized as a strong quasi-
experimental design for public policy research (Cook & Campbell, 1979). For large-scale
public policy interventions such as legalizing recreational marijuana, it is not feasible to
carry out true experiments that uses random assignments because policy changes affect the
entire population. Alternatively, interrupted time series models are used to assess the
impact of public policies by studying the trend of an outcome variable before and after
some demonstrable intervention points (Campbell & Stanley, 1966).
Applied to the current thesis, the intervention points are the months in which
Colorado or Washington significantly increased the requirements and restrictions for
marijuana establishments. Specifically, Colorado announced two significant changes to
marijuana regulations since the legalization. On November 23, 2015, it amended 47
existing regulations and adopted three additional requirements. For example, this version24
of regulation introduced new rules regarding marijuana establishments applying to obtain
financing from an indirect beneficial interest owner. All persons or business entities who
wish to become an indirect beneficial interest owner of a retail marijuana establishment
must to complete a rather complex application process and to be qualified by the authority.
It also added detailed rules regarding retail marijuana transporters to the previous version
that ranged from prohibited acts to the requirement of inventory tracking system to health
and safety regulations. There were also changes in many other areas. On January 1, 2017,
the Colorado legislature again revised 41 regulations and added 13 new ones. For instance,
this version introduced an entirely new set of rules regarding labeling and packaging. It
established requirements for packaging and labeling all containers immediately containing
retail marijuana flower and trim, marijuana concentrate and other types of marijuana
product. It required each label on a container to show a series of information of the
product’s history, such as the cultivator’s license number, the harvest batch number,
manufacturer’s license number, the net contents of the product, and potency test results.
Detailed rules such as font size, use of English language, and the use of prohibited
statements and phrases were also included. The 2017 version also introduced some new
rules regarding containment testing. It established that cultivation facilities and
manufacturers that produce retail marijuana, marijuana concentrate, or other types of
marijuana product should at least send one of their harvest batch to all contaminant testing
within every 30 days.
In Washington State, a significant marijuana regulation change was approved by
the legislature on May 18, 2016 and executed on June 18, 2016. The changes included
modifying 51 existing requirements and adding 12 new rules. One of the most important25
changes implemented was the application process. The new regulations require all
applicants to notify the public about their applications on the outside of the premises to be
licensed. It also established a priority system to determine the order that marijuana retailers
are licensed. Applicants who were operated or were employed by a collective garden prior
to January 1, 2013, have maintained a state business license and municipal business license,
and have had a history of paying all applicable state taxes and fees were given priority
status. The new version also introduced a set of requirements for quality assurance in
addition to the existing ones. For example, all producers and processors must provide
samples of their products to certified third-party laboratories for tests in order to ensure
quality assurance following the detailed sampling protocols provided. Although there were
other amendments or new policy implementations between 2014 and 2017, they do not
constitute significant regulatory changes because only a small number of regulations were
modified, or regulations were only modified slightly.
Therefore, November 2015 and January 2017 were selected as intervention points
for Colorado and June 2016 was selected as an intervention point for Washington State.
These intervention points represent the month in which Colorado or Washington
experienced a significant policy change that substantially increased the intensity of
regulations for licensed marijuana businesses and potential licensees in two states. The
hypothesis is that marijuana offense rates will increase after the implementation of new
sets of regulations.26
Data and Measurement
The analysis utilized National Incident-Based Reporting System (NIBRS) data
between 2014 to 2017 to measure marijuana offense rates before and after significant
regulation changes. For 2014 to 2016 NIBRS data, monthly drug/narcotic-violation
(primary suspected drug is marijuana) arrest rates per 100,000 population in Colorado and
Washington were calculated in the following steps to measure marijuana offense rates: (1)
Colorado and Washington NIBRS data was selected from the national database obtained
from the Institute for Social Research at the University of Michigan (ICPSR); (2) for each
state, drug/narcotic crimes were selected using incidents that had the value of 351
(drug/narcotic violations) for the variable named UCR offense Code-1; (3) drug/narcotic
crimes that had the value of 5 (marijuana) for the variable named Suspected Drug Type 1-
1 was further selected; (4) the total number of marijuana offenses in each month obtained
in step 3 was used to calculate the monthly crime rates per 100,000 population.
2017 NIBRS data was recently released at the time of this thesis and not yet available
on the ICPSR website. Therefore, the data was obtained from Federal Bureau of
Investigation (FBI)’s website instead. However, marijuana offenses rates were calculated
in a different way because data acquired from FBI’s website had not been aggregated into
a master file. It contained a number of smaller files, each reporting a key component of the
NIBRS data such as the type and quantity of suspected drug or the date and status of each
incident. Moreover, none of the individual smaller files provided sufficient information for
the interrupted time series analyses because each of them only contained partial
information regarding the incidents. For example, files entitled “suspected drug” provided
information on the type and quantity of reported drugs but did not indicate when the27
incidents occurred and the associated types of offenses. Therefore, 2017 marijuana offense
rates were calculated differently through the following steps: (1) Colorado and Washington
data were downloaded from FBI’s website; (2) For each state, files entitled “property” and
“suspected drug” were merged into one file to find the corresponding incident ID for each
drug related offense; (3) crimes associated with marijuana violation were selected manually
from data created in step 2; (4) information of incident date was added to the data created
in step 3 by merging it with files entitled “incidents”; (5) data created in step 4 was merged
with files entitled “offense” to identify the type of crime of each incident; (6) cases that are
identified as drug/narcotic violations (offense type value =16) were selected from the data
created in step 5; (7) the total number of marijuana offenses in each month obtained in step
6 was used to calculate the monthly crime rates per 100,000 population.
A preliminary analysis showed the number of law enforcement agencies in Colorado
and Washington reporting to NIBRS from 2014 to 2017 was very similar across these years
and almost every agency reported all 12 months. 2014 to 2017 were selected because
licensed marijuana retail in both states started in 2014 and 2017 is the most recent year that
has data available. For Washington State, only arrests reported after July 2014 were
included in the analysis because this was when marijuana retail first started in the state.
The Colorado data started in January 2014 for the same reason. Pre-legalization data was
not included in the analysis as all activities involving production, distribution, and
consumption of recreational cannabis were considered illegal at the time. Therefore,
marijuana crime rates were expected to be different before and after the legalization
regardless of regulation intensity due to the different nature of marijuana transactions.28
Analytic Plan
The interrupted time-series modeling method adopted in the current thesis is the
single group Interrupted Time-Series Analysis (ITSA) approach described by Linden
(2015). This is a robust approach to estimate treatment effects for a single treatment group,
a multiple group comparison, or when multiple sequentially interventions were introduced
(Liden & Arbor, 2015). For this research, I chose to use single group ITSA to estimate the
single treatment effect that occurred in Colorado and Washington due to the current
situation of marijuana legislation in the United States. It is not feasible to construct
comparison groups to estimate the magnitude of marijuana black market or changes of
patterns in marijuana illegal activities because all marijuana-related transactions are illegal
in states where recreational marijuana has not yet been legalized. Moreover, due to the
different intervention points identified in Washington and Colorado regulation changes,
the treatment effects in two states were measured separately.
As described in detail by Linden (2015), the single group interrupted time-series
model is defined as follows:
Yt = β0 + β1Tt + β2Xt + β3XtTt + εt
Yt is the outcome variable measured at each time period t, Tt is the number of
months that have passed since the initial measurement, and Xt is a dummy variable
indicating either prior to the intervention (Xt = 0) or after the intervention (Xt =1). XtTt is
an interaction term of Xt and Tt. β0 represents the intercept of the outcome variable. β1
represents the slope of the outcome variable prior to the intervention. β2 represents the
slope of the outcome variable after the intervention. A significant β2 indicates an immediateYou can also read