Marijuana Legalization in the Midwest: The Potential Impact - March 2019 Jeffrey B. Stamm Executive Director, Midwest HIDTA - Lawrenceks
←
→
Page content transcription
If your browser does not render page correctly, please read the page content below
Marijuana Legalization in the Midwest:
                  The Potential Impact

March 2019
Jeffrey B. Stamm
Executive Director,
Midwest HIDTA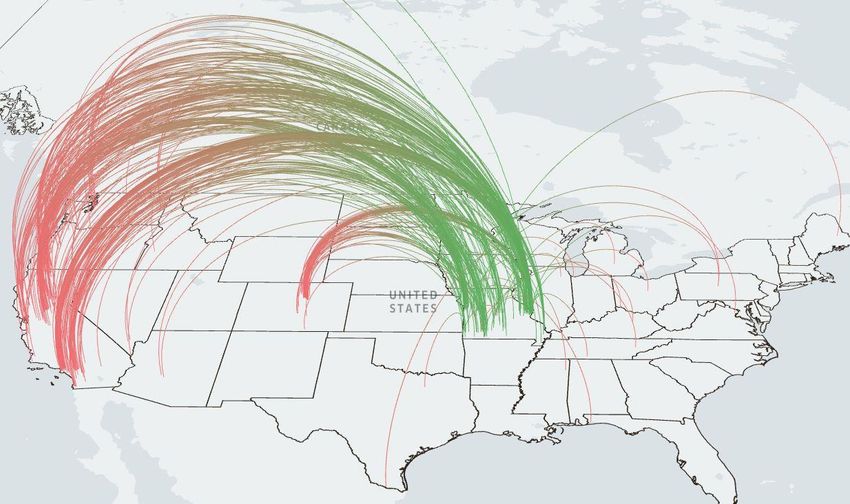
This page intentionally left blank
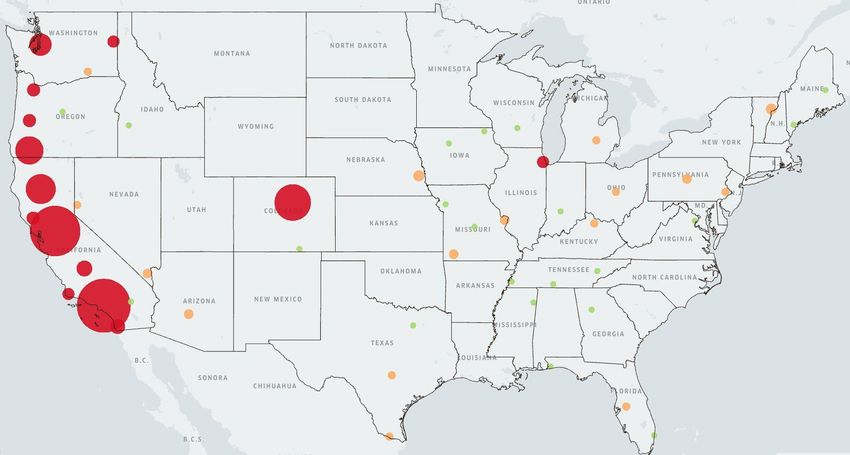
Table of Contents
Introduction ................................................................................................................................. 5
   The Midwest HIDTA Region ............................................................................................................... 5
   Purpose .................................................................................................................................................... 5
   Background ............................................................................................................................................. 6
Executive Summary .................................................................................................................... 7
Chapter 1: Diversion, Crime, and Traffic Fatalities ........................................................... 12
   Chapter Summary ................................................................................................................................ 12
   Overproduction .................................................................................................................................... 13
   Inadequate Regulation ........................................................................................................................ 13
   Diversion and Trafficking ................................................................................................................... 14
   Parcel...................................................................................................................................................... 14
   Crime ..................................................................................................................................................... 17
   Traffic Fatalities and Impaired Driving ............................................................................................ 22
Chapter 2: Accessibility and Use............................................................................................ 25
   Chapter Summary ................................................................................................................................ 25
   State Estimates of Youth Marijuana Use ........................................................................................... 25
   State Estimates of Adult Marijuana Use ........................................................................................... 28
   The Alaskan Example .......................................................................................................................... 29
Chapter 3: Impacts on Health ................................................................................................. 31
   Chapter Summary ................................................................................................................................ 31
   Emergency Room Visits, Hospitalizations, and Poison Center Data ........................................... 31
   THC Extraction Labs ........................................................................................................................... 34
   Pesticide Use ......................................................................................................................................... 35
   Contents of Marijuana Smoke ............................................................................................................ 36
Chapter 4: Potency .................................................................................................................... 37
   Chapter Summary ................................................................................................................................ 37
   Modern Marijuana ............................................................................................................................... 37
   Edible Marijuana .................................................................................................................................. 39
Chapter 5: Marijuana as an Opioid Alternative .................................................................. 41
   Chapter Summary ................................................................................................................................ 41
   Research................................................................................................................................................. 41
Chapter 6: The Inadequacies of Marijuana Reporting Systems ...................................... 44
   Chapter Summary ................................................................................................................................ 44
   Midwestern Requirements ................................................................................................................. 44
   Seed-to-sale ........................................................................................................................................... 45
   RFID ....................................................................................................................................................... 46
   Cloning .................................................................................................................................................. 46
   Theft ....................................................................................................................................................... 47
   Self-reporting Data Quality ................................................................................................................ 47
Chapter 7: Marijuana Revenue ............................................................................................... 48
   Chapter Summary ................................................................................................................................ 48
   Estimated Revenue for Midwest ........................................................................................................ 48
   Costs and Benefits of Marijuana in Colorado .................................................................................. 49
   Additional Costs................................................................................................................................... 50
   Falling Marijuana Prices...................................................................................................................... 51
Chapter 8: Regulatory Overview ............................................................................................ 53
   Chapter Summary ................................................................................................................................ 53
   Dosing Concerns and Physician Guidelines .................................................................................... 53
   Purchase and Possession Limitations................................................................................................ 54
   Packaging, Labeling, and Marketing................................................................................................. 55
Chapter 9: Terminology ........................................................................................................... 57
   Chapter Summary ................................................................................................................................ 57
   “Recreational” Marijuana ................................................................................................................... 57
   “Medical” Marijuana ........................................................................................................................... 58
   “Medical” Cannabidiol........................................................................................................................ 59
   Cannabis: A “Rebranding” of Marijuana ......................................................................................... 59
Conclusion .................................................................................................................................. 61
Appendices: ................................................................................................................................ 63
   Iowa Code Chapter 124E..................................................................................................................... 63
   Missouri Amendment 2 ...................................................................................................................... 65
   North Dakota Measure 5 ..................................................................................................................... 67
References................................................................................................................................... 69
Introduction
The Midwest HIDTA Region
The Midwest HIDTA’s seven-state area consists of Iowa, Kansas, Missouri,
Nebraska, North Dakota, South Dakota, and Rock Island County, Illinois. The region
spans over 428,000 square miles, encompasses 72 HIDTA-designated counties, and is
considered the largest of the Office of National Drug Control Policy’s 28 HIDTA regions.
It is as varied as it is vast, and incorporates major urban cities, separated by suburban
sprawl and rural bucolic settings. Within the Midwest HIDTA are more than 4,300 miles
of interstate highways and an international border stretching over 300 miles. Its central
location and intertwining roadways make the region ideal for drug trafficking
organizations and criminal entrepreneurs intent on transporting drugs into or through to
other destinations.
Purpose
The purpose of this report is to examine the effects of marijuana legalization in
other states in order to provide drug policy experts and law enforcement leaders with
potential impacts and consequences for Midwestern states that are contemplating the
legalization of “medical” and/or “recreational” marijuana. This report will utilize data
and trends from other states with legalized marijuana access in order to develop accurate
and relevant predictions. California, Colorado, Oregon, and Washington will frequently
be cited and used for comparison as their marijuana programs have existed long enough
for an adequate amount of data to be collected. This data includes, but is not limited to:
Marijuana-related crime and violence
Marijuana diversion
Drugged driving and traffic fatalities
Adult and youth marijuana use
Health-related impacts
The social costs of legalization
Marijuana-related revenue
5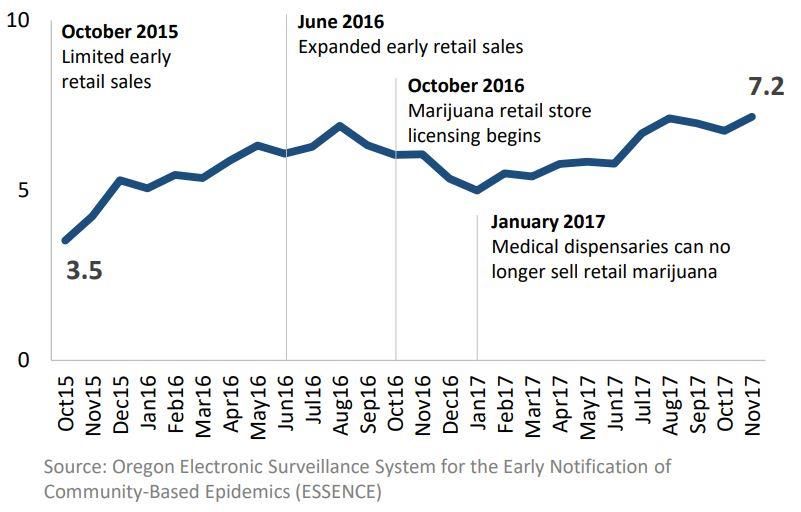
Background
       As of March 2019, two Midwest HIDTA states have legalized “medical” marijuana
and one has legalized “medical” cannabidiol (mCBD). Both Missouri and North Dakota
have authorized the cultivation, distribution, and consumption of marijuana for
“medical” purposes. Missouri passed Amendment 2 in November 2018, branding
Missouri as the thirty-second state to legalize “medical” marijuana. The program is
currently inoperable, but the Missouri Department of Health and Senior Services (DHSS)
will begin accepting applications for manufacturing, cultivation, and dispensing facilities
in August 2019. North Dakota Measure 5 passed in 2016, allowing marijuana to be used
for “medical” purposes. North Dakota’s marijuana program is not yet operational, but
state dispensaries are scheduled to open in 2019. In 2017, Iowa passed a legislative
initiative allowing the medical use of cannabidiol (CBD) for individuals with one of nine
qualifying medical conditions. The program is administered by the Iowa Department of
Public Health (IDPH) and became operational in 2018. The program authorized mCBD
products containing no more than three percent delta-9-tetrahydrocannbinol (THC) for
non-smoking use.

       Kansas, Nebraska, and South Dakota have yet to pass legislation authorizing the
use of “medical” or “recreational” marijuana, although bills have been introduced.
Legislative Bill 110, also known as the “Medical Cannabis Act”, was introduced in the
Nebraska State Legislature in January 2019. If passed, the bill would change provisions
relating to controlled substances and taxation, and create a framework for “medical”
marijuana. House Bill 2163, also known as the “Veterans First Medical Cannabis Act”,
was introduced in the Kansas State Legislature in February 2019. If passed, the bill would
authorize the use of marijuana in Kansas for health reasons. The “South Dakota
Marijuana Legalization Initiative” may appear on South Dakota’s November 2020 ballot.
If passed, the measure would allow anyone over age 21 to possess, grow, distribute, and
sell marijuana and marijuana paraphernalia.

                                            6
Executive Summary
Marijuana is the most widely available and commonly abused illicit drug in the
United States. The legalization of marijuana invokes consequences that are both extensive
and underreported, and its impacts on public health, safety, and the economy are
observable in many states with legalized access. The Midwest is not immune to the
adverse effects of marijuana legalization. This report will examine those and other
potential effects in the following sections.
Chapter 1: Diversion, Crime, and Traffic Fatalities
In 2018, more than 53,350 pounds of marijuana were removed from illicit markets
in the Midwest HIDTA.
o Marijuana represented 90 percent of the total drug weight confiscated by
Midwest HIDTA initiatives in 2018.
Ninety-two percent of the 1,491.8 pounds of marijuana and marijuana products
mailed to Iowa, Missouri, and North Dakota in 2018 originated from California,
Colorado, Oregon, and Washington.
Colorado, Oregon, and Washington all experienced increases in violent crime and
property crime in the years following legalization.I
The number of fatalities involving a driver testing positive for marijuana in
California increased by 34 percent between 2005 (n=273) and 2015 (n=366).1
After “recreational” marijuana was legalized in Colorado, marijuana-related
traffic deaths increased 151 percent while overall Colorado traffic deaths increased
by 35 percent. 2
The total number of Drug Recognition Expert investigations between 2014 and
2016 that resulted in a marijuana-impaired driving outcome increased by 66
percent in Oregon. 3
Fifty-one percent of drug-related fatal crashes in Iowa involved marijuana in 2016,
compared to 41 percent nationwide. 4
I All NIBRS data for California is unavailable during this time period.
7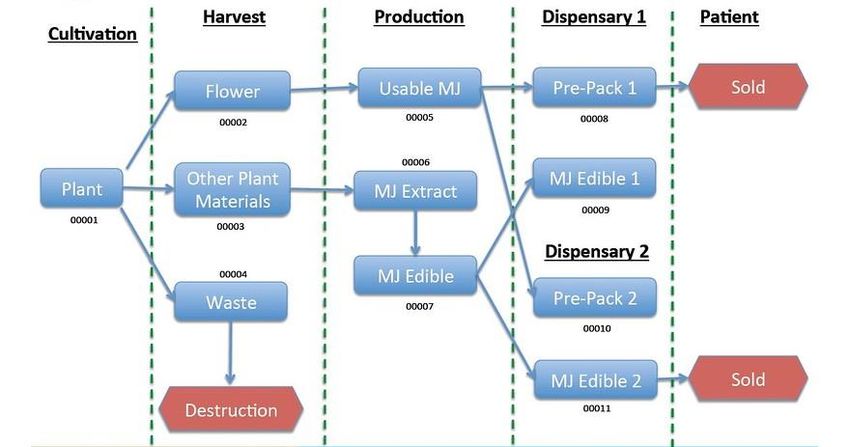
Chapter 2: Accessibility and Use
As California, Colorado, Oregon, and Washington saw a proliferation of
“medical” marijuana dispensaries, they also saw a corresponding increase in
marijuana use among all ages, as well as a decrease in the perception of risk, in the
years following legalization. 5 6
In 2017, past month marijuana use among youth aged 12-17 was:
o Seven percent higher in California than the U.S. average;7
o Forty percent higher in Colorado than the U.S. average; 8
o Sixty percent higher in Oregon than the U.S. average; 9
o Thirty-nine percent higher in Washington than the U.S. average. 10
In 2017, past year marijuana use among youth aged 12-17 was:
o Nine percent higher in California than the national average; 11
o Thirty-nine percent higher in Colorado than the national average;12
o Forty percent higher in Oregon than the national average;13
o Twenty-three percent higher in Washington than the national average.14
An Emory University study observed increases in current marijuana use,
frequency of marijuana use, and marijuana dependence among those aged 21 or
older after the implementation of “medical” marijuana laws across seven states.15
Alaska’s experiment with legalized marijuana in the 1970s demonstrated that an
increase in access led to an increase in use. During the 15 year experiment,
marijuana use among Alaskan adolescents was double (51.6 percent) the national
average (23.7 percent) for the same age group. 16
Chapter 3: Impact to Health
California, Colorado, and Oregon all experienced increases in marijuana-related
emergency department visits after the commercialization and/or legalization of
marijuana.
THC extraction labs present their own risks to public health. The process, which
carries a significant risk of explosion, yields highly potent marijuana concentrates.
In 2016, 79 percent of nationally reported clandestine THC extraction labs occurred
in California.17
8
There is limited information available from state agencies regarding pesticide
testing. This is worrisome in regards to health risks to consumers, as it makes it
difficult to calculate rates of marijuana contamination.
Chapter 4: Potency
According to the University of Mississippi’s Potency Monitoring Program, the
average percentage of THC found in samples of marijuana seized by the DEA
increased 199 percent between 1995 and 2014.18 THC levels were measured at
approximately 3.96 percent in 1995 and increased to approximately 11.84 percent
in 2014.19
During that same period, the average percentage of CBD decreased 48 percent.
Beginning in 2001, the average level of CBD steadily declines while the average
level of THC steadily increases.
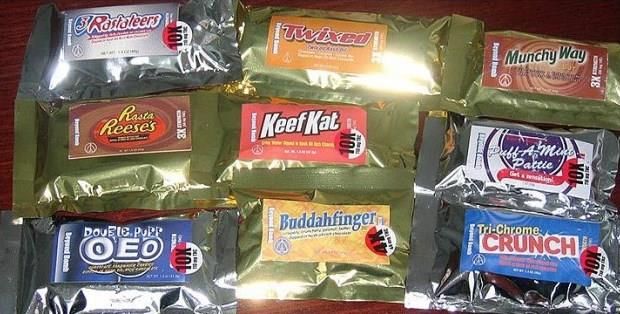
The levels of THC within edibles can vary across a single product or across entire
batches. This makes it difficult for users to estimate how much THC they consume,
increasing the risk of overdose and adverse reactions.20
Chapter 5: Marijuana as an Opioid Alternative
Unlike drugs approved by the FDA, “medical” marijuana has no standard in
quality control or production measures, nor are there high-quality studies of its
effectiveness or long-term safety.
Both the CDC and FDA state that there is not enough evidence that supports
marijuana as an opioid alternative at this time.
Every state with an operational “medical” marijuana program in 2015 that
reported overdose death data to the Centers for Disease Control and Prevention
(CDC) also experienced an increase in drug overdose deaths involving synthetic
opioids between 2015 and 2017.21
Studies that demonstrate a cannabinoid’s beneficial effect on an illness are for that
specific cannabinoid and not the entire marijuana plant.
9
Chapter 6: The Inadequacies of Marijuana Reporting Systems
Iowa’s, Missouri’s, and North Dakota’s marijuana programs require the
implementation of either a seed-to-sale or barcode tracking system.
Self-reporting systems have proven to be ineffective in preventing diversion as
there are no ways to ensure that dispensaries publish accurate or truthful data. 22
The potential for diversion exists within every state of marijuana cultivation,
regardless of the technologies used in the process.
Chapter 7: Marijuana Revenue
The total expected revenue for Iowa’s mCBD program is not known at this time.
All patient, primary caregiver, dispensary, and manufacturer licensing and
registration fees are collected by the IDPH.23 Manufacturers must reimburse the
Iowa Department of Public Safety for the full cost of the background investigations
required for licensing.24
Missouri’s “medical” marijuana program is expected to bring an unsubstantiated
$24 million in taxes and fees to state and local governments.
North Dakota’s “medical” marijuana program does not levy an excise tax on
marijuana sales. As a result, marijuana sales will be subject only to state and local
sales taxes.
For every dollar Colorado gained in tax revenue from marijuana sales, Coloradans
spent over $4.50 to mitigate the social costs of legalization.25
The long term environmental, economical, mental and physical health, and
societal impacts of marijuana cultivation and consumption are not fully
understood. Legalized marijuana is likely to have consequences that scientists may
not discover for decades.
Chapter 8: Regulatory Overview
Iowa’s, Missouri’s, and North Dakota’s marijuana measures all fail to establish
safe and effective dosage guidelines for physicians, while simultaneously
promoting marijuana’s purported effectiveness in treating illness without offering
substantial evidence.
10 Iowa’s mCBD program limits a patient to a 90-day supply of authorized CBD
containing no more than three percent THC.
If limitations are enacted by the Missouri DHSS, “medical” marijuana patients
may possess no less than four ounces and cultivate up to six flowering plants.
The North Dakota Department of Health has limited dispensaries from supplying
more than three ounces of marijuana to a patient every 14 days. Patients residing
more than 40 miles from a dispensary may cultivate up to eight plants.
Chapter 9: Terminology
There are significant differences between the “medical” and “recreational”
marijuana movements and their respective products. There are also significant
differences between mCBD and CBD.
Extensive scientific research has only been performed on two of the more than 480
chemical components in marijuana, which is why it has yet to receive approval
from the Food and Drug Administration (FDA).
The marijuana industry increasingly uses the term “cannabis” in an effort to
rebrand marijuana and distance itself from the stigmatization and negative
connotations associated with the term over the past century.
11Chapter 1: Diversion, Crime, and Traffic Fatalities
Chapter Summary
This chapter will examine the correlation between marijuana legalization, traffic
fatalities, crime rates, and diversion to illicit markets. The following information was
collected from state marijuana authorities, as well as federal, state, and local law
enforcement agencies:
In 2018, more than 53,350 pounds of marijuana were removed from illicit markets
in the Midwest HIDTA.
o Marijuana represented 90 percent of the total drug weight confiscated by
Midwest HIDTA initiatives in 2018.
Ninety-two percent (1372.5 pounds) of the seized marijuana and marijuana
products mailed to Iowa, Missouri, and North Dakota originated from California,
Colorado, Oregon, and Washington in the third and fourth quarters of 2018.
Colorado, Oregon, and Washington all experienced increases in violent crime and
property crime in the years following legalization.II
The number of drivers involved in traffic fatalities that tested positive for
marijuana have significantly increased over the past decade in both California and
Colorado.
The total number of Drug Recognition Expert investigations between 2014 and
2016 that resulted in a marijuana-impaired driving outcome increased by 66
percent in Oregon. 26
Fifty-one percent of drug-related fatal crashes in Iowa involved marijuana in 2016,
compared to 41 percent nationwide. 27
II All NIBRS data for California was unavailable during this time period.
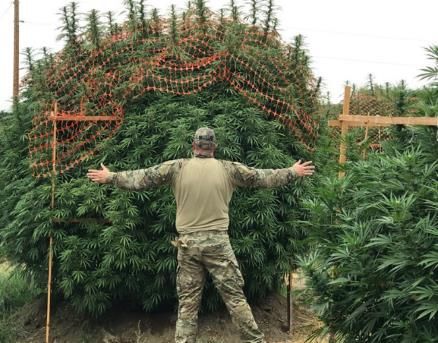
12Overproduction
Marijuana diversion represents a major challenge to both law enforcement and
public health agencies. Marijuana products are frequently produced in “legal” states,
trafficked across state lines, and distributed via black markets. States with legalized
marijuana are major suppliers to the rest of the United States. III The overproduction of
marijuana occurs when the supply exceeds the demand and the resulting stockpile drives
down prices in the legal retail market. The only legal option for growers or dispensaries
with a surplus of marijuana is to auction it at a heavily discounted price or suffer total
loss. Overproduction leads some businesses or individuals to sell marijuana on the black
market, often untaxed and at high prices, where it is ultimately trafficked out of state.
Many states struggle with overproduction. Estimates predict Oregon marijuana
users consume approximately 185,188 to 372,581 pounds annually.28 As of 2018, only 31
percent of the state’s recreational marijuana inventory had been distributed, leaving 69
percent unconsumed. Between July 2014 and June 2015, 32 percent of the marijuana
produced in Washington remained unsold, according to data from the state Liquor and
Cannabis Board. The Director of the California Growers Association stated in July 2017
that the state produced eight times the amount of marijuana that is consumed. 29 30
Inadequate Regulation
A January 2019 report issued by Oregon Secretary of State Dennis Richardson
asserts that Oregon’s marijuana program has failed to meet mandatory state inspections.
Gaps in the state marijuana program’s regulatory framework have contributed to the
diversion of marijuana to black markets.31 The Oregon Liquor Control Commission,
which is responsible for the regulation of the marijuana industry, has not been able to
properly enforce facility inspections and reporting because no cap was placed on the
number of cultivation licenses. Only three percent of retailers and 32 percent of growers
have had a compliance inspection.32 Due to the lack of regulation in Oregon’s marijuana
industry, approximately 14,550 pounds of marijuana have been seized en route to 37
states between July 2015 and January 2018.33
This statement is supported by data collected from the MW HIDTA DHE program, the Rocky Mountain HIDTA,
III
Oregon-Idaho HIDTA, national seizure reporting systems, postal seizures, and other law enforcement resources.
13Of the 33 states with some form of legalized marijuana, only one needs to have
faulty regulation to be capable of exporting tens of thousands of pounds throughout the
country.
Diversion and Trafficking
Midwest HIDTA initiatives confiscated more than 53,350 pounds of marijuana in
2018. Marijuana represented 90 percent of the total drug weight seized by Midwest
HIDTA enforcement initiatives in this time period. The most popular methods used to
divert “medical” and “recreational” marijuana are through the use of privately owned
vehicles and postal services. Marijuana is routinely seized during traffic stops, at bus and
train terminals, and in mail centers within the Midwest HIDTA. Seizures involving
hydroponic, “medical”, and other high-grade marijuana transported from California,
Colorado, Oregon, Washington and other states have become commonplace.
The Midwest HIDTA Domestic Highway Enforcement (DHE) program seized
26,267 pounds of marijuana and marijuana products that were destined to or transiting
through the Midwest HIDTA in 2018. Of the 1497 DHE events involving marijuana, 74
percent (n=741) originated from states with “recreational” marijuana programs and 75
percent (n=789) originated from states with either a “medical” marijuana or
“recreational” marijuana program.
With functioning medical marijuana programs, it is possible that Missouri and
North Dakota will become source states for marijuana exports. This will directly impact
the Midwest as higher quality marijuana becomes available in closer proximity, reducing
the distance diverted marijuana must travel to its market.
Parcel
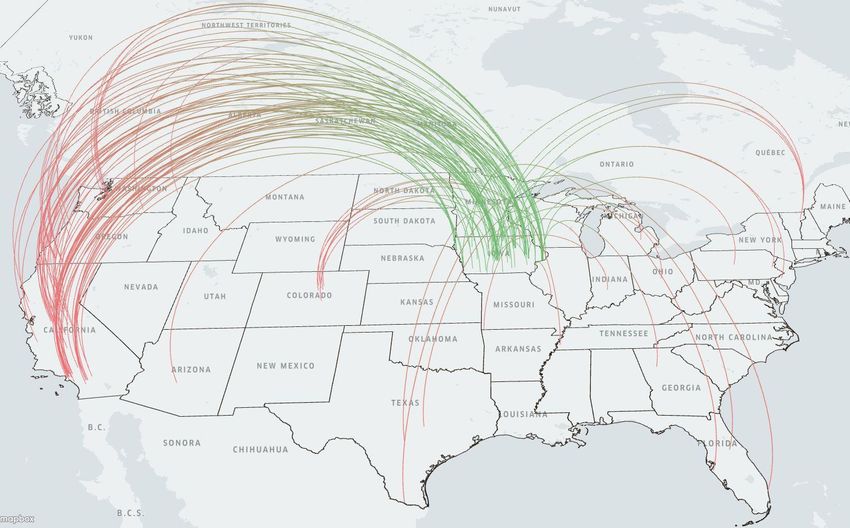
The accompanying maps display packages containing marijuana (or marijuana
products) destined for Iowa, Missouri, and North Dakota. The data only includes
packages that were intercepted in the third and fourth quarters of 2018. Figures 1-3
illustrate packages identified as containing marijuana or marijuana products destined for
Iowa, Missouri, and North Dakota, respectively. Using cluster analysis, Figure 4 shows
that the bulk of Iowa, Missouri, and North Dakota-bound marijuana originated from
California, Colorado, Oregon, and Washington. These four states, each with a “medical”
and “recreational” marijuana program, represented 92 percent of the 1,491.8 pounds of
marijuana and marijuana products destined for Iowa, Missouri, and North Dakota.
14Figure 1: FY2018 Q3 & Q4 Marijuana Parcel Seizures Destined for Iowa
Arc Analysis
Origin
Destination
Figure 2: FY2018 Q3 & Q4 Marijuana Parcel Seizures Destined for Missouri
Arc Analysis
Origin
Destination
15Figure 3: Third Quarter 2018 Marijuana Parcel Seizures Destined for North Dakota
Arc Analysis
Origin
Destination
Figure 4: Third Quarter 2018 MO and ND Marijuana Parcel Seizures Origins
16Crime
Legalized marijuana is not causative of lower crime. With the obvious decrease in
misdemeanor possession arrests aside, many states observe increases in violent and/or
property crime in the years following legalization. Types of crime associated with
marijuana use, trafficking, or distribution include: assaults, robberies, burglaries, home-
invasions, illegal marijuana grows, money laundering, and possession. It must be noted
that the increase in crime is not necessarily a direct result of the legalization of marijuana.
That being said, the correlation is evident.
After Colorado’s marijuana program became operational, violent crime increased
more than 18 percent and property crime increased more than eight percent between 2013
and 2016.34 All crime increased nearly 11 percent during the same time. 35 After the
commercialization of marijuana in Washington State, records show an increase in crime.
Data from the Federal Bureau of Investigation’s Uniform Crime Report (UCR) shows an
increase in multiple criminal offenses between 2013 (one year prior to marijuana
commercialization) and 2016. The number of assaults in Washington State increased by
24 percent; homicide offenses increased 23 percent, and human trafficking offenses
increased by 600 percent. Oregon legalized “recreational” marijuana in 2015. Oregon
experienced significant increases in crimes against persons between 2014 and 2016.
According to Oregon UCR data from this timeframe, there was a 153 percent increase in
assaults, 270 percent increase in homicides, 198 percent increase in kidnappings, and 216
percent increase in forcible sex offenses.
17Figure 5: Homicides Collected by
National Incident Based Reporting System (NIBRS)
Homicide Offenses Recorded by NIBRS
300
248
235
250
NUMBER OF HOMICIDES
Legalization 199 197 195
200 176 219
176 159
150 155 170 175
111 115
Legalization Legalization
100
64
50 33 31 30
0
2012 2013 2014 2015 2016 2017
YEAR
Source: FBI National Incident-Based
Reporting System Colorado Oregon Washington
According to 2012-2016 data from the NIBRS: IV
The number of homicides in Colorado increased by 41 percent;
The number of homicides in Oregon increased by 248 percent; V
The number of homicides in Washington increased by 41 percent;
The number of homicides in the U.S. increased by 41 percent.
IVAll NIBRS data for California is unavailable during this time period.
VNIBRS was not implemented statewide in Oregon; many counties during this time period were still using the UCR
system.
18Figure 6: Assaults Collected by
National Incident Based Reporting System
Assault Offenses Recorded by NIBRS
80,000 74,440
Legalization 67,196
70,000 59,150
54,194 56,146
NUMBER OF HOMICIDES
60,000 51,772
51,441 49,125
50,000 43,579 46,895
40,366 41,131
40,000 29,780 32,716
Legalization
30,000
Legalization
14,803
20,000 12,065 11,490 11,762
10,000
0
2012 2013 2014 2015 2016 2017
YEAR
Source: FBI National Incident-Based Colorado Oregon Washington
Reporting System
According to 2012-2016 data from the NIBRS:
The number of assaults in Colorado increased by 41 percent;
The number of assaults in Oregon increased by 171 percent;
The number of assaults in Washington increased by 28 percent;
The number of assaults in the U.S. increased by eight percent.
Figure 7: Total Offenses Collected by
National Incident Based Reporting System
Total Crimes Against Persons Offenses
Recorded by NIBRS
90,000 82,286
NUMBER OF OFFENSES
80,000 Legalization 74,365
70,000 64,803
59,274 61,643 60,694
56,385
60,000
50,000 57,498
54,731
47,729 48,360 50,964 37,065
40,000 33,220
Legalization
30,000 Legalization
16,477
20,000 13,343 12,633 12,893
10,000
0
2012 2013 2014 2015 2016 2017
Source: FBI National Incident-Based YEAR
Reporting System Colorado Oregon Washington
19According to 2012-2016 data from the NIBRS:
The total number of criminal offenses in Colorado increased by 27 percent;
The total number of criminal offenses in Oregon increased by 177 percent;
The total number of criminal offenses in Washington increased by 46 percent;
The total number of criminal offenses in the U.S. increased by nine percent.
Exploring the relationship between marijuana and crime is difficult as many law
enforcement agencies do not record the specific drug(s) involved in any crime within
their statistics. Because of this, there is no consistent dataset that represents state and local
populations equally. With the passing of “medical” marijuana in Missouri, there must be
a baseline set of marijuana-related crimes established prior to the implementation of the
marijuana program so that its effects may be measured in the coming years.VI
The following data from the Kansas City Police Department (KCPD) indicates a
five percent increase in the number of reports involving marijuana between 2016 and
2018.
All Reports Involving Marijuana
Year 2016 2017 2018 TOTAL
Number of Reports 4,247 3,993 4,466 12,706
Of the reports that mention marijuana when it was recovered from a crime or taken
as evidence, the following data illustrates a 6.7 percent increase between 2016 and 2018.
Recovered Property Involving Marijuana
Year 2016 2017 2018 TOTAL
Number of Reports 3,536 3,347 3,773 10,656
VI Marijuana-related crime statistics for Iowa or North Dakota could not be obtained during the writing of this report.
20The following table displays statistics from the St. Louis Metropolitan Police
Department for all crimes where marijuana was seized and tested positive by their crime
laboratory. Between 2016 and 2018, the total number of crimes involving marijuana
decreased by 3.6 percent. Most major crimes decreased within this period, although there
was an increase in the number of marijuana-related homicides, weapons violations, and
drug sale charges. It is important to note that since 2013, the City of St. Louis has reformed
its penalties for marijuana offenses.
St. Louis Marijuana-Related Crime
Year 2016 2017 2018
Aggravated Assault 78 70 61
All Drug Possession
(Involving MJ) 629 555 532
All Drug Sales (Involving
MJ) 5 5 13
Homicide 35 31 49
Robbery 16 14 15
Weapons Violation 219 246 252
All Crimes Involving MJ 1218 1111 1174
Violent and property crimes aside, an unusual form of criminal activity has
surfaced around the marijuana trade. Several marijuana-producing states have reported
cases of sexual exploitation, kidnapping, and forced labor linked to marijuana grows,
particularly in California’s Emerald Triangle region. Migrant workers that travel to the
region to work in both legal and illegal growing operations have experienced rape,
human trafficking, and other forms of abuse by marijuana growers.36 In addition to
crimes against persons and property, the legalization of “medical” and “recreational”
marijuana provides a host of opportunities for money laundering, fraud, and other
financial crimes.
Marijuana dispensaries are generally cash only businesses. As marijuana remains
illegal under federal law, banking and credit institutions generally prohibit marijuana
business owners from accepting check or credit card payments from their customers and
also prohibit the use of a banking account to store their proceeds. As a result, marijuana
businesses typically have a high volume of cash on their premises. The Routine Activities
Theory, a widely accepted and commonly cited criminological theory, suggests that the
organization of predictable activities in society create opportunities for crime.37
21According to this theory, crime occurs when a motivated offender, suitable target, and
lack of capable guardianship all intersect in time and space.38 In the context of marijuana
businesses, the customer or the dispensary represent a suitable target because of their
cash on hand. A lack of guardianship occurs if the dispensary lacks adequate security.
The business practices of marijuana dispensaries make them particularly susceptible to
the three elements of this theory, which represents an increased risk of criminal activity
surrounding the industry.
Traffic Fatalities and Impaired Driving
Like alcohol, driving under the influence of marijuana endangers not only the
driver and passengers, but everyone they encounter. Marijuana has measureable effects
that impair the ability to drive and react properly in critical situations. 39 40 The National
Highway Traffic Safety Administration’s (NHTSA) Drug and Alcohol Crash Risk Study
found that marijuana users are 1.25 times more likely to be involved in auto crashes than
drug-negative drivers.41 VII Because there is no roadside device to detect THC at this time,
many law enforcement agencies utilize Drug Recognition Experts (DREs) who base
arrests on indications of impairment. Arrests based on DRE opinions alone are not
accepted in all jurisdictions and may require a toxicology screening.
In California, the number of drivers who tested positive for marijuana increased
by 22 percent between 2005 and 2014.42 During the same time period, the number of
fatalities involving a driver who tested positive for marijuana increased by 17 percent. 43
According to data from the Fatality Analysis Reporting System, the number of fatalities
involving a driver testing positive for marijuana in California increased by 34 percent
between 2005 (n=273) and 2015 (n=366).44
This number reflects the unadjusted odds ratio of the association between drug class and category and crash risk,
VII
Table 28 of the NHTSA’s Drug and Alcohol Crash Risk Study.
22California Traffic Deaths Related to Marijuana
When a Driver Tested Positive for Marijuana
Fatalities with Drivers
Crash Total Statewide Percentage of Total
Testing Positive for
Year Fatalities Fatalities
Marijuana
2008 3434 234 10.40%
2009 3090 196 11.70%
2010 2720 192 13.20%
2011 2816 212 15.10%
2012 2966 266 9.50%
2013 3107 272 16.90%
2014 3074 252 15.70%
2015 3387 318 17.70%
2016 3623 N/A N/A
2017 N/A N/A N/A
After “recreational” marijuana was legalized in Colorado, marijuana-related
traffic deaths increased 151 percent while overall Colorado traffic deaths increased by 35
percent. 45 Fatalities involving drivers who tested positive for marijuana rose from 55 in
2013 to 138 in 2017. There were 481 total traffic fatalities across the state in 2013. Eleven
percent of those fatalities involved drivers who tested positive for marijuana. In 2017,
total traffic fatalities rose to 648, with 21 percent of drivers testing positive for marijuana.
46
Colorado Traffic Deaths Related to Marijuana
When a Driver Tested Positive for Marijuana
Fatalities with Drivers
Crash Total Statewide Percentage of Total
Testing Positive for
Year Fatalities Fatalities
Marijuana
2008 548 36 6.57%
2009 465 41 8.82%
2010 450 46 10.22%
2011 447 58 12.98%
2012 472 65 13.77%
2013 481 55 11.43%
2014 488 75 15.37%
2015 547 98 17.92%
2016 608 125 20.56%
2017 648 138 21.30%
23Among impaired driving fatalities in Oregon, analysis of toxicology results
between 2010 and 2015 show an average of five percent of drivers involved in driving
fatalities tested positive for THC.47 During the same period, only 38 percent of traffic
fatalities underwent toxicology screening.48 Information from Oregon State Police claims
that the total number of DRE investigations between 2014 and 2016 that resulted in a
marijuana-impaired driving outcome increased by 66 percent.VIII 49
Marijuana is the most-cited drug detected in fatal crashes in Iowa, according to
2016 data from the Governors Highway Safety Association and the Iowa Department of
Transportation.50 In 2016, 51 percent of drug-related fatal crashes in Iowa involved
marijuana, compared to 41 percent nationwide.51 Marijuana-related traffic fatality data
are unknown for Missouri and North Dakota. Missouri does not track the specific drug(s)
involved in a DUID case. Data was unavailable for North Dakota at the time of this report.
VIII All DRE examinations were validated by toxicological results; there were a total of 991 positive results by 2016.
24Chapter 2: Accessibility and Use
Chapter Summary
As California, Colorado, Oregon, and Washington saw a proliferation of
“medical” marijuana dispensaries, they also saw a corresponding increase in marijuana
use among all ages, as well as a decrease in the perception of risk. This likely has, and
will continue to, lead to increasing use, especially among youth aged 12 to 17.52 53 Using
these states as a predictive model, it is logical to conclude that when access to “medical”
marijuana becomes available, both youth and adult marijuana use will increase in
Missouri, North Dakota, and surrounding areas.
State Estimates of Youth Marijuana Use
According to data from the Substance Abuse and Mental Health Services
Administration (SAMHSA), states with legalized “recreational” and/or “medical”
marijuana moved up in the national ranking of past month marijuana usage by those
aged 12 to 17 from 2013 to 2014.54
In several western states with “medical” and “recreational” marijuana laws, the
increase in past month marijuana use rates among youth aged 12-17 is apparent in the
following 2017 National Survey on Drug Use and Health (NSDUH) data:
California was seven percent higher than the U.S. average;55
Colorado was 40 percent higher than the U.S. average; 56
Oregon was 60 percent higher than the U.S. average; 57
Washington was 39 percent higher than the U.S. average. 58
Youth aged 12-17 past year use in:
California was nine percent higher than the national average; 59
Colorado was 39 percent higher than the national average;60
Oregon was 40 percent higher than the national average;61
Washington was 23 percent higher than the national average.62
25Many other states with forms of marijuana legalization display increases in
marijuana use among both youth and adult populations. 63 Increases in drug availability
consistently translate to increases in drug use. Figure 8 on the following page compares
past month marijuana usage by those aged 12 to 17 in 2015-2016 and 2016-2017. States
with “medical” or “recreational” marijuana have higher youth use rates than states
without legalized marijuana access. States with a “recreational” marijuana program are
represented with a green bar. States with a “medical” marijuana program are represented
with a red bar. States with neither a “medical” or “recreational” marijuana program are
represented with a blue bar.
26Figure 8: Past Month Marijuana Usage by 12 to 17 Year Olds 2015-2017
Past Month Usage by 12 to 17 Year Olds Past Month Usage by 12 to 17 Year Olds
2015-2016 2016-2017
Rhode Island Vermont
Alaska Oregon
Oregon Maine
Maine New Mexico
New Mexico Rhode Island
Vermont Colorado
Colorado Washington
Massachusetts Massachusetts
Nevada Alaska
Montana Nevada
District of Columbia Montana
New Hampshire New Hampshire
Michigan District of Columbia
Connecticut Connecticut
Washington Michigan
Maryland Florida
Delaware Delaware
California Maryland
New York California
Indiana Illinois
Florida New York
Wisconsin Hawaii
Arizona Indiana
South Dakota Idaho
Illinois Ohio
State
State
Hawaii Arizona
Ohio North Carolina
South Carolina Kentucky
Georgia Nebraska
Pennsylvania South Dakota
Missouri Wisconsin
Tennessee Minnesota
Kansas Arkansas
Kentucky Missouri
West Virginia Wyoming
Texas Tennessee
Minnesota Louisiana
Wyoming Pennsylvania
North Carolina Virginia
Idaho South Carolina
Nebraska West Virginia
New Jersey Georgia
Louisiana Oklahoma
North Dakota Alabama
Arkansas Kansas
Iowa New Jersey
Virginia Iowa
Alabama Mississippi
Oklahoma North Dakota
Mississippi Texas
Utah Utah
Total U.S. Total U.S.
0% 2% 4% 6% 8% 10% 12% 0% 2% 4% 6% 8% 10% 12%
Percentage 27
PercentageState Estimates of Adult Marijuana Use
SAMHSA data illustrates that adult past year and past month marijuana use for
California, Colorado, Oregon, and Washington is significantly higher than the U.S.
average. The SAMHSA’s 2017 NSDUH indicates that adult past year use in:
California was nine percent higher than the U.S. average;
Colorado was 39 percent higher than the U.S. average;
Oregon was 40 percent higher than U.S. average, and
Washington was 23 percent higher than the U.S. average.
Adult past month use in:
California was seven percent higher than the U.S. average;
Colorado was 39 percent higher than the U.S. average;
Oregon was 40 percent higher than U.S. average, and
Washington was 23 percent higher than the U.S. average.
Figure 9: NSDUH Marijuana Use, Ages 12-17
Past Month and Year Marijuana Use Among 12-17 Year
Olds, by State; Percentages, Annual Averages
PERCENTAGE OF POPULATION
18
16
14
12
10
8
6
4
2
0
U.S. Total California Colorado Oregon Washington
STATE
Source: 2016-2017 NSDUH State Data Tables, Tables 2-3 U.S. Total Past Month Average Past Year Average
28Figure 10: NSDUH Marijuana Use, Ages 18+
Past Month and Year Marijuana Use Among
18+ Year Olds, by State: Percentages, Annual Averages
PERCENTAGE OF POPULATION
30
25
20
15
10
5
0
U.S. Total California Colorado Oregon Washington
STATE
Source: 2016-2017 NSDUH State Data Tables, Tables 2-3 U.S. Total Past Month Average Past Year Average
In addition to the nationwide statistics collected by the NSDUH, a comprehensive
study from Emory University’s Rollins School of Public Health examined the effects of
“medical” marijuana laws (MMLs) on alcohol and drug use. The researchers tested the
effects of MMLs in seven states and observed a 16 percent increase in the probability of
marijuana use, a 12 to 17 percent increase in marijuana use frequency, and a 15 to 27
percent increase in the probability of marijuana dependence among those aged 21 and
older.64 65 The study also found an increase in marijuana use initiation among those aged
12 to 20. The states with MMLs also saw a higher frequency of binge drinking among
those aged 21 or older.66
The Alaskan Example
Alaska’s experiment with legalized marijuana in the 1970s demonstrated that an
increase in access led to an increase in use. In 1975, the Alaskan Supreme Court ruled that
the state could not restrict an adult’s possession of marijuana for individual consumption
in the home.67 Following the ruling, Alaska state law allowed people over the age of 19 to
possess up to four ounces of marijuana in their homes without penalty. The ruling
initiated widespread marijuana use among the Alaskan public.
29In 1988, a University of Alaska study that examined drug use behaviors in
adolescents in grades seven to 12 publicized its findings that marijuana use among
Alaskan adolescents was twice (51.6 percent) the national average (23.7 percent) for the
same age groups.68 Despite the fact that marijuana use and possession by minors in
Alaska was prohibited, law enforcement admitted the difficulty of keeping it out of the
hands of school children.69
Seven years after the initial Alaska Supreme Court ruling, the National Institute
on Drug Abuse revealed that approximately 72 percent of Alaskan high school students
had used marijuana at least once. The equivalent figure nationwide was 59 percent. 70
Alaska’s residents voted again in 1990 to re-criminalize marijuana. In 1998, voters
legalized medical marijuana with the stipulation that one’s supply must come from
personal or in-home cultivation, rather than a dispensary. Alaska later legalized
“recreational” marijuana with Ballot Measure 2 in 2014.
30Chapter 3: Impacts on Health
Chapter Summary
This chapter will examine public health data related to marijuana use. This
includes marijuana-related emergency department visits and hospitalizations, THC
extraction laboratories, and pesticide usage. The following information was collected
from public health and law enforcement agencies.
California, Colorado, and Oregon all experienced increases in marijuana-related
emergency department visits in the years following the commercialization and/or
legalization of marijuana.
THC extraction labs present their own risks to public health. The process, which
carries a significant risk of explosion, yields highly potent marijuana concentrates.
In 2016, 79 percent of nationally reported clandestine THC extraction labs occurred
in California.71
The limited information available from state agencies regarding pesticide testing
poses health risks to consumers and makes it difficult to calculate rates of
marijuana contamination.
Emergency Room Visits, Hospitalizations, and Poison Center Data
Many states that legalize “medical” and/or “recreational” marijuana report
increases in marijuana-related exposures among children and adults, many of which
result in emergency department hospital visits. This increase is generally attributed to the
increase in marijuana’s availability. Marijuana use disorder, overdoses, and accidental
ingestion are the driving factors of marijuana-related hospital admissions.
California saw a 380 percent increase in emergency department visits between
2005 and 2016 for any related marijuana abuse; this includes primary and secondary
diagnoses.72 Among children aged 0 to 5, marijuana-related exposures resulting in
hospital admittance increased by more than 513 percent between 2005 and 2015.
Marijuana-related exposures of those aged 6 to 19 that resulted in hospital admittance
increased by 139 percent during the same period of time. For adults aged 20 and older,
there was a 64 percent increase in the number of marijuana-related exposures between
the years of 2005 to 2009 and 2010 to 2014.73
31Figure 11: California Emergency
Department Visits and Hospitalizations
California Emergency Department Visits and
Hospitalizations Related to Marijuana
160000
138599
ED VISITS AND HOSPITALIZATIONS
132677
140000 125418
118383
Commercialization
120000 104429
95909
100000
76814
80000 61520
60000 48974
39067
32884
40000
20000
0
2007 2008 2009 2010 2011 2012 2013 2014 2015 2016 2017
YEAR
Source: California Office of Statewide Health Planning and
Development (OSHPD, Healthcare Information Division
Colorado also saw an increase in marijuana-related hospitalizations and
emergency department (ED) visits. Data from the Colorado Hospital Association
indicates that emergency department visits for marijuana abuse, dependence, use or
poisoning increased from 8,198 cases in 2011 to 18,257 in 2014. 74 The total number of ED
visits has increased by 48 percent since legalization. The total number of hospitalizations
in Colorado have increased by 98 percent since legalization.
Figure 12: Colorado Emergency Department Visits
Colorado Emergency Department Visits
Related to Marijuana
25,000
21,010
NUMBER OF ED VISITS
19,809
18,257
20,000
14,151 14,632
15,000
9,982
8,198
10,000
5,000 Legalization
0
2011 2012 2013 2014 2015 2016 2017
YEAR
Source: Colorado Hospital Association, 2011-2017
32Figure 13: Colorado Hospitalizations
Colorado Hospitalizations Related to Marijuana
NUMBER OF HOSPITALIZATIONS
18,000
16,000 14,851
Legalization 16,365
16,669
14,000
11,454
12,000
10,000 8,270
8,000 6,310 6,720
6,000
4,000
2,000
0
2011 2012 2013 2014 2015 2016 2017
Source: Colorado Hospital Association, 2000-2017 YEAR
Information from Oregon’s Electronic Surveillance System for the Early
Notification of Community-based Epidemics (ESSENCE) states that the rate of
marijuana-related diagnostic codes in emergency department visits rose 85 percent
between October 2015 and October 2016.75 The majority of the patients in that data sample
were between 18 and 25 years of age. From October 2015 through November 2017, the
rate of ED visits with marijuana-related codes increased from 3.5 per 1,000 visits to 7.2
per 1,000 visits. There were 25,274 marijuana-related ED visits during the 26-month
timeframe.76
33Figure 14: Monthly Marijuana-Involved
ED Visits per 1,000 Visits, Oct. 2015—Nov. 2017
National emergency department visits and hospitalizations involving marijuana
are difficult to measure due to the way hospitals keep patient records. One nationwide
study from the Journal of Addiction Medicine showed that emergency department
visits that involved the use of marijuana had increased from 51 to 73 per 100,000
patients between 2004 and 2011. 77 Unfortunately, more recent figures are unavailable as
the Drug Abuse Warning Network, from which the study gathered information, was
discontinued in 2011.
THC Extraction Labs
Butane hash oil (BHO) extraction is a popular method of extracting the desirable
compounds from raw marijuana in order to create marijuana concentrates. The end result
of the extraction process, referred to as BHO, is used in the development of concentrates
like honey oil, wax, shatter, and other high-THC formulations. Certain states with
marijuana legislation restrict concentrate production to licensed manufacturing facilities,
while others allow individuals to conduct extraction techniques for personal use.
Regardless of the legality, BHO extraction can produce devastating results if not
conducted properly. Clandestine THC extraction laboratories are risky as the solvents
used in the extraction process, (alcohol, butane, propane, and hexane) are extremely
flammable and can result in an explosion.
34Clandestine extraction lab explosions can cause environmental damage, personal
injury, and death. From July 2015 through January 2018, the Legacy Emmanuel Oregon
Burn Center treated 71 burn victims as a result of BHO explosions, costing an estimated
$9.6 million.78 During that same time period, law enforcement discovered 64 clandestine
extraction labs, 21 of which resulted in either a fire or explosion. There were more THC
extraction labs discovered in California in 2015 and 2016 than methamphetamine
conversion labs, illustrating the increasing popularity and demand for marijuana
concentrates.79 Clandestine THC extraction labs pose a significant threat to public safety
and endangers not only those who engage in the clandestine extraction techniques, but
innocent victims as well.
Pesticide Use
Researchers and federal authorities are finding increasing amounts of harmful
pesticides used in marijuana cultivation around the country. As with any crop, marijuana
cultivators use pesticides to protect their plants from harmful insects, animals, and other
pests. Many of these pesticides, however, are harmful to humans, wildlife, and the
environment and are either being used without proper authorization from state
authorities or are illegal for use in the United States.
Much of the legislation responsible for the establishment of legalized marijuana
requires pesticide testing for retail sales of marijuana. The current regulations and testing
protocols used by state marijuana agencies are imperfect and allow for significant
amounts of product tainted with unauthorized or unsafe levels of pesticides to slip
through to sale. Oregon’s marijuana program has failed to meet a wide array of
mandatory state inspections. The testing system it uses to ensure that retail marijuana is
free of pesticides, mold, and heavy metals has proven to be inadequate, although the state
routinely adjusts its standards for what qualifies as passing levels. Colorado has not yet
implemented pesticide regulations due to regulatory delays. Other states, like
Washington and California, are still establishing pesticide regulations on commercial
marijuana.
In 2017, the Oregon Liquor Control Commission issued its first recall for
“recreational” marijuana products after samples were found to contain levels of the
pesticide pyrethrin that were above the state limit.80 In November 2018, public health
agencies in Colorado issued a recall of 23 products from retailer Colorado Wellness
Center LLC dba Lush due to their use of non-approved pesticides.81 That same month,
35You can also read