SFR Evaluating Due Diligence Programs for Conflict Minerals: A Matched Analysis of 3T Mines in Eastern DRC - Project on ...
←
→
Page content transcription
If your browser does not render page correctly, please read the page content below
Evaluating Due Diligence Programs for Conflict Minerals:
A Matched Analysis of 3T Mines in Eastern DRC
November 2020
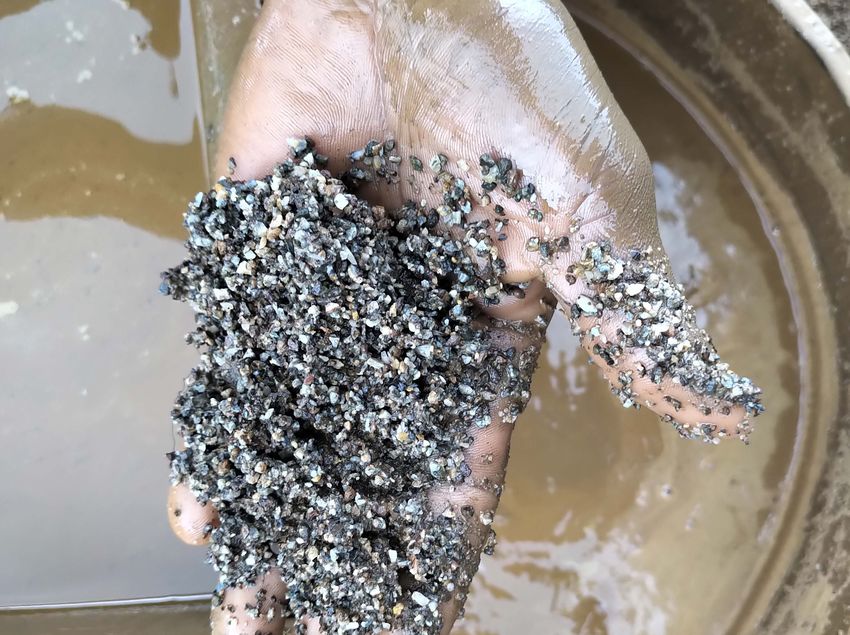
SFREvaluating DDP for Conflict Minerals Version: November 2020 Evaluating Due Diligence Programs for Conflict Minerals: A Matched Analysis of 3T Mines in Eastern DRC To cite this report, please use the following reference: PRG, IPIS, SFR, and Ulula. Evaluating Due Diligence Programs for Conflict Miner- als:A Matched Analysis of 3T Mines in Eastern DRC. Los Angeles and Antwerp, 2020. Main authors: Project on Resources and Governance (PRG) at the University of California, Los Angeles (UCLA) conceived of the research design, supported the design of sur- vey instruments, guided the sampling of mines, performed the matching analysis, and led the writing of the report. International Peace Information Service (IPIS) conducted the study’s field re- search in the provinces of South Kivu and Maniema in eastern Congo, including the data collection at mining sites and households. IPIS also contributed to the village and mine site sample selection, design and development of the survey instruments, and data analysis. Sub-Saharan Field Research and Consulting Services (SFR) led the enumerator training and supported the design of the survey instruments. Ulula supported the design of survey instruments and reviewed the results pre- sented in the report. Funding Acknowledgement: This research was supported by a private company that participates in the due diligence programs that this report evaluates. The report’s authors independently designed the research, collected and analyzed data, and interpreted their findings. Anonymized data and replication code will be posted to enable third-party replication of all results. Cover image: Washed cassiterite by Timo Makori.
EVALUATING DDP FOR CONFLICT MINERALS   2

Contributors

International Peace Information Service (IPIS) is an independent research insti-
tute, providing governmental and non-governmental actors with information and
analysis to build sustainable peace and development in Sub-Saharan Africa. IPIS
Contributors: Zacharie Bulakali, Erik Gobbers (erik.gobbers@ipisresearch.
be), Thomas Muller.
   Project on Resources and Governance (PRG) at the University of California,
Los Angeles (UCLA) is a non-profit research initiative that applies insights from
the social and behavioral sciences to find effective solutions to governance prob-
lems in resource-rich countries. PRG Contributors: Graeme Blair, Darin Chris-
tensen (darinc@luskin.ucla.edu), Jihae Hong, J. Sebastián Leiva-Molano.
  Sub-Saharan Field Research and Consulting Services (SFR) is an independent
market and socio-politico research agency based in Kenya specializing in primary
quantitative and qualitative research in sub-Saharan Africa. SFR Contributors:
Geoffrey Kimani (geoffrey.kimani@s-sfrcs.co.ke), Simon Kimani, Oscar
Odhiambo.
  Ulula provides software and analytics solutions to create more transparent
and responsible supply chains. Ulula Contributors: Antoine Heuty (antoine@
ulula.com), Timo Makori.
   We would also like to thank the following Congolese field researchers for their
support in data collection: Alininyu, Ntangamyampi Guillaume; Amisi, Kanganju
Revé; Anyasi, Kitoko Beauvalot; Assumani, Lukindula Lavoisier; Bahati, Mayele
Jacques; Bengehya, Nabyenda Jibrown; Buzigirwa, Mushota Bouve; Chance, Cik-
anga Clarice; Cubaka, Bisimwa Christian; Faida, Wakengela Odette; Mbii, Katopa
Therèse; Mirindi, Mudukwe Mike; Mugisho, Mulenga Espoir; Mukulumania, Mung-
azi Dido; Mulindwa, Mateso Bienfait; Okoko, Akasa Bienvenue; and Wangozi,
Tumba Prosper.
EVALUATING DDP FOR CONFLICT MINERALS   3

Executive Summary

The 2010 Dodd-Frank Act requires that US-listed companies sourcing so-called
“conflict minerals” from Africa’s Great Lakes region conduct due diligence. (The
EU now imposes similar requirements.) Due diligence programs (DDP), following
guidelines from the OECD, provide ongoing monitoring of mineral production and
processing to ensure that suppliers respect human rights and do not contribute
to conflict. A decade later, we still have limited evidence about whether DDP
impacts economic and security conditions.
   To help fill this gap, we evaluate the impacts of DDP on mining communities in
the eastern Democratic Republic of Congo (DRC). Combining statistical match-
ing with new data from over one hundred 3T (tin, tantalum, and tungsten) mines
and one thousand households, we report several findings:

1. DDP areas see less interference by the Armed Forces of the Democratic Re-
   public of Congo (FARDC). Households in DDP areas report 27% less FARDC
   presence and taxation relative to households in non-DDP areas.

2. DDP areas see a heightened presence of government regulators. Households
   in DDP areas report over 58% more tax collection and service provision by
   government regulators; they do not, however, report feeling more secure than
   households in areas without DDP.

3. Mines in DDP areas do not have significantly lower rates of child labor. Some
   child labor is reported at roughly one third of mines in DDP areas, a rate that
   is not statistically distinguishable from mines in non-DDP areas.

4. DDP areas show hopeful, if statistically inconclusive, evidence of greater eco-
   nomic well-being than non-DDP areas.

   How one regards these impacts depends on the benchmark for success. We
detect meaningful progress toward several goals in DDP areas; yet, we also find
that DDP does not eliminate all of the harms associated with 3T mining in the
eastern DRC. We uncover reasons to applaud these efforts, but also room for
improvement, particularly with respect to labor practices and miners’ livelihoods.
   Our results rely on the analysis of original survey data collected from 104
mine sites and 1,054 households in nearby villages in South Kivu and Maniema at
the end of 2019. We employ a matching technique that compares mining areas
with and without DDP that have similar geographies, histories of conflict, and
development trajectories. This statistical approach helps us isolate differences
that can be attributed to DDP.
EVALUATING DDP FOR CONFLICT MINERALS    4

Contents

      Acronyms and Abbreviations                                                         6
1     Introduction                                                                       7
2     Background                                                                        9
2.1      Government Regulation of ASM Sector                                            10
2.2      Due Diligence Programming                                                      10
2.3      Existing Research on DDP                                                       12

3     Hypotheses                                                                        13
4     Sampling and Data Collection                                                      14
4.1      Site Selection                                                                 14
4.2      Survey Enumeration                                                             15
4.3      Mine-site Surveys                                                              16
4.4      Household and Individual Surveys                                               16

5     Sample Characteristics                                                            17
5.1      Mine Sites                                                                     17
5.2      Households                                                                     20
5.3      Individuals and Gender Differences                                             22

6     Empirical Approach                                                                23
6.1      Motivation for Matching                                                        23
6.2      Matching Algorithm                                                             24
6.3      Pre-treatment Characteristics                                                  24
6.4      Matched Sample                                                                 25
6.5      Index Creation                                                                 26

7     Results                                                                           26
7.1      Implementation of DDP                                                          26
7.2      FARDC Interference and State Presence                                          27
7.3      Conditions of Extraction                                                       29
7.4      Economic Well-being                                                            30
7.5      Sub-group Analysis                                                             31

8     Conclusion                                                                        32
9     Appendix                                                                          35
9.1      Additional Contextual Detail                                                   35
9.2      Imbalance in Full Sample of 3T Mines                                           42
9.3      Balance in Matched Sample                                                      43
9.4      Full Item-Level Results                                                        44
9.5      Full Index Results                                                             48
9.6      Sub-group Analysis                                                             49
EVALUATING DDP FOR CONFLICT MINERALS 5 List of Figures 1 Location of Sampled Mines in South Kivu (Gold) and Maniema (Teal) 15 2 Number of Workers 18 3 Occupations of Household Heads 21 4 Perceptions of Household Heads 21 5 Gendered Perspective on ASM’s Impacts 23 6 Presence of State Agents 28 7 Miners’ Perceptions of Cooperatives 37 8 Accessibility of Mines 38 9 Correlates to Insecurity 40 10 Perceptions of Adults 41 List of Tables 1 Completed Surveys 16 2 Characteristics of Individuals 22 3 Matched Sample 25 4 DDP Implementation 26 5 Illegal Taxation at Mines 27 6 Change in State Presence and Services 29 7 Conditions of Extraction 30 8 Characteristics of Mine Sites 35 9 Governance of Mine Sites 39 10 Initial Imbalance (N =184) 42 11 Balance after Matching (N =43) 43 12 Matched Analysis of Mine-site Variables 44 13 Matched Analysis of Household Survey Variables 45 14 Matched Analysis of Individual Survey Variables 47 15 Matched Analysis of All Indexes from Household Survey 48 16 Matched Analysis of Individuals Survey Variables by Gender 49
EVALUATING DDP FOR CONFLICT MINERALS   6

Acronyms and Abbreviations

     ACLED     Armed Conflict Location and Event Data
     ASM       Artisanal and Small-scale Mining

     BGR       Federal Institute for Geosciences and Natural Resources

     CEM       Coarsened Exact Matching
     CNPSC     National Coalition of the People for the Sovereignty of
               Congo

     DDP       Due Diligence Programming
     DRC       Democratic Republic of Congo

     FARDC     Armed Forces of the Democratic Republic of Congo
     FDLR      Democratic Forces for the Liberation of Rwanda

     IDPs      Internally Displaced Persons
     ILO       International Labor Organization
     ITA       International Tin Association
     ITSCI     International Tin Supply Chain Initiative

     NSAG      Non-state Armed Group

     ODK       Open Data Kit
     OECD      Organization for Economic Co-operation and Development

     SAEMAPE   Service for Assistance and Supervision of Artisanal and
               Small-Scale Mining
     SAKIMA    Société Aurifère du Kivu et Maniema

     ZEA       Artisanal Exploitation Zone
EVALUATING DDP FOR CONFLICT MINERALS 7
1 Introduction
Over the last decade, efforts to eliminate so-called “conflict minerals” have fo-
cused on denying access to world markets and global supply chains, aiming
to break the link between illicit minerals extraction and the financing of armed
groups. This strategy has been propelled by regulatory regimes in the United
States (notably the 2010 Dodd-Frank Act) and, more recently, the European Union
(EU), as well as more broadly at the international level via the Organization for
Economic Co-operation and Development (OECD) Responsible Minerals Due Dili-
gence Guidelines, which requires companies to conduct supply chain due dili-
gence for gold and 3T metals (tin, tantalum, and tungsten) sourced from conflict-
affected and high-risk countries.
In theory, denying illicit minerals trade access to world markets and global
supply chains should limit the (financial) incentives of armed groups and other
bad actors to attack, extort, or control mining activity. The strategy, however,
wrongly presumes that we can separate out illicitly produced minerals; an im-
practical exercise near the end of the supply chain, as illicit ore does not carry
any distinguishing markers. Due Diligence Programming (DDP) arose to over-
come this challenge: intending to verify the origin of minerals and generate a
chain of custody for ore from the mine to the smelters and refiners.
Despite its expansion, we still have limited evidence regarding the impacts of
DDP on conflict and well-being in mining regions, like eastern DRC. Focusing on
the immediate aftermath of the 2010 Dodd-Frank Act, several studies reached
alarming conclusions, finding, for example, that armed conflict increased with
the bill’s passage (e.g., Parker and Vadheim, 2017). Yet, these studies do not iso-
late the effects of DDP; rather, they capture a bundle of policy changes, including
a multi-year suspension of Artisanal and Small-scale Mining (ASM) across much
of eastern DRC. A more recent policy report also attempted a comparison of min-
ing areas in eastern DRC with and without DDP (IPIS/Ulula, 2019). Yet, that report
acknowledges that its DDP and non-DDP groups differ along many dimensions,
making it hard to attribute changes to DDP.
We advance this debate by offering more credible estimates of DDP’s impacts.
We gather original data from 104 mine sites in the provinces of South Kivu and
Maniema, as well as surveys in neighboring communities from a representative
sample of 1,054 household heads and 1,000 adults. To better isolate the effect
of DDP, we employ a matching strategy, identifying 3T mining areas in our sample
that are similar in terms of measurable characteristics except for the presence
of DDP.1 Our estimates of DDP’s impacts, thus leverage comparisons of mining 1
We focus attention on the ITSCI program, as
areas located in the same province and with similar geographies, histories of it is the primary due-diligence program for 3T
mines in eastern DRC.
conflict, and development trajectories. In this way, matching helps us rule out
many other factors besides DDP that might account for divergent outcomes.EVALUATING DDP FOR CONFLICT MINERALS 8
Our analysis uncovers several important findings:
• First, DDP areas see lower rates of interference by Armed Forces of the Demo-
cratic Republic of Congo (FARDC); army units play important roles in the illicit
networks that control or extort 3T mines (Matthysen et al., 2019). Households
in DDP areas report 27% less FARDC presence and taxation relative to house-
holds in non-DDP areas (our control group).2 2
Since activity from non-state armed groups is
exceedingly rare in our matched sample during
• Second, we find greater presence and more frequent activities of state min- the study period there is no room for improve-
ment.
ing agents in DDP areas. Households report that the Mining Division and
Service for Assistance and Supervision of Artisanal and Small-Scale Mining
(SAEMAPE) — the government agencies charged with oversight, technical
support, and taxation — more commonly provide services and collect taxes.
While households do not report more frequent demands for irregular pay-
ments from these state agents, informants at most DDP and control mines
report instances of duplicative, excessive, or unlawful taxes. We also note
that the influx of these state agents and the Mining Police (and the withdrawal
of the FARDC) is not reflected in households’ perceptions of safety; such per-
ceptions do not differ between DDP and control areas.
• Third, we do not detect differences in the conditions of extraction. We record
very few instances of forced labor in our matched sample, and have no scope
to detect reductions.3 Enumerators observed some child labor at roughly one 3
The International Labor Organization (ILO)
third of mines covered by DDP, a rate not statistically distinguishable from definition of forced labor includes work or ser-
vice that has been extracted under threat of
control mines. DDP does not eliminate child labor, and we do not find a sta- penalty and has not been offered voluntar-
tistically significant improvement along this important dimension. ily. Measurement of forced labor sometimes
includes questions regarding freedom of as-
sociation, use of force or menace, and debt
• Fourth, we find some weaker evidence of greater economic well-being among bondage or the withholding of wages. We did
households in DDP areas, who report higher consumption levels. We cannot not separately ask about these dimensions;
pin down the source of these differences; they could be due to the differences forced labor may, thus, be under-reported.
in FARDC and state presence, or the higher rates of employment in mining in
DDP areas. We find no indication that DDP mines are more productive or can
command higher prices for their ore, so it seems unlikely that DDP mines can
afford higher wages.
• Finally, our representative sample of adults living in these mining commu-
nities includes men and women in equal proportion. Using these surveys to
look at whether DDP has different impacts on men and women, we see similar
effects, with two exceptions: (a) the increase in female respondents’ knowl-
edge of DDP is not as large as for male respondents in the DDP areas, likely
due to their more limited employment in mining; (b) among women, DDP is
associated nwith improved perceptions of ASM – specifically of its impacts
on access to clean water, health, and general village life.
How one regards these differences depends on their benchmark for success.
DDP is not perfectly implemented, nor does it eradicate unlawful taxation or laborEVALUATING DDP FOR CONFLICT MINERALS 9
practices, including child labor.4 Yet, along some important dimensions, DDP ap- 4
Child labor, as defined in Congolese Law and
pears to foster meaningful improvements. Our household and individual surveys measured in this report, involves labor among
children age 15 and under. We cannot further
also uncover no evidence that people believe DDP to have unintended, adverse distinguish the “worst forms” of child labor in
effects: perceptions of ASM’s contributions to village life do not darken in DDP our surveys.
areas.5 Detailed programming data on the scale-up of DDP in eastern DRC would 5
Perceptions of ASM do not, for the most part,
permit a broader analysis than what we undertake here, including a consideration differ between DDP and non-DDP areas. In
our individual surveys, we see more favorable
of cost-effectiveness. perceptions in DDP areas of ASM’s effects on
The remainder of this report proceeds as follows: (1) we situate the study in health and the availability and cost of food.
the local context and existing literature on DDP; (2) we enumerate a set of hy-
potheses based on a theory of change posited by the OECD; (3) we describe our
data collection; (4) we provide a descriptive analysis of our sample of mines,
households, and individuals; (5) we outline our matching approach and its im-
plementation; and (6) we report results from our matched analysis. We provide
additional background and empirical detail in the appendix for interested read-
ers.
2 Background
Eastern DRC comprises the provinces of South Kivu, North Kivu, Maniema, Ituri,
and Tanganyika. Of the approximately 23 million people who live in the region, a
majority reside in rural and peri-urban areas (INS, 2019). Our data collection and
analysis focus on the provinces of Maniema and South Kivu.
Wars raged in the DRC from 1996 until 2003 (for additional historical back-
ground, see Stearns, 2012; Lemarchand, 2009). The first Congo War (1996–1997)
put an end to the dictatorial regime of Mobutu Sese Seko.6 The second Congo 6
A coalition of Congolese rebel groups, di-
rected by Rwanda, waged the First Congo War.
War (1998–2003), while initially launched to overthrow President Laurent-Désiré
Rwanda aimed to neutralize Hutu militias in
Kabila, devolved into fights over Congo’s natural resources. Local armed groups North and South Kivu, which had fled Rwanda
abetted the removal of large flows of gold, coltan, and cassiterite (Turner, 2007). in the aftermath of the 1994 genocide.
The 2001 Report of the United Nations Panel of Experts argued that revenues
from illicit minerals finance armed groups in eastern DRC, which fuels and per-
petuates regional conflicts. 7 7
A peace agreement was signed in 2003 be-
International initiatives have attempted to restrict the illicit trade of so-called tween the Congolese Government and several
warring rebel groups, free elections took place
“conflict minerals,” specifically gold and the 3T metals (tin, tantalum, and tung- in 2006, and larger rebel movements frag-
sten, which are derivatives of cassiterite, coltan, and wolframite). Notwithstand- mented. However, a persistent governance cri-
sis enables the proliferation of smaller (splin-
ing these efforts, armed or criminal groups continue to interfere in the produc- ter) armed factions and groups of bandits, es-
tion and trade of minerals and commit abuses.8 Currently, the DRC contains pecially in eastern DRC.
5.5 million Internally Displaced Persons (IDPs), with about 1.7 million new IDPs 8
A 2019 report concludes that although most
recorded in 2019, primarily in the provinces of South Kivu, North Kivu, and Ituri armed conflicts appear unrelated to mining,
armed interference in ASM persists in remote
(IDMC, 2019).
areas, especially in the territories of Fizi and
While the minerals trade can contribute to conflict, eight to ten million people Shabunda in South Kivu (Matthysen et al.,
in the country also directly or indirectly depend on ASM for their livelihood (World 2019).
Bank, 2010). In North and South Kivu, estimates range from 1 to 1.75 million peo-
ple who depend on ASM (9–17% of the population in those provinces) (Geenen
and Radley, 2013). ASM generates commerce and creates jobs that sustain manyEVALUATING DDP FOR CONFLICT MINERALS 10
families (Matthysen and Zaragoza, 2013).
2.1 Government Regulation of ASM Sector
ASM is regulated by the 2018 Congolese Mining Code (Code Minier), the Mining
Regulation (Règlement Minier), and several ministerial decrees.9 According to 9
The 2002 Mining Code marked a renewed
these laws, artisanal miners must hold a license, belong to a mining coopera- effort by the Congolese government to for-
malize the mining industry generally, and the
tive, and work in a so-called Artisanal Exploitation Zone (ZEA), designated by the ASM sector in particular. It was modified
Mining Cadastre (Cadastre Minier).10 Many 3T mines fall outside of ZEAs, on and updated in 2018 (Loi n°18/001 du 9 mars
2018). Other decrees include: Décret N°
industrial concessions held by Société Aurifère du Kivu et Maniema (SAKIMA), a 038/2003 du 23 mars 2003 and Arrêté min-
state-owned mining company that has ceased production and now hosts ASM. istriel N°0058/CAB.MIN/MINES/01/2012 du
SAKIMA has signed contracts with a number of mineral traders (comptoirs), grant- 29 février 2012.
ing some of them the exclusive right to buy minerals at validated mines within 10
The Mining Code limits ZEAs to areas that
are unsuitable for industrial mining. The Min-
its concessions (Matthysen et al., 2019). istry of Mines approves a new ZEA by ministe-
Two state mining services agencies directly oversee the ASM sector: the rial decree after consultation with the provin-
provincial Mining Division (Division des Mines) and Service for Assistance and cial governor, the provincial Mining Division,
and the Mining Cadastre.
Supervision of Artisanal and Small-Scale Mining (SAEMAPE). The Mining Divi-
sion is charged with issuing cards to miners (carte de creuseur) and dealers
(carte de négociant) and is responsible for ensuring that the mining operations
comply with the law. SAEMAPE, on the other hand, provides technical support,
training, and guidance to miners during mining operations; oversees safety, hy-
giene, and environmental practices at the site; and ensures miners belong to a
mining cooperative. SAEMAPE also collects production statistics and is respon-
sible for the traceability protocol at 3T mines. Both agencies serve on a joint
validation team that confirms the absence of armed actors at mining sites and
other risks outlined in the OECD’s Due Diligence Guidance.11 Only minerals from 11
Validation teams also include representa-
validated (“green”) sites can be certified for export. tives of the provincial government, interna-
tional organizations in charge of the certifi-
The Mining Division and SAEMAPE have the sole authority to collect taxes on cation of minerals and of traceability, local
mining activities. The Mining Division levies taxes or fees for miner cards, iden- civil society organizations, and United Nations
agencies.
tification forms, and the use of certain equipment (e.g., motor pumps, washing
infrastructure, etc.), or dynamite. SAEMAPE collects taxes and fees related to
mineral production, identification forms, and registration forms.
2.2 Due Diligence Programming
DDP entails ongoing monitoring of mineral production and processing to ensure
that suppliers respect human rights and avoid contributing to conflict (OECD,
2016, p. 13).
Some minerals used in the manufacture of consumer goods (e.g., smartphon-
es) originate from regions with limited state capacity and a history or high-risk of
conflict, such as the eastern DRC. DDP arose from concerns that, in sourcing min-
erals from these areas, downstream companies could (unwittingly) contribute to
financing human rights abuses or armed conflict. Under DDP, upstream produc-EVALUATING DDP FOR CONFLICT MINERALS 11
ers (from mines to smelters) must have procedures to control and disclose risks
associated with the production and transport of minerals. Downstream compa-
nies, for their part, must assess these suppliers’ due diligence efforts and base
sourcing decisions on risks they disclose or that have been independently iden-
tified.
DDP is required of all US-listed companies that source 3T metals and gold
from the DRC and adjoining countries per Section 1502 of the 2010 Dodd-Frank
Act. Similar legislation from the European Union requiring all importers of these
minerals from “conflict-affected and high-risk areas” to undertake DDP takes ef-
fect in January 2021. These regulations all draw on guidelines promulgated in
2011 by the OECD.12 The OECD framework has become the industry standard, and 12
China published voluntary standards in 2015
the specific risks it flags in Annex II guide on-the-ground monitoring efforts. based on the OECD guidelines.
Over the years, a number of organizations have implemented DDP in gold and
3T artisanal mines sites in eastern DRC. Most notable are initiatives from the
Federal Institute for Geosciences and Natural Resources (BGR), IMPACT, Tetra
Tech, and the RCS Better Sourcing Program.13 The International Tin Supply Chain 13
BGR, Impact, and Tetra Tech cover gold; IM-
Initiative (ITSCI) represents the largest program for 3T mines in eastern DRC. For PACT and Tetra Tech ceased operations in
eastern DRC.
this reason, and to limit variability in the program we evaluate, the DDP sites in
our evaluation fall under ITSCI’s program. Future research might compare the
efficacy of different approaches to due diligence; however, such a comparison
is not feasible in our study area. Whereas future lines of research might attempt
to compare and contrast the efficacy of different types of DDP, sufficient data
currently does not exist to compare DDPs via quantitative research methods.
ITSCI grew out of an International Tin Association (ITA) working group es-
tablished in 2008 and a small pilot in the eastern DRC in 2010.14 ITSCI com- 14
Information regarding ITSCI’s history and
menced full-scale operations in 2011 in Katanga, expanded to South Kivu and programming was assembled from multiple
primary and secondary sources, including
Maniema in 2012, and extended coverage to parts of North Kivu in 2014. As of ITSCI (2011), Levin Sources (2015), ITSCI
2020, ITSCI covered 2,306 mines across the DRC, Burundi, Rwanda, and Uganda (2016), and ITSCI (2020).
(ITSCI, 2020).15 ITSCI’s protocol involves several steps. First, at a provincial 15
ITSCI members are active in 46 countries,
level, ITSCI and state mining agents plan implementation for each province.16 and the Secretariat is based in the UK.
16
ITSCI implements its on-the-ground activi-
Even in provinces where it establishes programming, ITSCI cannot immediately ties through PACT, an international non-profit
cover all potentially eligible mines; rather, as funding permits, it incrementally organization.
scales up, extending coverage to new mining areas based on consultations with
local authorities and available information and field resources. Second, individ-
ual 3T mines are assessed for eligibility. ITSCI conducts a baseline report at each
eligible mine to check that the mine does not present Annex II risks and complies
with local mining regulations. Third, after approval by ITSCI’s Governance Com-
mittee, ITSCI initiates their chain-of-custody system (sometimes colloquially re-
ferred to as “bagging and tagging”) to designate minerals as originating from a
participating site. While ITSCI provides tags and initial training, SAEMAPE over-
sees bagging and tagging at the mining sites.17 These state mining agents also 17
The Mining Division and Center of Experts,
collect taxes from artisanal miners and are mandated to provide services (e.g., Assessment and Certification of Precious and
Semi-Precious Minerals (CEEC) are responsi-
technical and administrative support, formalization) that are not directly tied to ble for the tracing system at the exporter
ITSCI’s programming. ITSCI consolidates and verifies the production data. Fi- stage.EVALUATING DDP FOR CONFLICT MINERALS 12
nally, according to ITSCI, it conducts ongoing monitoring, spot checks of partic-
ipating mines, and manages an incident reporting and resolution system for in-
cidents related to Annex II and other risks. ITSCI describes verifying and helping
to resolve reported incidents in consultation with local authorities and commit-
tees.18 18
We focus on aspects of ITSCI’s protocol that
ITSCI acknowledges implementation challenges that result in deviations from directly affect mining communities in the east-
ern DRC. See here, for a more comprehensive
this protocol. In particular, mines that do not participate in ITSCI use tags from description of ITSCI’s programming, including
other proximate and participating mines (Levin Sources, 2015, p. 88). This leads their evaluation of companies, auditing, the
chain-of-custody system, and stakeholder en-
to the mixing of minerals that are and are not produced under ITSCI’s DDP, risking gagement.
supply chain contamination.19 We document similar behavior in the mine-site 19
The improper use of tags (including fraud) is
surveys discussed below. among the incidents that ITSCI reports track-
ing through its incident management systems
(see here).
2.3 Existing Research on DDP
Debate continues over the impacts of DDP on conflict and economic develop-
ment in eastern DRC. The existing academic research raises concerns about the
unintended consequences of policies meant to better monitor mineral production
in the region. Parker et al. (2016) find, for example, that armed conflict actually
increased in the mining regions of the eastern DRC affected by the 2010 Dodd-
Frank Act, relative to conflict in unaffected areas. Stoop et al. (2018) corroborate
this finding over a longer study period: Parker et al. (2016) use data through 2012;
Stoop et al. (2018) extend the data through 2015. Parker and Vadheim (2017) also
find that infant mortality — a leading indicator of human development — wors-
ened in mining areas where production was impacted by Dodd-Frank’s “conflict
minerals” provisions.
While carefully executed, these studies do not isolate the impact of DDP.
Following the passage of the Dodd-Frank Act, the Congolese Government an-
nounced a ban on mining activity in three provinces: North Kivu, South Kivu, and
Maniema. While this ban was lifted in March 2011, it was immediately followed
by a boycott of minerals from the region. At that time, companies had limited
ability to monitor production and, therefore, simply stopped sourcing from east-
ern DRC to avoid violating the provisions in Dodd-Frank. The changes the existing
research document thus cannot be cleanly attributed to the rollout of DDP; rather
— and this is something these authors clearly note — their results are driven by
a multi-year suspension of legal mining and export activities in provinces that
heavily depend on the mining sector. As noted above, ITSCI’s programming for
3T mines only started in Maniema and South Kivu in 2012; it did not expand to
North Kivu until 2014.
Our goal is to isolate the causal effects of DDP, rather than the bundle of policy
changes and de facto industry boycott that immediately followed the Dodd-Frank
Act’s passage. Less empirical work has been done on this topic. A 2019 report
from IPIS and Ulula identifies factors that correlate with DDP in eastern DRC, in-
cluding an increase in state presence (IPIS/Ulula, 2019). However, it could not
draw stronger conclusions about DDP’s impacts, as DDP and non-DDP mines inEVALUATING DDP FOR CONFLICT MINERALS 13
the sample differed along a number of other dimensions (e.g., non-DDP mines
tended to produce gold; DDP mines produce 3T). We advance research in this
field by restricting attention to DDP and non-DDP mines that are otherwise sim-
ilar in terms of mine characteristics we can measure — comparisons where we
feel more confident that differences in outcomes can be attributed to DDP. It re-
mains possible that DDP and non-DDP mines differ in ways that we were unable
to measure, which could bias our estimates.
3 Hypotheses
What effects do we expect DDP to have on security and economic development
in mining areas?
DDP monitors mines and verifies that production meets minimum standards.
This enables buyers (e.g., smelters and companies producing end products) to
identify minerals originating from conflict affected and high-risk areas, such as
the eastern DRC. These buyers can limit purchases to minerals produced at com-
pliant DDP mines, thereby reducing demand for minerals produced at non-compli-
ant or unverified — and, thus, potentially sub-standard — mines.
OECD (2016) provides an authoritative set of standards for due diligence arou-
nd mineral production in conflict affected and high-risk areas (OECD 2016, see
Annex II). Based on these standards, DDP mitigates the risks that mineral pro-
duction (1) provides support to non-state armed groups or illegitimate security
forces;20 (2) evades legitimate taxes and fees; (3) pays bribes or misrepresents 20
Annex II, paragraph 5 identifies a set of il-
the origins of minerals; or (4) entails serious abuses (e.g., human rights viola- legal activities that should not be undertaken
by public or private security forces; paragraph
tions). 6 notes that these forces’ sole responsibil-
Effective implementation of DDP should then have the following impacts: ity should be to maintain order and prevent
abuse. We regard security forces as “illegiti-
mate” when their activities violate these crite-
1. Reduce taxation by non-state armed groups and illegitimate security forces; ria
2. Increase the payment of legitimate state taxes;
3. Reduce the payment of bribes; and
4. Reduce the serious abuses, including forced labor and the worst forms of
child labor.
To assess whether these hypothesized effects actually occur, we evaluate
outcomes related to each of these hypotheses.21 21
Annex II provides a more detailed enumer-
DDP could also have knock-on effects, positive or negative, on the economic ation of these standards, which also include
prohibitions on money laundering. Our evalua-
well-being of miners and their communities. First, DDP could shift demand to tion does not look at possible impacts related
verified mines, increasing prices or production volumes at those sites relative to to mitigating money laundering risks.
unverified sites. However, it is not assured that any resulting price increases will
be captured by miners; some recent work suggests that DDP may depress the
bargaining power of miners.22 Second, DDP could reduce the size and volatil- 22
Multiple studies suggest that DDP raises the
ity of miners’ tax payments by limiting extortion by armed groups or illegitimate bargaining power of traders and depresses the
prices paid to participating miners (Freuden-
security forces. This, of course, requires that any increase in taxation by state thal, 2017; Vogel et al., 2017).EVALUATING DDP FOR CONFLICT MINERALS 14
agents that accompanies DDP does not increase miners’ overall tax burden.23 23
Although DDP does not directly impose
Reducing interference by armed actors could have longer-run benefits for eco- taxes on the miners, if it increases monitoring
by state agents, it could indirectly increase the
nomic development, but only if it reduces insecurity, bolsters property rights, and collection of taxes and fees. Research from
thereby promotes private investment. We evaluate outcomes related to house- Vogel et al. (2017) describes strategies devel-
oped by dealers (négociants) to evade these
holds’ economic well-being, as well as several intermediate outcomes related to tax efforts.
production and employment, to assess the net effects of DDP.
To the extent that DDP affects the organization and oversight of an important
economic sector, it likely has broader (potentially unintended) consequences for
miners and mining communities. To provide a more complete picture, we explore
several additional outcomes in our analysis, including whether DDP is associated
with differences in how households perceive the mining sector’s effects on the
local environment, economy, and public safety, as well as the frequency of (fatal)
injuries due to accidents at mine sites.
4 Sampling and Data Collection
4.1 Site Selection
We restrict attention to 3T mines in Maniema and South Kivu.24 Between 2015-19, 24
The Ebola crisis and/or conflict in North
IPIS compiled data (including coordinates) for 349 3T mines in these provinces. Kivu and Ituri prevented surveying in these
provinces.
We did not randomly sample from these 349 mines; rather, since our goal is to
estimate the effects of DDP, we strategically selected our sample. We chose the
104 mines that maximized the properties (e.g., statistical power) of our empirical
strategy (see Figure 1). On its own, this approach to site selection helped to mit-
igate the differences between DDP and non-DDP areas.25 It excluded mines that 25
Table 10 shows a high degree of initial imbal-
we assessed ex-ante were non-comparable and unlikely to match counterparts ance between DDP and control clusters when
we use the full sample of 349 mines.
in the opposing group.
We confronted an unanticipated challenge prior to data collection: many more
mines started participating in DDP. A large expansion of DDP, particularly within
Maniema, severely restricted the number of potential control mines. Our final
sample, thus contains more than twice as many DDP mines (73) than control
mines (31). This is a limitation of our study; future research would benefit from
historical, time-series data on the rollout of DDP and/or opportunities to build
impact evaluation into new scale-up efforts.
IPIS identified 71 villages proximate to the 104 mines selected for our study.
Many individuals working in the sampled mines live in these 71 “support” vil-
lages. These are also the communities that most immediately feel the knock-on
effects — good and bad — of activity in these mines. In each of these 71 com-
munities, we conducted 30 surveys: 15 households were randomly sampled, and
we interviewed each household’s head; within each of these households, we also
randomly selected one adult for surveying. This two-step procedure generates
representative samples of household heads and adults within these villages.EVALUATING DDP FOR CONFLICT MINERALS 15
Control Mine Sites DDP Mine Sites
0°
1°S
2°S
3°S
4°S
5°S
25°E 26°E 27°E 28°E 29°E 25°E 26°E 27°E 28°E 29°E
Figure 1: Location of Sampled Mines in South
Kivu (Gold) and Maniema (Teal)
4.2 Survey Enumeration
IPIS led data collection, recruiting and training the enumeration team. IPIS se-
lected enumerators based on their education and past experience with the ASM
sector or survey efforts. The final team included 17 enumerators (14 men, 3
women); 10 had previously worked with IPIS on ASM in South Kivu and Maniema.
Enumerators participated in a week-long training in Bukavu, South Kivu, orga-
nized by IPIS and Sub-Saharan Field Research and Consulting (SFR). Enumera-
tors learned random walk protocols, interviewing techniques, safety protocols,
questionnaire design, and the use of surveying devices (Open Data Kit (ODK) on
smartphones and InReach satellite communicators).
Five survey teams (composed of 3–4 enumerators) deployed to the 71 sam-
pled villages and 104 mines. From October 30 to December 28, 2019, these teams
completed two missions (20–27 days each), surveying 1,054 households, 1,000
individuals, and 104 mine sites (see Table 1).
Enumerators followed strict safety procedures to minimize risks during data
collection. The IPIS focal point in Bukavu supervised teams, tracking their move-
ments through the InReach satellite communicator and each day requiring multi-
ple status updates from every team. Enumeration teams assessed local security
before entering a new mining zone by contacting local authorities, civil society
representatives, and/or state mining officials. If given permission to survey, enu-
merators teams presented their mission order to the relevant authorities before
beginning data collection. An incident report was prepared for all mining areas
deemed too risky to survey.EVALUATING DDP FOR CONFLICT MINERALS 16
Table 1: Completed Surveys
Province Control DDP Total
Households
Maniema 179 362 541
South Kivu 139 374 513
Total 318 736 1054
Individuals
Maniema 179 357 536
South Kivu 129 335 464
Total 308 692 1000
Mine Sites
Maniema 14 32 46
South Kivu 17 41 58
Total 31 73 104
To ensure respondents’ safety, enumerators clearly informed them about the
purpose of the survey and study. They also explained to interviewees that par-
ticipation would be anonymous (that their names would not be registered) and
voluntary, sought informed consent, and let the respondent know that they could
stop the interview and withdraw their consent at any time.
4.3 Mine-site Surveys
Two enumerators identified key informants and conducted interviews at the mine
site and the closest village to the mine.26 At mine sites, enumerators spoke with 26
If a risk assessment deemed the mine sites
miners, mine and pit managers, representatives of cooperatives, and/or traders. too dangerous to visit, key informant surveys
took place in a nearby village or trading center.
In the villages, they spoke with local authorities, civil society actors, state agents,
traders, and/or mine managers. Each enumerator interviewed at least two key in-
formants. The enumerators then met to discuss and compare their findings. (If
they could not reconcile the information they independently gathered on a spe-
cific topic, they conducted additional interviews on that topic). They then col-
laboratively completed the survey questionnaire, generating a single survey for
each mine site. For larger mines, enumerators spent around one day conducting
interviews, whereas a half day of surveying sufficed for smaller sites (with less
than 10 miners).
4.4 Household and Individual Surveys
To select households for interviews, enumerators followed a random walk pro-
tocol in each sampled village. Enumerators sketched a map of the village, di-
vided it into quarters, and randomly selected two quarters to survey. Heading out
from the center of the village towards one of the selected quarters, enumerators
counted houses on the left-hand side of the path and would select a household
to survey based on the day of the month. On the sixth or fifteenth days of theEVALUATING DDP FOR CONFLICT MINERALS 17
month, for example, enumerators counted six houses and surveyed the seventh,
from that point onward they would survey every fifth household.
Enumerators interviewed the head of household or, if unavailable, their spouse.
Household surveys lasted 30–45 minutes on average. However, if no consenting
adults were available to be surveyed (less than 2% of cases), a new household
was selected following the random walk protocol. Once the household survey
was completed, the survey software randomly selected another adult member of
the household to interview. This person would then be asked to provide informed
consent and complete an individual survey, typically lasting 10–30 minutes. If no
adult members of the household could complete the individual survey, another
household would be selected via the random walk. Respondents received no
compensation for completing a survey.
The random walk and subsequent random sampling of adults within surveyed
households produced samples that are representative at the village-level. This
constitutes an improvement over past work that relied on convenience samples
from mobile phone surveys, which likely over-represent the views of certain types
of respondents (e.g., mobile phone owners).27 27
In complementary work, Ulula is conducting
a mobile survey of these households. That ef-
As implied by this protocol, we did not intentionally over-sample households
fort aims to characterize non-response bias in
at risk of child or forced labor, and the goal of this study is not to estimate the mobile surveys and potentially better measure
exact prevalence of forced or child labor. As we note above, we do not directly some sensitive or fast-changing outcomes.
We note that 42% of household heads report
measure some dimensions of forced labor (e.g., debt bondage); we rely instead owning a mobile phone. We estimate that 23%
on respondents’ appraisal of whether work has been forced. It is also possi- of all adults own a phone, ranging from 0–53%
ble that child labor is also under-reported, as we do not directly survey children. across villages.
Moreover, some informants at mine sites may be reticent to disclose child labor,
despite enumerators’ efforts to triangulate this information.
5 Sample Characteristics
Before launching into our matching analysis, we provide a brief quantitative sum-
mary of our sample of mine sites, households, and individuals. We include ad-
ditional details in our appendix. Unless otherwise noted, the sample character-
istics we present in this section refer to both DDP and non-DDP sites. We defer
comparisons to DDP and non-DDP sites until after we have introduced and im-
plemented our matching algorithm.
5.1 Mine Sites
As shown in Table 1, our sample includes 104 3T mines: 58 in South Kivu and
46 in Maniema; 73 covered by DDP and 31 not.28 Four mines (all in South Kivu) 28
In South Kivu, we sampled mines from the
were not active when enumerators visited.29 Of the 104 mines, 9% were in a territories of Shabunda (71%), Walungu (21%),
Mwenga (7%) and Kabare (2%); in Maniema,
preparatory phase, 55% were partial production capacity, and 37% were at full from Pangi (74%) and Punia (26%).
production capacity. 29
Two mines were temporarily closed due to
financial and security issues, and two mines
were abandoned.EVALUATING DDP FOR CONFLICT MINERALS 18
MINERAL PRODUCTION
Nearly all mines (95%) produce cassiterite. A majority exclusively produce
cassiterite (74 sites), while a smaller share also produce other minerals, includ-
ing gold (7 sites), wolframite (6 sites), and coltan (18 sites). These mines employ
different techniques: open-pit alluvial mining (66 sites); open-pit eluvial mining
(48 sites); and shaft mining (36 sites).30 (These percentages do not sum to 30
Alluvial mining targets sediments trans-
100%, because sites often combine techniques.) Although regulations forbid pits ported by flowing water and deposited near
rivers, eluvial mining targets secondary placer
deeper than 30 meters, 3 sites violated this provision. Most mines rely on mini- deposits on hillsides, and shaft mining in-
mal mechanization, using pickaxes and shovels. 32% of mines display moderate volves underground mining.
or high levels of mechanization, employing jackhammers; motorized pumps; or,
at the highest end of the scale, crushers and ventilation systems.
EMPLOYMENT AND COMPENSATION
Mines employ more workers in Maniema than South Kivu: on average, 117
workers in Maniema (median: 90) and 72 in South Kivu (median: 34.5). Infor-
mants in 79% of mines report that employment levels fell in the last year. In
Maniema, this could relate to the Government’s suspension of ASM in under-
ground mines after a fatal accident; no acute cause was noted in South Kivu,
though metal prices (especially for tantalum) were relatively low.
From our sample of 104 mines, managers pay miners in minerals (53 sites),
cash (35 sites), or a mix of minerals and cash (16 sites). This differs across the
provinces. In South Kivu, miners tend to be paid in minerals only (86% of sites),
whereas in Maniema a majority of sites (65%) pay workers in cash (see Table 8
for a more detailed breakdown).31 31
We did not randomly sample mines, so these
cross-province comparisons are only sugges-
Maniema
tive.
15
10
Number of Mines
5
0
South Kivu
15
10
5
0
0 100 200 300 400 500
Number of Workers
Figure 2: Number of WorkersEVALUATING DDP FOR CONFLICT MINERALS 19
WOMEN IN ASM
Women play an essential role in the ASM sector, by both mining and selling
services to the mine and miners. We record 1,891 women at mine sites across 69
sites. We observe sharp differences in women’s participation across provinces:
women participate at 45% of mines in South Kivu and 93% of mines in Maniema.
Where they are employed in mining-related jobs, women serve as diggers and per-
form less-remunerated support work, such as washing, treating tailings, trans-
port, and crushing minerals. At most active mines, women sell goods including
food (68 sites), and other consumable goods (38 sites). They also provide ser-
vices to the mines and miners, such as running a restaurant (55 sites), and sex
work (50 sites).
CHILDREN IN ASM
The 2009 Congolese Law on Child Protection prohibits employment of chil-
dren under 16 and the worst forms of child labor, including hazardous work “that
by its nature or the conditions in which it is carried out, is likely to harm the health,
safety, dignity and morals of the children.”
Informants reported 363 children below the age of 16 at 30 active mines, in-
cluding both DDP and non-DDP mines.32 (We analyze DDP’s effects on child labor 32
ITSCI, through its implementing partner
below.) They participate in digging (26 sites), washing (27 sites), treating tailings PACT, reports mitigation and remediation ac-
tivities related to child labor. They describe
(20 sites), transport (7 sites), and crushing (1 site). Children do not attend school awareness-raising campaigns among miners
at all in 14 sites; they combine work and school at 16 sites. and key stakeholders to explain the regula-
tions and harms related to child labor. If child
labor is detected at a mine participating in DDP,
ARMED ACTORS’ PRESENCE AND INTERFERENCE PACT reports that they complete an incident
We detect non-state and, to a greater extent, state armed actors at mine sites. report, refer the matter to state agents, and
conduct additional awareness-raising around
In South Kivu, informants reported interference by the Non-state Armed Group the offending site.
(NSAG) Raia Mutomboki (Raia, for short) at 5 sites and the Mai Mai Malaika
Militia at 2 sites.33 34 While Raia did not maintain a permanent presence at these 33
Raia Mutomboki is a local self-defense mili-
sites, the group levied taxes, pillaged (3 sites), and perpetrated sexual violence tia, created to defend villages in Shabunda ter-
ritory against attacks of other armed groups,
(2 sites). 35 Raia interference was observed at a non-DDP and DDP sites. The particularly the Democratic Forces for the Lib-
Mai Mai Militia erected roadblocks to tax mineral production and transport. eration of Rwanda (FDLR).
34
The Mai Mai Malaika is an armed group that
Informants in 21 sites report the presence of the Congolese Army (Forces ar-
initially organized to oppose the Banro Corpo-
mées de la république démocratique du Congo or FARDC) over the last six months. ration, a Canadian mining company. In 2017,
This includes both DDP and non-DDP sites; we analyze differences between DDP they joined a coalition of Mai Mai movements
in eastern DRC called National Coalition of the
and non-DDP mines in terms of FARDC presence below. In 11 of these sites, infor- People for the Sovereignty of Congo (CNPSC),
mants noted at least monthly visits from the FARDC; in 10 sites, their presence and operate in the border area between the
provinces of Maniema and South Kivu (Congo
was less frequent. The FARDC interfered in 17 of these sites, most often engag-
Research Group, 2019).
ing in illegal taxation (14 sites) and, more rarely, coercing forced labor (3 sites) 35
To avoid confrontations with the Mining Po-
or assuming ownership of a pit (1 site).36 lice at the mine site, Raia Mutumboki mem-
bers sometimes wait until mine managers are
Matthysen et al. (2019, p. 53) note that armed criminal networks continue
off site to demand payments. Informants re-
to interfere with ASM and that “the main armed faction within these criminal ported this happening with two mine man-
networks are often Congolese army units.” However, the FARDC has also been agers in Walungu territory.
36
These instances of forced labor and pit own-
deployed in eastern DRC to neutralize non-state armed groups and provide stabil-
ership were recorded at mines covered by DDP.
ity. In 2017 and 2018, for example, the FARDC fought Raia in northern ShabundaEVALUATING DDP FOR CONFLICT MINERALS 20
(South Kivu). After this offensive, FARDC units remained in the territory. For this
reason, some feel that the FARDC enhances local security. Anecdotally, FARDC
soldiers in South Kivu (Mwenga territory) provided on-demand security for min-
ers in return for a fee (Matthysen et al. 2019: p. 51).
STATE AGENTS’ PRESENCE AND PERFORMANCE
Informants recorded the presence of the Mining Division and SAEMAPE over
the six months prior to data collection in 81 and 88 active sites, respectively. The
Mining Division visits 15 active sites at least weekly and 42 at least monthly; other
sites were visited less frequently. SAEMAPE maintains a more regular presence,
visiting 27 active sites at least weekly and 47 at least monthly. Yet, SAEMAPE
agents were still not present or only occasionally visited more than half of active
sites. Only 18 sites receive support from the Mining Division; 32 of active sites
receive technical support from SAEMAPE.
The Mining Division collects taxes at 55 sites, in addition to collecting data on
production; supporting miners; and, in 6 sites, informants reported agents from
the Mining Division exploiting their own mining pits. SAEMAPE levies taxes in 76
sites, while also collecting data on production; providing support to miners; and,
in 8 sites, informants reported SAEMAPE agents exploiting their own mining pits.
With both entities collecting taxes, we document reports of double taxation —
miners charged twice for the same document or service. Informants also report
being charged for taxes that have no basis in law (e.g., an “arbitrary tax”, a “tax
on declaration of the pit”).
As noted above, the Mining Division and SAEMAPE have the sole authority to
levy taxes at mines. However, informants reported 9 other government agencies
levying taxes across 29 active mines in the six months prior to data collection.37 37
The 9 additional agencies collecting taxes
are: Agence National de Renseignements,
Comité National de Protection des Rayon-
5.2 Households nements Ionisants, Direction Générale des Re-
cettes du Maniema, Direction Générale des Im-
pôts, Police des Mines, Direction de la Pharma-
We conducted in-person surveys with household heads in 71 villages; in total, we cie et du Médicament, Direction Générale des
surveyed 1,054 households (see Table 1). Recettes Administratives Domaniales, and the
administrative entities chefferie and secteur.
Most households (83%) comprise a single family; only 17% include unrelated
people living in the same house (e.g., migrant workers). The average household
includes 3.4 members (median: 3). Households heads are predominantly (87%)
male and have an average age of 42. The vast majority (88%) have lived in the
village for their entire life; only 3% have resided in the village less than one year.
While 16% report no formal education, 29% attended primary school; 49%, sec-
ondary school; and 6% have some tertiary education. Nearly all (95%) heads of
household are employed. Figure 3 provides counts of household heads work-
ing in mining and non-mining occupations.38 39% report mining as their primary 38
Respondents can indicate multiple jobs per-
source of income. The next largest sector is agriculture: 38% of household heads formed at the mine site. The sum across cate-
gories can, thus, exceed the number of respon-
work in farming. dents.
To better understand how ASM affects communities, we asked household
heads to assess the effect that ASM has on the quality of air and water, health,EVALUATING DDP FOR CONFLICT MINERALS 21
Mining
Miner 337
Preparator 66
Manager 38
Other 32
Transport 21
Buyer 19
Authority 19
Cooperative 13
Non−Mining
Farm 409
Education 64
Other 37
Religion 30
Business 24
Health 20
Food 7
0 100 200 300 400
Number of Household Heads
Figure 3: Occupations of Household Heads
food prices, local jobs and businesses, safety and security, and relations be-
tween people (cohesion), as well as its overall effect. We employ a five-point
likert scale that varied from “Very Negative” to “Very Positive.” We summarize
these responses in Figure 4: 59% express that mining, in general, has a positive
overall impact on their lives in their villages; 19% felt the overall impact was neg-
ative. A majority feel that ASM has a positive effect on many facets of village
life, including jobs and businesses (64%) and public safety (72%).39 The only 39
Households that negatively perceive ASM’s
exception is the environment: 55% feel that ASM has a negative or neutral effect effects on safety are more likely to report at-
tacks by NSAGs, extortion attempts by NSAGs,
on the quality of water. and clashes between NSAGs and the FARDC
(see Figure 9).
100%
13%
19% 23% 21% 19%
30%
40% 15%
75% 11%
22% 15%
20%
18%
15% Negative
50%
Neutral
Positive
25% 59% 45% 52% 57% 64% 70% 72%
0%
ral ality alth s
Price conomy ohesion ty
Gene r Qu He Safe
Wate Food E C
Mining's perceived effect on ...
Figure 4: Perceptions of Household HeadsYou can also read