Empirical Validation using ETNA Data - Energy.gov
←
→
Page content transcription
If your browser does not render page correctly, please read the page content below

Empirical Validation using ETNA Data

               Argonne National Laboratory, J. Neymark & Associates, Thermal Energy System Specialists
               Dr. Ralph T. Muehleisen, Chief Building Scientist, Argonne
               Tel: 630-252-2547, email: rmuehleisen@anl.gov

U.S. DEPARTMENT OF ENERGY   OFFICE OF ENERGY EFFICIENCY & RENEWABLE ENERGY                               1
Project Summary
              Timeline:                                                      Key Partners:
              Start date: 10/1/2019
                                                                             J. Neymark & Associates
              Planned end date: 9/30/2022
                                                                             Thermal Energy System Specialists
              Key Milestones (insert 2-3 key milestones and dates)
              1. First Steady State Data Analyzed; 7/2020
              2. First Artificial Climate Data Analyzed; 10/2021
              3. First Natural Climate Data Analyzed, 1/2022

              Budget:
                                                                             Project Outcome:
              Total Project $ to Date:                                       This project will analyze data from the most
              • DOE: $500k                                                   detailed and controlled building thermal fabric
              • Cost Share: $0                                               energy transfer experiments done at the ETNA
                                                                             Facility in France in 2000-2001.
                                                                             The analyzed data will be used to generate a suite
              Total Project $:                                               of empirical validation tests and ASHRAE 140
              • DOE: $996k                                                   format test specifications ready for field trials and
              • Cost Share: $0                                               adoption by ASHRAE SSPC 140

U.S. DEPARTMENT OF ENERGY   OFFICE OF ENERGY EFFICIENCY & RENEWABLE ENERGY                                                           2
Team

      Dr. R. Muehleisen, ANL, PI                     J. Neymark, JNA, Co-I         Dr. J. Kim, ANL          T. McDowell, TESS

     ANL Chief Building Scientist                       ETNA Research PI        ANL Building Scientist     TRNSYS Developer
         Expert in Uncertainty &                          (1999-2004)           Expert in EnergyPlus,     Building Science Expert
           Building Science                            BESTEST Developer        IESVE & Uncertainty      SSPC 140 Vice Chair and
         SSPC 140 NV Member                               SSPC 140 Chair       SSPC 140 NV Member                 VM
        PI for ASHRAE 140/205                        On ASHRAE 140/205          On ASHRAE 140/205          On ASHRAE 140/205
         Maintenance Project                       Maintenance Project Team   Maintenance Project Team   Maintenance Project Team

                        Unparalleled Expertise: ETNA, Validation, ASHRAE 140, and Statistics

U.S. DEPARTMENT OF ENERGY   OFFICE OF ENERGY EFFICIENCY & RENEWABLE ENERGY                                                          3
Challenge
      ASHRAE 140 Method of Test for Evaluating Building Performance Simulation Software is the
      standard for testing accuracy of software that models building physics.
      • Referenced by ASHRAE 90.1, IECC, 179D Tax Code, CEC Title 24

      But, ASHRAE 140 only has very simple tests with analytic solutions as ground truth. All more
      complicated tests are comparative (i.e. software to software). When software differ, who is right?

                                                                             Empirical Validation can provide
                                                                             ground truth so we *know* which
                                                                             software is right

U.S. DEPARTMENT OF ENERGY   OFFICE OF ENERGY EFFICIENCY & RENEWABLE ENERGY                                      4
Challenge
      Development of Empirical Validation tests of even a simple building is very, very,
      very, hard for many reasons including:

      • Construction requires supports (studs, beams, columns, etc) that create 2/3D
        heat transfer, however, whole building software is ALL 1-D approximation
      • Buildings are NEVER constructed as drawn/designed; rarely are drawings
        updated to “As Built”
      • Eliminating all heat leak paths (thermal bridges, infiltration) is impossible and
        characterizing them is near impossible
      • Measurement of surface phenomenon (boundary layers) is really, really hard in
        a real building
      • Thermal/physical properties of all construction materials have high uncertainty

      As a result, most previous attempts at empirical validation have failed.

U.S. DEPARTMENT OF ENERGY   OFFICE OF ENERGY EFFICIENCY & RENEWABLE ENERGY                  5
Approach
      •    From 1999-2001 US and EdF (France) researchers conducted a set of
           experiments on the EdF ETNA facility specifically designed for development
           of an empirical validation data set
             – The ETNA experiments are considered the most complete, accurate, and
               controlled experiments of building thermal fabric physics ever made.
             – Researchers were able to repeat/extend experiments when data glitches arose

      •    EdF shifted funding after completion of experiments and so the data were
           never fully analyzed and turned into an empirical validation test set
             – BTO funding of empirical validation work is allowing these incredible data to be
               utilized

      •    The Argonne project team includes the original PI of the EdF project (J.
           Neymark) who led the experiments, supervised the data acquisition, and is
           the “keeper” of the data
             – Another of the original researchers, R. Judkoff, is on the project Technical
               Advisory Group (TAG)

U.S. DEPARTMENT OF ENERGY   OFFICE OF ENERGY EFFICIENCY & RENEWABLE ENERGY                        6
Approach

      • Why ETNA is different, and why this project will succeed:
             – Side-by-side, twin test cells
             – Thermally guarded on all six sizes to allow calorimetric
               measurements
             – Individual temperature control on all six sides to allow for
               “artificial” climate tests
             – One guard removable to allow for natural climate tests
             – Specially designed heating source is nearly totally convective
             – Design of enclosure reduces thermal bridges allowing better
               characterization of 2D/3D heat transfer
             – Researchers were allowed enough time for cells to reach steady
               state for each test
             – Test procedure designed to follow BESTEST methodology

U.S. DEPARTMENT OF ENERGY   OFFICE OF ENERGY EFFICIENCY & RENEWABLE ENERGY      7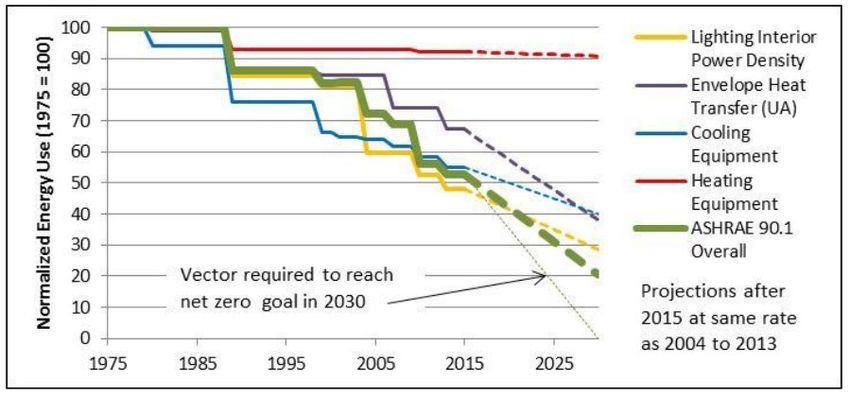
Approach

                                                                                                                     Complete Spec
                                               Steady State                  Artificial Climate   Natural Climate
                                                                                                                     and Submit to
             Data Review                       Calorimetric                   (Dynamic but          (South Wall
                                                                                                                    ASHRAE 140 for
                                                 Analysis                     fully guarded)      Guard Removed)
                                                                                                                    review and Trials

      • Because there is no access to the facility or to do no experiments, careful
        analysis of data and quantification of uncertainty is key
             – With respect to the data “When in doubt, throw it out”
             – Using multiple analysis methods to ensure data consistency and as a double check
             – Using two different software (EnergyPlus and TRNSYS) to check spec for interpretability
               and ability to model measured physics

U.S. DEPARTMENT OF ENERGY   OFFICE OF ENERGY EFFICIENCY & RENEWABLE ENERGY                                                              8
Impact

      ETNA (and other EV&U) will play a key role in
      expanding the use of simulation in design and
      code compliance which will
      • Increase decarbonization
      • Increase resilience                                                  Modeling   Modeling
      It does this by increasing the confidence in                           Software   Software
      simulation by                                                           Today     Tomorrow
      • Ensuring physics modeling is correct
      • Identifying bad software
      This allows for
      • More stringent energy codes
      • More compliant designs

U.S. DEPARTMENT OF ENERGY   OFFICE OF ENERGY EFFICIENCY & RENEWABLE ENERGY                         9
Impact

      ETNA does not replace the other DOE
      funded EV&U projects
      • ETNA is focused on thermal fabric
      • Heating only (no cooling conditions)
      • Single Zone
      This project essentially provides empirical
      testing to augment the 600/900 series
      thermal fabric comparative tests in
      ASHRAE 140
      • The other EV&U will provide validation
         for other or new test suites
      ETNA’s data quality and low uncertainty will
      provide the benchmark for all EV&U
      projects and allow the test suites from
      those projects to focus physics not tested
      by ETNA

U.S. DEPARTMENT OF ENERGY   OFFICE OF ENERGY EFFICIENCY & RENEWABLE ENERGY   10
Progress
• Original data, notes, and preliminary spec, retrieved from old
computers and converted to modern formats (Excel, Word, PPT,
JPGs) for analysis
• Steady State Baseline Case Selected, Data Analyzed, and Spec
Developed
• Tested spec with models in EnergyPlus and TRNSYS
– Soon to start checking with IESVE
• Started calculating 2/3D effects to see how much they explain the
difference between measured data and:
– 1D models using “listed” material properties
– 1D models using empirically determined 1-D equivalent material
properties
U.S. DEPARTMENT OF ENERGY OFFICE OF ENERGY EFFICIENCY & RENEWABLE ENERGY 11Steady State Base Case Results
• Meas. Uncertainty:
< 0.5% standard error
• Model vs Measured Diff (with empirical
1-D equivalent material properties):
< 0.3% for EnergyPlus and TRNSYS
Two software, with independent models and
Last 18 hrs are best modelers, have matched model to
steady state and are measurement within small uncertainties!
used in the test suite
• This is incredibly low uncertainty - the ETNA
data and its spec are looking good and reliable!
U.S. DEPARTMENT OF ENERGY OFFICE OF ENERGY EFFICIENCY & RENEWABLE ENERGY 12Steady State Base Case Results
• Meas. Uncertainty:
< 0.5% standard error
What is a 1-D equivalent • Model vs Measured Diff (with empirical
property? 1-D equivalent material properties):
< 0.3% for EnergyPlus and TRNSYS
A material property back
calculated from Two software, with independent models and
measuredLastcalorimetric
18 hrs are best modelers, have matched model to
heat losssteady state and
assuming pureare measurement within small uncertainties!
used in the test suite
1-D heat transfer with
parallel path analysis • This is incredibly low uncertainty - the ETNA
data and its spec are looking good and reliable!
U.S. DEPARTMENT OF ENERGY OFFICE OF ENERGY EFFICIENCY & RENEWABLE ENERGY 13Step through QA/QC process with one software
1. Initial interpretation
low by 32%
U.S. DEPARTMENT OF ENERGY OFFICE OF ENERGY EFFICIENCY & RENEWABLE ENERGY 14Step through QA/QC process with one software
2. Updated hx coeff
went high by 9%
1. Initial interpretation
low by 32%
U.S. DEPARTMENT OF ENERGY OFFICE OF ENERGY EFFICIENCY & RENEWABLE ENERGY 15Step through QA/QC process with one software
2. Updated hx coeff
went high by 9%
3. Modified radiation
calculation still high by
7%
1. Initial interpretation
low by 32%
U.S. DEPARTMENT OF ENERGY OFFICE OF ENERGY EFFICIENCY & RENEWABLE ENERGY 16Step through QA/QC process with one software
2. Updated hx coeff
went high by 9%
3. Modified radiation
calculation still high by
7%
4. Corrected thermal
conductivity, ,
Difference reduced to
0.23%
1. Initial interpretation
low by 32%
U.S. DEPARTMENT OF ENERGY OFFICE OF ENERGY EFFICIENCY & RENEWABLE ENERGY 172/3D Effect Modeling
• Break wall into center, edges, and corners
• Use Therm (2D FEM) to estimate heat transfer
at edges NORTH
• Use 3D adjustments to estimate corners from
Therm models of edges
WEST
EAST
We will be comparing the differences between proper 2/3D
analysis and using empirically determined 1-D equivalent
properties SOUTH
Floor UA Estimate with 2/3D Therm Analysis
Measured 1-D Model with Listed 2/3D augmented Model
Properties with Listed Properties
U*A 5.67 W/K 3.5 W/K 5.53 W/K
∆ - 38.3% 2.5%
U.S. DEPARTMENT OF ENERGY OFFICE OF ENERGY EFFICIENCY & RENEWABLE ENERGY 18Progress
FY20 FY20 FY20 FY20 FY21 FY21 FY21 FY21 FY22 FY22 FY22 FY23
Q1 Q2 Q3 Q4 Q1 Q2 Q3 Q4 Q1 Q2 Q3 Q4
1. Verify Data
**
2. Steady State Base **
3. Steady State
Sensitivity Tests *
4. Artificial Climate
*
(Dynamic) *
5. Natural Climate
(S. Guard Removed) *
6. Final Report and
140 Submission *
Completed Work * Milestones
Work in Progress * Go/No-gos
U.S. DEPARTMENT OF ENERGY OFFICE OF ENERGY EFFICIENCY & RENEWABLE ENERGY 19Stakeholder Engagement
Primary Stakeholder Engagement has been through a Technical Advisory
Group (TAG)
• Meetings in July 2020, March 2021, with three more meetings planned.
• TAG has feedback has been outstanding
• Feedback from TAG has led the team to focus more on understanding 2/3D effects
Secondary Stakeholder Engagement is through bi-annual updates of ASHRAE
140 constituents in the SSPC 140 committee meetings.
• DOE funded EV&U projects meet prior to ASHRAE to share best practices
Tertiary Stakeholder Engagement is through bi-annual ASHRAE 140/205
Maintenance and Development Project stakeholder engagement meetings
• Muehleisen is PI of that project too and all team members on ASHRAE project too
Further outreach will be through IBPSA and ASHRAE Conference papers and
presentations:
U.S. DEPARTMENT OF ENERGY OFFICE OF ENERGY EFFICIENCY & RENEWABLE ENERGY 20Remaining Project Work
FY20 FY20 FY20 FY20 FY21 FY21 FY21 FY21 FY22 FY22 FY22 FY23
Q1 Q2 Q3 Q4 Q1 Q2 Q3 Q4 Q1 Q2 Q3 Q4
1. Verify Data
**
2. Steady State Base **
3. Steady State
Sensitivity Tests *
4. Artificial Climate
*
(Dynamic) *
5. Natural Climate
(S. Guard Removed) *
6. Final Report and
140 Submission *
Completed Work * Milestones
Work in Progress * Go/No-gos
U.S. DEPARTMENT OF ENERGY OFFICE OF ENERGY EFFICIENCY & RENEWABLE ENERGY 21Remaining Project Work
• Complete Steady-State cases and move onto Artificial and Natural Climate
– Steady state cases are the foundation of the spec and ensuring the overall test
procedure is right and repeatable in multiple software
• Complete writing test spec in a 140 ready format
– Spec will be fully written and vetted with at least 3 software programs and 3
modelers, speeding field trials and inclusion into ASHRAE 140
Changes from original project plan in response to Stakeholder Feedback:
• More emphasis on analyzing 2/3D effects
– TAG is interested in seeing if we can write the test spec so people could:
• Use 2/3D modeling without applying empirically characterized 1-D equivalent material
properties (i.e., using only the originally listed material properties)
• Compare such models with 1-D only models applying the empirically characterized 1-D
equivalent material properties
U.S. DEPARTMENT OF ENERGY OFFICE OF ENERGY EFFICIENCY & RENEWABLE ENERGY 22Thank You
Argonne National Laboratory, J. Neymark & Associates, Thermal Energy System Specialists
Ralph T. Muehleisen, Chief Building Scientist
(630) 252-2547, rmuehleisen@anl.gov
U.S. DEPARTMENT OF ENERGY OFFICE OF ENERGY EFFICIENCY & RENEWABLE ENERGY 23REFERENCE SLIDES U.S. DEPARTMENT OF ENERGY OFFICE OF ENERGY EFFICIENCY & RENEWABLE ENERGY 24
Project Budget
          Project Budget: $996k, about $330K/yr
          Variances: FY20 funding did not arrive until Q2 FY20, project started 1 quarter late
          Cost to Date: Identify what portion of the project budget has been expended to date.
          Additional Funding: None

                                                                              Budget History
                              10/1/2019– FY 2020                                                  FY 2022 – 9/30/2022
                                                                              FY 2021 (current)
                                            (past)                                                         (planned)

                               DOE                Cost-share                DOE        Cost-share    DOE        Cost-share
                            329k                 0                        330k         0          332k         0

U.S. DEPARTMENT OF ENERGY    OFFICE OF ENERGY EFFICIENCY & RENEWABLE ENERGY                                                  25
Project Plan and Schedule
FY20 FY20 FY20 FY20 FY21 FY21 FY21 FY21 FY22 FY22 FY22 FY23
Q1 Q2 Q3 Q4 Q1 Q2 Q3 Q4 Q1 Q2 Q3 Q4
1. Verify Data * *
2. Steady State Base * *
3. Steady State
Sensitivity Tests * *
4. Artificial Climate
(Dynamic) * *
5. Natural Climate
(S. Guard Removed) *
6. Final Report and
140 Submission *
Completed Work * Updated Milestones
Work in Progress * Original Planned – Delay because of 1
quarter funding delay at beginning of project
U.S. DEPARTMENT OF ENERGY OFFICE OF ENERGY EFFICIENCY & RENEWABLE ENERGY 26You can also read