PUBLIC DISCLOSURE STATEMENT - ENERGYAUSTRALIA PTY LTD ELECTRICITY AND GAS PRODUCTS CY2020
←
→
Page content transcription
If your browser does not render page correctly, please read the page content below
PUBLIC
DISCLOSURE
STATEMENT

ENERGYAUSTRALIA PTY LTD

ELECTRICITY AND GAS PRODUCTS
CY2020

  Organisation name here   1
CLIMATE ACTIVE Public Disclosure Statement

                                                                                        Australian Government

                                                                                       Climate Active
                                                         Public Disclosure Statement

NAME OF CERTIFIED ENTITY: EnergyAustralia Pty Ltd

REPORTING PERIOD: 1 January 2020 – 31 December 2020

Declaration
To the best of my knowledge, the information provided in this Public Disclosure Statement is true and
correct and meets the requirements of the Climate Active Carbon Neutral Standard.

 Signature                                                        Date 17th June 2021

 Name of Signatory Mark Brownfield

 Position of Signatory Chief Customer Officer

Public Disclosure Statement documents are prepared by the submitting organisation. The material in Public Disclosure
Statement documents represents the views of the organisation and do not necessarily reflect the views of the Commonwealth.
The Commonwealth does not guarantee the accuracy of the contents of the Public Disclosure Statement documents and
disclaims liability for any loss arising from the use of the document for any purpose.

Version number February 2021

EnergyAustralia Pty Ltd                                       2
CLIMATE ACTIVE Public Disclosure Statement
1. CARBON NEUTRAL INFORMATION
Description of certification
EnergyAustralia offsets the carbon dioxide emissions associated with the electricity
Carbon Neutral
and gas used by residential and business customers that have opted-in to one of our certification gives
offset offerings. In 2020, more than 10% of our residential customers took the
confidence to our
opportunity to receive carbon neutral energy through our program, at no extra cost to
them. customers that our
program helps them
For our carbon neutral electricity, the relevant functional unit is megawatt hours
(MWh), with consumption of the product by customers measured as MWh per year. make a positive
For carbon neutral gas, the relevant functional unit is gigajoules (GJ), with
difference to the
consumption of the product by customers measured in GJ per year. environment
Organisation description
EnergyAustralia is one of Australia’s largest energy companies, providing gas and electricity to
approximately 2.4 million household and business customer accounts in New South Wales, Victoria,
Queensland, South Australia and the Australian Capital Territory. We control a range of generation assets
including Victoria’s first two utility-scale batteries and over 800MW in wind and solar farm offtakes, and we
own over 4,500MW in electricity generation capacity powered by brown coal, black coal and gas.
In March 2021, we announced a plan to close our Yallourn coal-fired power station in mid-2028. Through
the transition, we will do the right thing by our workers. We will also support the energy system by building
a four-hour, utility-scale battery of 350MW capacity by the end of 2026 - larger than any battery operating
in the world today.
EnergyAustralia Pty Ltd 3CLIMATE ACTIVE Public Disclosure Statement
Product/service process diagram – ELECTRICITY PRODUCT
The following diagram is cradle to grave
Electricity Generation Sector
Excluded emission
• Extraction of fuels
sources
• Production of fuels
• Transport of fuels NA
• Combustion of fuels
Upstream
emissions
Transmission and Distribution
• Delivery losses between
generation and consumption
EnergyAustralia Retail
Operation
• Emissions as they relate to
Responsible the retailing operations
entity required to sell the electricity
product to customers
Electricity Consumption by the
Downstream customer
usage
• Measured at meter.
EnergyAustralia Pty Ltd 4CLIMATE ACTIVE Public Disclosure Statement
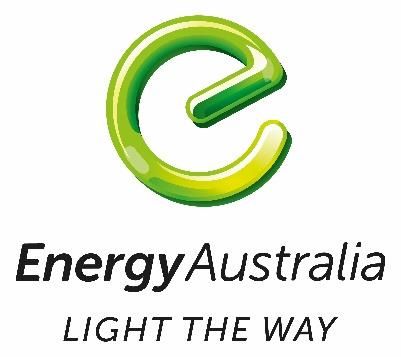
Product/service process diagram: GAS PRODUCT
The following diagram is cradle to grave
Gas purchased from bilateral
contracts and wholesale
Excluded emission
markets
sources
• Extraction of fuels
NA
• Production of fuels
• Transport of fuels
Upstream
emissions
Distribution
• Delivery losses between
generation and consumption
EnergyAustralia Retail
Operation
• Emissions as they relate to
the retailing operations
Responsible required to sell the gas
entity product to customers
Gas Consumption by the
customer
Downstream
emissions • Emissions associated with
the combustion of gas
EnergyAustralia Pty Ltd 5CLIMATE ACTIVE Public Disclosure Statement
2. EMISSION BOUNDARY
Diagram of the certification boundary: ELECTRICITY PRODUCT
Non-attributable
Quantified Non-quantified Not applicable
Greenhouse gas Staff commute to and
emissions created from offices
from the extraction,
production, transport,
and combustion of
fuels to generate
electricity.
Emissions created
from electricity lost in
delivery from the point
of generation to the
point of consumption
(customer meter).
Office energy
consumption
(electricity and gas)
Office air-conditioning
Office refrigeration
Office paper Excluded
consumption
NA
Office waste
consumption
Business travel
Business
Accommodation
Base building energy
consumption
(electricity and gas)
Base building water
consumption
Base building air-
conditioning
EnergyAustralia Pty Ltd 6CLIMATE ACTIVE Public Disclosure Statement
Diagram of the certification boundary: GAS PRODUCT
Non-attributable
Quantified Non-quantified Not applicable
Greenhouse gas Staff commute to and
emissions from from offices
exploration and
production of natural
gas
Transmission and
distribution losses
Office energy
consumption
(electricity and gas)
Office air-conditioning
Office refrigeration
Office paper
consumption
Office waste
consumption
Business travel
Excluded
Business
Accommodation NA
Base building energy
consumption
(electricity and gas)
Base building water
consumption
Base building air-
conditioning
Combustion of gas
when customers use
gas
EnergyAustralia Pty Ltd 7CLIMATE ACTIVE Public Disclosure Statement
Attributable non-quantified sources
Staff Commute – not material
Data management plan At the start of 2020,
Not applicable
EnergyAustralia set a
public objective of
Excluded sources (within certification boundary)
being Carbon Neutral
No sources were excluded.
by 2050. Our
Non attributable sources (outside accompanying climate
certification boundary) statement can be
Not applicable
found at:
www.energyaustralia.
com.au/Carbon-
Neutral-by-2050.
EnergyAustralia Pty Ltd 8CLIMATE ACTIVE Public Disclosure Statement
3. EMISSIONS SUMMARY
Emissions reduction strategy
Carbon Neutral by 2050. At the start of 2020, EnergyAustralia set a public objective of being Carbon
Neutral by 2050. Our accompanying climate credentials can be found at
www.energyaustralia.com.au/Carbon-Neutral-by-2050. Our Purpose is to lead and accelerate the clean
energy transformation for all.
Emissions over time: ELECTRICITY PRODUCT
Table 1a
Emissions since base year (CY)
Base year1 Year 1: Year 2: Year 3: Current year
2015 2016-17 2018 2019 2020
Total tCO2e 22,311,266 173,006 546,171 879,081 1,171,125
Emissions over time: GAS PRODUCT
Table 1b
Emissions since base year (CY)
Base year1 Current
2017 year
Year 2020:
Total tCO2e 3,356,409 29,121
___________________________________________
1
Base year includes greenhouse gas emissions in relation to the full electricity base.
EnergyAustralia Pty Ltd 9CLIMATE ACTIVE Public Disclosure Statement Emissions reduction actions On the wholesale side of our business, EnergyAustralia has the rights to more than 800 MW of solar and wind farm power purchase agreements, along with ownership of half the Cathedral Rocks wind farm. Through these long-term agreements, worth almost $3 billion, we underpin around 6.5 per cent of the large-scale wind and solar projects in Eastern Australia’s National Electricity Market. EnergyAustralia is committed to reducing its carbon dioxide emissions by progressively phasing out coal-fired power, as we work to integrate new supplies of dispatchable generation, without compromising the reliability and affordability of the energy system. In March 2021, we announced a plan to close our Yallourn coal-fired power station in mid-2028. Yallourn’s retirement will lower EnergyAustralia's Scope One carbon dioxide emissions by over 60% relative to today, accelerating our transition to net zero emissions by 2050. We will not build another coal-fired power plant. Through our Customer business unit, we offer our customers carbon neutral energy. Since 2016, we have given our customers the opportunity to offset their emissions from home electricity use at no extra cost to them. We expanded our Go Neutral program to gas in May 2020. We added Business Carbon Neutral in June 2020, helping our business customers offset their electricity emissions and display their carbon credentials. EnergyAustralia now has over 250,000 of our customers choosing to have their energy use offset, and we have offset 2.8m tonnes of carbon dioxide to date. In addition, we have over 10,000 customer accounts purchasing accredited GreenPower through EnergyAustralia. EnergyAustralia Pty Ltd 10
CLIMATE ACTIVE Public Disclosure Statement

Functional units: ELECTRICITY PRODUCT
Table 2a
                                                                                   Number of
                                                                                   functional units
a) Number of functional units sold this period                                     1,240,682 MWh

b) Number of functional units to be forward offset demonstrating commitment        -
to carbon neutrality (true-up to be conducted at the end of the reporting
period)

Functional units GAS PRODUCT
Table 2b
                                                                                   Number of
                                                                                   functional units
a) Number of functional units sold this period                                     512,162 GJ

b) Number of functional units to be forward offset demonstrating commitment        -
to carbon neutrality (true-up to be conducted at the end of the reporting
period)

EnergyAustralia Pty Ltd                                11
CLIMATE ACTIVE Public Disclosure Statement
Emissions summary (inventory): ELECTRICITY PRODUCT
Table 3a
Emission source category tonnes CO2-e
Electricity purchased from the wholesale market and sold to EA 8,762
customers - ACT
Electricity purchased from the wholesale market and sold to EA 648,612
customers - NSW
Electricity purchased from the wholesale market and sold to EA 89,377
customers - QLD
Electricity purchased from the wholesale market and sold to EA 16,975
customers - SA
Electricity purchased from the wholesale market and sold to EA 406,910
customers - VIC
GHG emissions from retail operations (scope 1)1 0
GHG emissions from retail operations (scope 2&3)1 489
1,171,125
1. Total inventory emissions
a. Number of functional units represented by the inventory 1,240,682
emissions
2. Emissions per functional unit (based on the number of functional
0.94
units represented by the inventory)
Total tCO2-e divided by the number of functional units in 1a.
3. Carbon footprint
1,171,125
(Emissions per functional unit (2)* number of functional units (a or b
from table 2))
1
Greenhouse gas emissions attributable to EnergyAustralia’s retail operations in relation to Go Neutral
electricity sales are estimated based on the analysis of greenhouse gas emissions for EnergyAustralia’s
retail operations undertaken in relation to the base year 2015. The emissions from these retail
operations attributable to Go Neutral electricity sales have been estimated based on the total number
of electricity and gas accounts and the amount of Go Neutral electricity sales as a proportion of total
electricity sales to EnergyAustralia customers.
EnergyAustralia Pty Ltd 12CLIMATE ACTIVE Public Disclosure Statement
Emissions summary (inventory): GAS PRODUCT
Table 3b
Emission source category tonnes CO2-e
Gas purchased from bilateral contract or wholesale market and sold 106
to EA customers - ACT
Gas purchased from bilateral contract or wholesale market and sold 3,884
to EA customers - NSW
Gas purchased from bilateral contract or wholesale market and sold -
to EA customers - QLD
Gas purchased from bilateral contract or wholesale market and sold 236
to EA customers - SA
Gas purchased from bilateral contract or wholesale market and sold 24,850
to EA customers - VIC
GHG emissions from retail operations (scope 1)2 0
GHG emissions from retail operations (scope 2&3)2 46
29,121
1. Total inventory emissions
a. Number of functional units represented by the inventory 512,162
emissions
2. Emissions per functional unit (based on the number of functional
0.05686
units represented by the inventory)
Total tCO2-e divided by the number of functional units in 1a.
3. Carbon footprint
29,121
(Emissions per functional unit (2)* number of functional units (a or b
from table 2))
Uplift factors
Not applicable
Carbon neutral products
Not applicable
2
Greenhouse gas emissions attributable to EnergyAustralia’s retail operations in relation to Go Neutral
gas sales are estimated based on the analysis of greenhouse gas emissions for EnergyAustralia’s retail
operations undertaken in relation to the base year 2015. The emissions from these retail operations
attributable to Go Neutral gas sales have been estimated based on the total number of electricity and
gas accounts and the amount of Go Neutral gas sales as a proportion of total gas sales to
EnergyAustralia customers.
EnergyAustralia Pty Ltd 13CLIMATE ACTIVE Public Disclosure Statement
4. CARBON OFFSETS
Offsets strategy
Offset purchasing strategy: arrears
1. Total offsets previously
forward purchased and
banked for this report
2. Total emissions liability to 1,200,246 tCO2e for current year
offset for this report
Additional 3,148 tCO2e true-up for prior years where error
identified
3. Net offset balance for this 1,203,394 tCO2e
reporting period
4. Total offsets to be forward
purchased to offset the next
reporting period
5. Total offsets required for this 1,203,394 tCO2e
report
Co-benefits
EnergyAustralia has purchased certificates for projects from both Australian and International projects (the
majority). Projects include Caixa Econonimca Federal Solid Waste Management and Carbon Finance
Project, Urisino Regenerative Ecosystem Project and the ALFA (NT) Savanna Fire Management Project.
The ALFA (NT) Savanna Fire Management Project involves the application of strategic, lower intensity
early dry season fire management to reduce the risk and extent of higher intensity fires that occur mostly in
the late dry season. The Indigenous Ranger groups formed the entity Arnhem Land Fire Abatement (NT)
Ltd. ALFA (NT) Ltd is a company owned exclusively by Aboriginal people with custodial responsibility for
those parts of Arnhem Land under active bushfire management.
EnergyAustralia Pty Ltd 14CLIMATE ACTIVE Public Disclosure Statement
Offsets summary
Proof of cancellation of offset units
Offsets cancelled for Climate Active Carbon Neutral Certification
Project description Type Registr Date Serial number (and hyperlink to registry Vintage Eligible Quantity Quantity Quantity
of y retired transaction record) Quantit used for banked used for
offset y previous for this
units (TCO2- reporting future reporting
e) periods reportin period
g claim
periods
Enercon Wind Farms in CER CDM 26/11/2020
IN-5-202450332-2-2-0-1291 - IN-5- 2013,14 60,052 60,052
Karnataka Bundled Project – 202510383-2-2-0-1291
30.40 MW (UN 1291) https://cdm.unfccc.int/Projects/DB/SGS-
UKL1187092432.51
Enercon Wind Farms in CER CDM 26/11/2020 IN-5-216529969-2-2-0-1291 - IN-5-216590274-2- 2014,15 60,306 60,306
Karnataka Bundled Project – 2-0-1291
30.40 MW (UN 1291)
https://cdm.unfccc.int/Projects/DB/SGS-
UKL1187092432.51
Enercon Wind Farms in CER CDM 26/11/2020 IN-5-243692479-2-2-0-1291 - IN-5-243766646-2- 2015,16, 74,168 74,168
Karnataka Bundled Project – 2-0-1291 17
30.40 MW (UN 1291)
https://cdm.unfccc.int/Projects/DB/SGS-
UKL1187092432.51
Bundled wind energy power CER CDM 26/11/2020 IN-5-200327662-2-2-0-1166 - IN-5-200358370- 2013,14 30,709 30,709
projects (2004 policy) in 2-2-0-1166
Rajasthan (UN 1166)
https://cdm.unfccc.int/Projects/DB/SGS-
UKL1181723770.26
Bundled wind energy power CER CDM 26/11/2020 IN-5-242805058-2-2-0-1166 - IN-5-242877121-2- 2014,15, 72,064 72,064
EnergyAustralia Pty Ltd 15CLIMATE ACTIVE Public Disclosure Statement
projects (2004 policy) in 2-0-1166 16,17
Rajasthan (UN 1166)
https://cdm.unfccc.int/Projects/DB/SGS-
UKL1181723770.26
20 MW Enercon Wind farms CER CDM 26/11/2020 IN-5-241870205-2-2-0-3854 - IN-5-241970926-2- 2013,14, 100,722 100,722
(SAI) Pvt. Limited in 2-0-3854 15,16,17
Maharashtra (UN 3854)
https://cdm.unfccc.int/Projects/DB/DNV-
CUK1279516994.31
Tungabhadra wind power CER CDM 26/11/2020 IN-5-196673682-2-2-0-1268 - IN-5-196710865-2- 2013 37,184 37,184
project in Karnataka (UN 2-0-1268
1268)
https://cdm.unfccc.int/Projects/DB/DNV-
CUK1185867846.4
Tungabhadra wind power CER CDM 26/11/2020 IN-5-206532110-2-2-0-1268 - IN-5-206580939-2- 2013,14 48,830 48,830
project in Karnataka (UN 2-0-1268
1268)
https://cdm.unfccc.int/Projects/DB/DNV-
CUK1185867846.4
Wind Power Project at Tadas, CER CDM 10/02/2021 IN-5-219062626-2-2-0-9376 - IN-5-219257635- 2013 - 195,010 195,010
Karnataka (9376) 2-2-0-9376 2015
https://cdm.unfccc.int/Projects/DB/RINA13567089
62.81
Wind Power Project at Vaspet, CER CDM 10/02/2021 IN-5-211738139-2-2-0-8606 - IN-5-211865939-2- 2014 - 127,801 127,801
Maharashtra (8606) 2-0-8606 2015
https://cdm.unfccc.int/Projects/DB/BVQI13548172
85.58
Wind Power Project at Rajkot, CER CDM 19/02/2021 IN-5-211449727-2-2-0-8095 - IN-5-211529389- 2013 - 79,663 79,663
Gujarat (8095) 2-2-0-8095 2015
https://cdm.unfccc.int/Projects/DB/LRQA%20Ltd1
352364786.6
EnergyAustralia Pty Ltd 16CLIMATE ACTIVE Public Disclosure Statement
Wind Energy Project in Gujarat CER CDM 6/01/2021 IN-5-214992919-2-2-0-6484 - IN-5-215082297- 2013- 89,379 89,379
(6484) 2-2-0-6484 2015
https://cdm.unfccc.int/Projects/DB/DNV-
CUK1340349635.01
Wind Energy Project - Shree CER ANRUE 15//6/21 209,512,807 - 209,602,806 2013- 90,000 90,000
Naman Developers, http://www.cleanenergyregulator.gov.au/OSR/AN 2015
Maharashtra (3238) REU/Data-and-information
Caixa Econômica Federal CER ANRUE 15//6/21 125,995,972 - 125,996,171 2016 200 200
Solid Waste Management and http://www.cleanenergyregulator.gov.au/OSR/AN
Carbon Finance Project (6573) REU/Data-and-information
Caixa Econômica Federal CER ANRUE 15//6/21 125,996,175 - 125,999,008 2016 2,834 2,834
Solid Waste Management and http://www.cleanenergyregulator.gov.au/OSR/AN
Carbon Finance Project (6573) REU/Data-and-information
Caixa Econômica Federal CER ANRUE 15//6/21 142,089,972 - 142,161,937 2017 71,966 71,966
Solid Waste Management and http://www.cleanenergyregulator.gov.au/OSR/AN
Carbon Finance Project (6573) REU/Data-and-information
Caixa Econômica Federal CER ANRUE 15//6/21 116,905,481 - 116,909,430 2015 3,950 3,950
Solid Waste Management and http://www.cleanenergyregulator.gov.au/OSR/AN
Carbon Finance Project (6573) REU/Data-and-information
Caixa Econômica Federal CER ANRUE 15//6/21 125,859,503 - 125,891,171 2016 31,669 31,669
Solid Waste Management and http://www.cleanenergyregulator.gov.au/OSR/AN
Carbon Finance Project (6573) REU/Data-and-information
Caixa Econômica Federal CER ANRUE 15//6/21 125,955,972 - 125,956,171 2016 200 200
Solid Waste Management and http://www.cleanenergyregulator.gov.au/OSR/AN
Carbon Finance Project (6573) REU/Data-and-information
Caixa Econômica Federal CER ANRUE 15//6/21 125,955,522 - 125,955,971 2016 450 450
Solid Waste Management and http://www.cleanenergyregulator.gov.au/OSR/AN
EnergyAustralia Pty Ltd 17CLIMATE ACTIVE Public Disclosure Statement
Carbon Finance Project (6573) REU/Data-and-information
Caixa Econômica Federal CER ANRUE 15//6/21 125,956,172 - 125,958,408 2016 2,237 2,237
Solid Waste Management and http://www.cleanenergyregulator.gov.au/OSR/AN
Carbon Finance Project (6573) REU/Data-and-information
Arnhem Land Fire Abatement ACCU ANRUE 15//6/21 3,769,447,880 - 3,769,453,869 2017- 5,990 5,990
(WALFA) Project EOP100945 http://www.cleanenergyregulator.gov.au/OSR/AN 2018
REU/Data-and-information
Piccaninny Plains Carbon ACCU ANRUE 15//6/21 3,800,975,277 - 3,800,986,918 2019- 11,642 11,642
Abatement EOP100549 http://www.cleanenergyregulator.gov.au/OSR/AN 2020
REU/Data-and-information
Wongalara Carbon Abatement ACCU ANRUE 15//6/21 3,800,988,799 - 3,800,993,286 2019- 4,488 4,488
ERF103013 http://www.cleanenergyregulator.gov.au/OSR/AN 2020
REU/Data-and-information
Urisino Regenerative ACCU ANRUE 15//6/21 3,655,189,087 - 3,655,190,966 2014- 1,880 1,880
Ecosystem Project http://www.cleanenergyregulator.gov.au/OSR/AN 2015
EOP100637 REU/Data-and-information
Total offsets retired this report and used in this report 1,203,394
Total offsets retired this report and banked for future reports 0
EnergyAustralia Pty Ltd 18CLIMATE ACTIVE Public Disclosure Statement
5. USE OF TRADE MARK
Table 7
Description where trademark used Logo type
Marketing and related material associated with the Certified Product
promotion of the carbon neutral electricity/gas product
including website.
6. ADDITIONAL INFORMATION
Not Applicable
EnergyAustralia Pty Ltd 19CLIMATE ACTIVE Public Disclosure Statement
APPENDIX 1
Non-attributable emissions for products and services
Not applicable
APPENDIX 2
Non-quantified emissions for products/services
Please advise which of the reasons applies to each of your non-quantified emissions. You may add rows if
required.
Table 9
Non-quantification test
Relevant-non- Immaterial Quantification is Data unavailable Initial emissions
quantifiedCLIMATE ACTIVE Public Disclosure Statement EnergyAustralia Pty Ltd 21
You can also read