Environmental Monitoring of Spatial and Temporal distribution pattern of Airborne Pollen grains in some selected Localities within Akoko division ...
←
→
Page content transcription
If your browser does not render page correctly, please read the page content below
International Journal of Innovative Biosciences Research 9(1):1-20, Jan.-Mar., 2021
         © SEAHI PUBLICATIONS, 2021 www.seahipaj.org                      ISSN: 2467-8457

    Environmental Monitoring of Spatial and Temporal
   distribution pattern of Airborne Pollen grains in some
   selected Localities within Akoko division, Ondo State,
                           Nigeria
             Prof. Ige, Olugbenga Ebenezer1 & Dr. Essien, Benjamin Christopher2

                       Department of Plant Science and Biotechnology,
                                     Faculty of Science,
               Adekunle Ajasin University, Akungba-Akoko, Ondo State, Nigeria
  Author’s Email: olugbengaige@yahoo.com1; benjamin.essien@aaua.edu.ng2; benjaminessien8@gmail.com2

  ABSTRACT
  The study monitoring spatial and temporal distribution pattern of airborne pollen grains in some
  selected localities within Akoko division, Ondo State, Nigeria gives information on diurnal,
  seasonal and annual variations in the pollen types and their concentration in the atmosphere. The
  airborne pollen grains were collected with Modified Tauber Sampler using simple random
  sampling technique and analyzed palynologically. Results showed 50,661 pollen grains
  comprising of 182 pollen types belonging to 74 plant families were encountered. Three (3) of
  these pollen types were identified to family level, 57 to species level, 121 to generic level and
  one (1) unidentified. The predominant pollen types belong to the family Poaceae, Arecaceae,
  Euphorbiaceae, Asteraceae and Casuarinaceae. Airborne pollen grains were most abundant
  between September and January. Rainfall and relative humidity had more negative effect on
  pollen concentration. The effects of temperature and light intensity varied considerably with
  time and location because their effects are influenced by other meteorological factors. The
  period of pollen abundance, variability and distribution in the atmosphere revealed that the
  highest mean concentration occurred during the late rainy season to early dry season, followed
  by the period of dry season to early rainy season and the least occurred during the mid-rainy
  season. Study has provided baseline information especially to persons suffering from pollen
  grains allergies such as hay fever (pollinosis).
  Keywords: Akoko division; Airborne-pollen; Distribution; Spatial; Temporal, Nigeria

  1. INTRODUCTION
  Palynological studies are important tools for interpreting the environment (past and present) and
  elucidating questions related to palaeoclimates and palaeoecology (Barreto et al., 2012).
  Research has shown that pollen grains are a major contributor to pollinosis symptoms (Ige and
  Essien, 2019; Subiza et al., 1994). Despite the abundance of airborne pollen and its proven
  implications in pollinosis, few studies have actually addressed the implications of this airborne
  pollen content especially its seasonal production, abundance, distribution pattern and period of
  prevalence in the atmosphere. However, it is necessary to understand the present environment
  and the dynamics that controls the seasonal production, dispersal, distribution, deposition and
  sedimentation of pollen grains before one attempts to interprete the pollen records.
  Pollen grains are generally produced in excess of the biological needs of the plants. Established
  observations have shown that anemophilous plants release large quantities of pollen into the air,
  while entomophilous taxa release smaller amounts (Essien et al., 2016; Agwu, 1997). The
  behavioural patterns lead to differences in the quantity of pollen and spores of various taxa
  available in the atmosphere, and which of them can be trapped during sampling (Agwu, 2001;
  Moore and Webb, 1978).
  Studies monitoring the pollen content of air and deposition of airborne pollen grains have also
  given enough insight. Early results of diverse trapping experiments and surface sample studies

                                                   1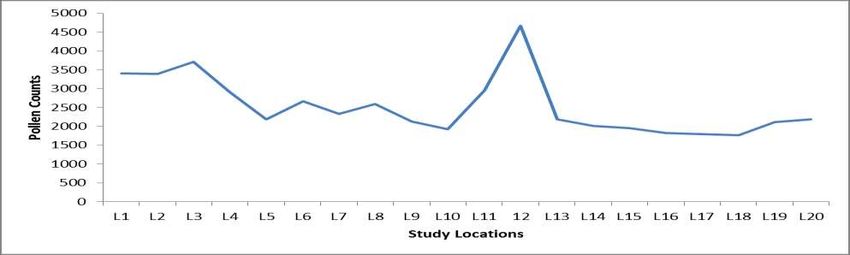
Ige & Essien ….. Int. J. Innovative Biosciences Res 9(1):1-20, 2021

are widely reported (Giesecke et al., 2010). The comprehensive model of pollen deposition and
the pollen bucket studies by H. Tauber encouraged researchers to conduct similar experiments
using the same type of pollen trap, which became the main trapping device for Quaternary
palynologists (Tauber, 1974). The high precipitation in the tropics inspired the development of
alternative design.
The release, distribution and sedimentation of these airborne pollen grains are influenced by a
number of factors such as the type and floristic composition of the vegetation which determine
the abundance and types of pollen that are released into the atmosphere (Essien et al., 2016;
Agwu, 2001; Gregory, 1978). Also, the flowering pattern of individual plants play important role
in determining the abundance and taxa of pollen circulating in the atmosphere (Essien, 2020).
Airborne pollen grains generally travel short distances; however, when they are blown into the
upper strata of the atmosphere, pollen grains travel long distances, before they are deposited
(Essien, 2020; Essien, 2014). Meteorological factors, in particular temperature, precipitation,
humidity and wind speed strongly influence airborne pollen counts (Essien and Agwu, 2013;
Agwu and Osibe, 1992). Pollen dispersal is facilitated by dry weather and high wind velocity.
Pollen count is reduced after precipitation. The widely dispersed pollen and spores provide a
broad picture of the surrounding vegetation of the areas in which they are produced. Even
though sometimes, some of them are blown into these areas from distant places, experienced
palynologists are most of the time able to detect these re-deposited pollen and spores by
differences in preservation (e.g. colour, corrosion, wear), ecological or stratigraphical
inconsistencies and other associated evidences of being re-deposited (Melia, 1984).
Several studies presented evidence that local vegetation was a driver of spatial variation in
pollen distribution pattern. For example, Gonzalo-Garjo et al. (2006) used information from tree
census in his study area and found out that the site with highest Cycamore pollen concentration
was closer to major stands of Cycamore tree than two sites with lower concentrations, although
the exact distance and densities of the stands were not reported. Katelaris et al. (2004) conducted
vegetation surveys in 2,000 m circular buffers of their three sampling sites and found differences
in local vegetation that parallel differences in total pollen concentrations. In the study by Nowak
et al. (2012), one site was located 100 m from the closest trees while the other was 6.5 km from
the closest Cycamore trees. Annual Cycamore totals were 10 to 20 times lower at the site that
was farthest from the Cycamore trees, suggesting that most Cycamore pollen does not travel far
from its source and that the local sources are important drivers of local pollen concentrations.
Some factors that aid in pollen dispersal are the size, shape and density of the pollen, the
position of the parent plants (that produce them) in the vegetation and the prevailing climatic
conditions (Patrick et al., 2005). The distinctive surface sculptures of pollen grains aid in the
identification of their parent plants to at least family level (Njokuocha and Ukeje, 2006). Their
other qualities such as small size, abundance and high resistance to degradation have made them
an invaluable evidence of vegetation as well as environmental changes (Davies, 1969).
Aerobiological samples taken at a particular time in a given place provide an estimate of the
atmospheric pollen levels. Since turbulence phenomena cause temporal and spatial variations in
the concentrations, a more precise estimate is given by continuous sampling. This information
can be obtained using pollen trap at different points, although temporal variations will not be
recorded unless the sampling is carried out continuously. The degree to which a sampling site(s)
is located in a more central or pheripheral position will significantly influence not only the
airborne pollen grains distribution pattern but also the spectrum of pollen types trapped over the
course of the year.
Because of the transitional location of Akoko division, Ondo State, Nigeria between the tropical
rainforest in the South and the true savanna in the North; the area receives particles moving from
the South to the Northern part of Nigeria and vice versa. Equally, the movements of the South-
West Monsoon and North-East Trade winds across the latitudinal zones of Nigeria carrying
along with them large quantities of pollen grains which are deposited along their routes
depending on the strength of the winds during the major seasons of the year. The aim of this
study is to ascertain the pattern of spatial and temporal variations in the distribution of the
prevalent pollen types.

                                                2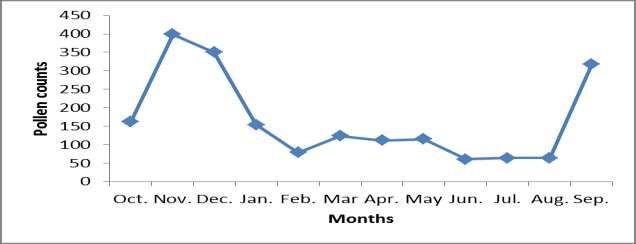
Ige & Essien ….. Int. J. Innovative Biosciences Res 9(1):1-20, 2021
2. MATERIALS AND METHODS
Forty locations were randomly selected within the four Local Government Areas of Akoko
division, Ondo State, Nigeria as sampling sites. The sampling sites for the study was purposely
selected to reflect (represent) as far as possible the Local Government Area of the study. In
choosing the sites, consideration was also given to urbanization, accessibility, and safety of the
sampling (experimental materials) instruments among others (Patton, 1990).
At each site, a pollen trap (Modified Tauber Sampler) was mounted according to the methods of
Tauber (1974; 1977), Pardoe et al. (2010) and Giesecke et al. (2010). Prior to this, a mixture of
glycerol (65 ml), formalin (30 ml) and phenol (5 ml) was poured into each of the trap. The
positions of the traps at various locations were recorded using a Global Position System (GPS).
The solutions in the trap prevented the palynomorphs from drying up, kill insects and also
prevented the decay of dead organisms. The trap was left to stand throughout the duration of the
study period. Fortnightly of each month, solution collection was done. The traps were washed
with water to remove any contaminants and were then recharged with the above mentioned
chemical solution. This procedure was repeated bi-monthly from October 2016 to December
2017 for one year. The palynomorphs were recovered through centrifugation at 2000 r.p.m
(revolution per minute) for 5 minutes and supernatant decanted each time. The precipitates were
washed twice with distilled water and recovered through centrifugation. The sediments were
treated with glacial acetic acid to remove water before acetolysis Erdtman (1969), Agwu and
Akanbi (1985). The recovered precipitates were washed with glacial acetic acid, and finally
washed twice with distilled water, centrifuged each time and decanted. The recovered
palynomorphs were stored in a plastic vials in glycerin and ethanol solution (2:1).
The palynomorphs were analysed palynologically and microscopically with Olympus
microscope at x400 magnification for counting and Leica microscope at x1000 magnification for
detailed morphological studies. Palynomorphs identification, counting and classification were
done with the help of reference descriptions and photomicrographs from Agwu and Akanbi
(1985), Bonnefille and Riollet (1980), Sowunmi (1995) and Shubharani et al. (2013). In
addition, prepared slides of pollen samples in the Palynological Research Unit; Department of
Plant Science and Biotechnology, Adekunle Ajasin University, Akungba- Akoko, Nigeria were
used.
3. RESULTS AND DISCUSSION
A total of 182 pollen types were identified across the study locations. These pollen types belong
to 74 plant families, 1 gymnosperm and 4 pteridophytes (Table 1). Out of these 74 plant families
encountered, 66 families belong to the dicotyledonous plants, 6 to monocotyledonous plants, 1
to the gymnospermous plants and 1 was unidentified (Indeterminata). At the study locations, the
highest pollen counts were recorded for Ayegunle followed by Ipesi, Ifira, Ipe and Akungba
while the least were recorded for Ogbagi and Oke- Agbe (Table 1).
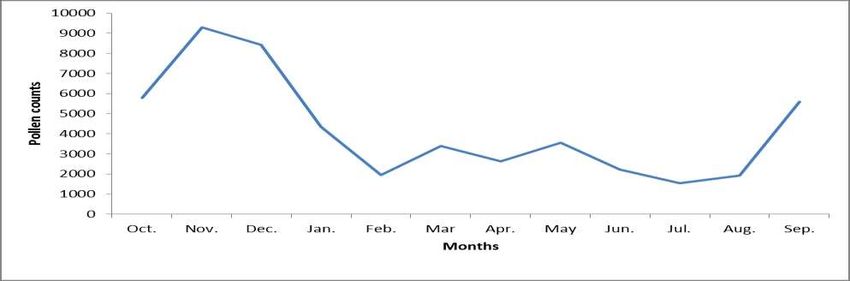
However, the cumulative monthly pollen record showed that a total of 50661 pollen grains were
recorded with the highest monthly pollen counts of 9,023 recorded in November, followed by
December (8,750), October (5,789), September (5,600) and the least recorded in August (1,926)
and July (1,530) respectively (Table 1).
3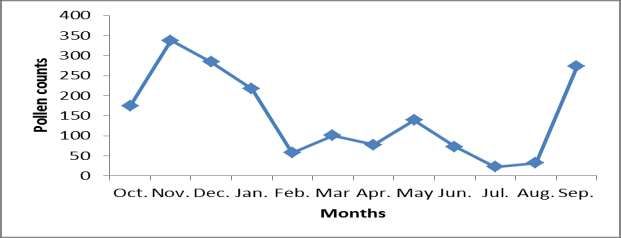
Ige & Essien ….. Int. J. Innovative Biosciences Res 9(1):1-20, 2021

      Table 1: Spatial distribution of pollen types across study locations

S/N   Study          Total No. of   Total No.    Total No.    Total No.      Total No.    Total No.    Total No. of
      Locations      pollen types   of pollen    of Plant     classified     classified   classified   Plant family
      (L1-L20)       counted        counted      Families     to Family      to Generic   to Species   Unidentified
                                                 identified   level          level        level
1     Ifira          125            3404         59           3              81           40           1
2     Ipe            110            3389         55           3              80           27           0
3     Ipesi          108            3710         53           3              76           28           1
4     Isua           91             2895         54           3              63           24           1
5     Sosan          80             2180         45           3              58           18           1
6     Akunnu         106            2664         58           3              70           32           1
7     Auga           110            2338         54           3              76           30           1
8     Iboropa        96             2587         53           3              66           26           1
9     Ikare          86             2130         51           3              61           21           1
10    Ise            75             1923         43           3              51           20           1
11    Akungba        78             2955         50           3              51           23           1
12    Ayegunle       89             4665         50           3              61           24           1
13    Oba            81             2187         47           3              56           21           1
14    Oke-Oka        81             2008         43           2              57           21           1
15    Supare         73             1955         43           2              49           21           1
16    Arigidi        71             1821         42           3              53           15           0
17    Ogbagi         66             1790         38           3              44           18           1
18    Oke-Agbe       64             1763         42           3              46           14           1
19    Ikaram         67             2111         42           3              51           12           1
20    Irun           78             2186         43           3              56           19           0
      TOTAL          1735           50661        965          58             1206         454          17

      The monthly airborne pollen concentrations showed three discernible periods of pollen
      variability in the atmosphere: February - June (dry season to early rainy season); July - August
      (mid rainy season) and September – January (late rainy season to early dry season). The three
      periods of pollen abundance, variability and distribution in the atmosphere revealed that the
      highest mean concentration occurred during the late rainy season to early dry season, followed
      by the period of dry season to early rainy season and the least occurred during the mid-rainy
      season (Fig. 1).

                                                       4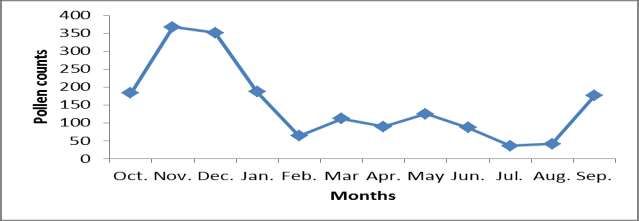
Ige & Essien ….. Int. J. Innovative Biosciences Res 9(1):1-20, 2021
Figure 1: Variation in cumulative monthly pollen counts recorded during the study period
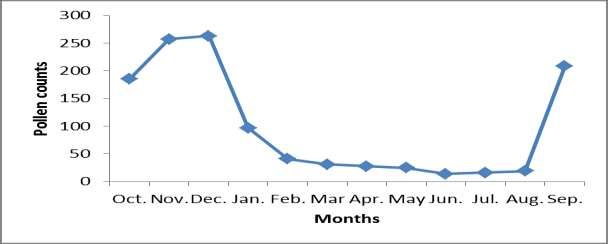
Figure 2: Variation in cumulative pollen counts recorded across the study locations
LEGEND: L1=Ifira, L2=Ipe, L3=Ipesi, L4=Isua, L5=Sosan, L6=Akunnu, L7=Auga, L8=Iboropa,
L9=Ikare, 10=Ise, L11=Akungba, L12=Ayegunle, L13=Oba, L14=Oke-Oka, L15=Supare, L16=Arigidi,
L17=Ogbagi, L18=Oke-Agbe, L19=Ikaram, L20=Irun.
There were noticeable monthly increase and decrease in the quantity of pollen types
documented. The pollen load of the entire study area varied quantitatively and qualitatively not
only from month-to-month but also from location-to-location (Fig. 2). Among the classified
plant families, highest pollen counts was recorded for Poaceae followed by Arecaceae,
Casuarinaceae and Asteraceae whereas the least count was recorded for Boraginaceae as well as
Dichapetalaceae and Leeaceae (Table 2).
5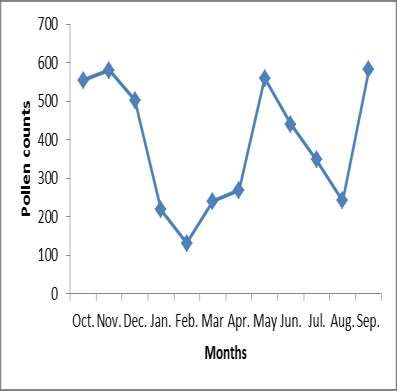
Ige & Essien ….. Int. J. Innovative Biosciences Res 9(1):1-20, 2021

Table 2: Spatial distribution of pollen types across family level for the study period (October 2016- September 2017)
S/N Plant Family                   OCT.      NOV.      DEC.       JAN.      FEB.     MAR      APR.      MAY      JUN.   JUL.   AUG.   SEP.   TOTAL
1      Acanthaceae               4         13         0        3        0         4         1        8         6        2      2      5      48
2      Amaranthaceae/            26        28         24       16       11        158       35       53        26       9      3      26     415
       Chenopodiaceae
3      Anacardiceae              1         129        236      4        0         92        192      87        2        35     51     197    1026
4      Annonaceae                1         0          2        3        0         3         15       0         0        8      3      0      35
5      Apocynaceae               3         283        0        224      26        20        8        8         2        2      0      7      583
6      Arecaceae                 350       1411       1153     400      258       639       600      330       148      123    187    379    5978
7      Asteraceae                678       955        66       155      38        15        41       80        583      85     208    152    3056
8      Bignoniaceae              3         41         41       25       0         41        0        13        8        11     0      8      191
9      Bombacaceae               25        14         6        5        4         2         19       18        13       0      3      17     126
10     Boraginaceae              0         0          0        0        0         0         0        3         0        0      0      0      3
11     Burseraceae               1         12         10       0        0         7         22       38        7        0      0      1      98
12     Caesalpinoideae           117       143        133      91       76        52        91       49        19       30     92     247    1140
13     Cannabaceae               0         0          0        15       0         7         3        1         0        0      2      1      29
14     Capparaceae               1         0          4        0        0         0         9        1         0        0      0      0      15
15     Caprifoliaceae            3         5          2        2        0         0         0        0         0        5      2      0      19
16     Caricaceae                0         0          0        0        0         0         0        0         0        0      11     31     42
17     Casuarinaceae             719       14         23       27       17        61        31       110       34       33     90     33     1192
18     Celastraceae              0         0          0        4        9         0         0        0         0        0      0      0      13
19     Chrysobalanaceae          0         0          0        0        0         31        5        11        9        0      0      0      56
20     Clusiaceae                4         2          5        0        0         8         15       5         25       29     0      2      95
21     Cochlospermaceae          0         0          0        0        0         5         0        0         30       1      0      0      36
22     Colchicaceae              0         0          0        0        0         5         7        4         2        0      3      0      21
23     Combretaceae              11        42         30       24       47        40        31       42        42       12     20     35     376
24     Commelinaceae             0         0          0        0        0         3         7        0         0        0      0      0      10
25     Connaraceae               0         0          0        0        0         4         1        11        0        0      0      0      16
26     Convolvulaceae            0         6          0        0        6         7         0        0         12       0      0      4      35

                                                                                        6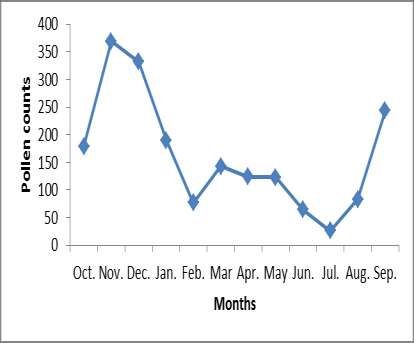
Ige & Essien ….. Int. J. Innovative Biosciences Res 9(1):1-20, 2021

27   Costaceae         0     2        0       1       0        0         0      3       2        5       0     0     13
28   Cucurbitaceae     0     0        0       0       0        4         12     3       0        0       0     5     24
29   Cyperaceae        19    13       12      10      9        17        10     116     42       25      22    26    321
30   Dichapetalaceae   0     0        0       0       0        0         0      2       3        0       0     0     5
31   Dilleniaceae      0     3        0       0       0        1         2      4       0        0       0     0     10
32   Dioscoreaceae     0     0        0       0       0        8         3      1       0        0       0     2     14
33   Diptilomiodeae    0     0        0       0       0        6         9      0       0        0       0     0     15
34   Ebanaceae         0     0        0       0       0        0         3      6       18       88      237   0     352
35   Euphorbiaceae     25    518      851     200     104      229       140    148     67       9       16    68    2375
36   Fagaceae          0     4        1       7       0        0         0      0       0        0       0     0     12
37   Gentianaceae      0     1        2       3       0        0         0      0       2        2       0     0     10
38   Hypericaceae      35    0        0       2       8        5         21     20      25       27      31    0     174
39   Irvingiaceae      -     7        4       123     15       202       29     31      2        3       3     7     426
40   Lamiaceae         113   56       91      28      31       27        9      12      35       59      34    267   762
41   Leeaceae          0     3        0       0       0        0         0      0       2        0       0     0     5
42   Linaceae          12    0        0       3       5        8         6      12      12       23      8     0     89
43   Loganiaceae       5     0        18      3       3        2         2      5       2        1       0     2     43
44   Malvaceae         35    311      60      49      164      8         9      3       19       1       34    30    723
45   Melastomataceae   41    0        0       0       0        0         0      0       11       26      21    13    112
46   Meliaceae         4     22       21      10      7        31        76     10      8        13      17    7     226
47   Mimosoideae       91    342      390     458     372      177       182    277     79       63      29    94    2554
48   Moraceae          0     50       143     161     0        277       17     12      5        0       0     19    684
49   Myristicaceae     0     61       21      32      0        0         0      0       0        0       0     10    124
50   Myrtaceae         80    72       3       9       5        49        49     253     28       17      60    30    655
51   Ochnaceae         4     9        41      6       10       15        14     14      2        0       4     4     123
52   Olacaceae         2     0        5       7       7        2         0      0       0        0       2     4     29
53   Pandaceae         1     5        13      11      0        36        21     10      0        0       1     2     100
54   Papilionoideae    11    15       16      0       3        29        19     12      13       0       0     6     124

                                                                     7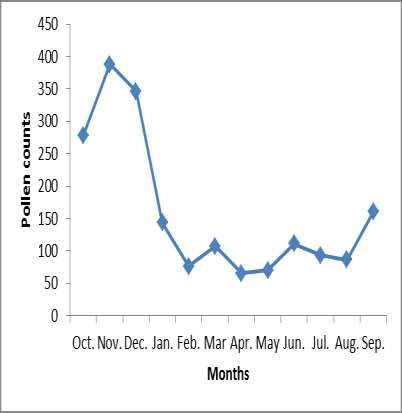
Ige & Essien ….. Int. J. Innovative Biosciences Res 9(1):1-20, 2021

55   Passifloraceae   0      0       0        0       0       0         1      4        2       0         0      0      7
56   Pedaliaceae      0      72      15       15      0       0         0      0        0       0         0      125    227
57   Phyllanthaceae   44     61      435      122     41      60        69     247      59      28        28     36     1230
58   Pinaceae         9      0       7        4       0       1         4      4        1       2         5      2      39
59   Plumbaginaceae   11     0       0        0       0       0         0      0        0       0         3      7      21
60   Poaceae          3109   3892    4145     1679    594     551       567    889      699     703       565    3418   20811
61   Polygalaceae     5      21      15       18      0       0         0      0        0       0         8      10     77
62   Portulacaceae    18     12      8        0       0       0         0      0        0       0         5      5      48
63   Proteaceae       1      1       0        3       3       0         0      0        0       0         1      0      9
64   Rhamnaceae       0      1       2        1       0       9         7      0        0       0         0      0      20
65   Rosaceae         7      11      3        8       0       48        22     159      12      4         12     14     300
66   Rubiaceae        73     171     162      193     5       269       37     106      21      13        48     45     1143
67   Rutaceae         4      9       41       6       10      15        14     14       2       0         4      4      123
68   Sapindaceae      2      0       5        7       7       2         16     47       24      0         2      4      116
69   Sapotaceae       1      11      5        7       0       27        18     10       0       0         1      2      82
70   Solanaceae       28     4       406      4       2       10        12     4        33      6         5      16     530
71   Sterculiaceae    16     129     44       133     39      50        57     243      26      22        23     145    927
72   Urticaceae       26     25      20       18      0       0         0      0        0       0         14     19     122
73   Verbenaceae      9      9       3        3       3       0         0      0        0       0         3      3      33
74   Indeterminata    1      2       7        1       6       1         4      4        1       5         3      4      39
     TOTAL            5789   9023    8750     4343    1945    3380      2594   3557     2225    1530      1926   5600   50661

                                                                    8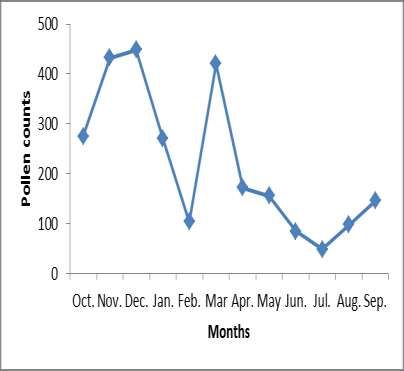
Ige & Essien ….. Int. J. Innovative Biosciences Res 9(1):1-20, 2021

Statistical analysis of the mean monthly pollen counts showed that there was a significant
difference (P
Ige & Essien ….. Int. J. Innovative Biosciences Res 9(1):1-20, 2021

Table 4: Mean pollen grains counts recorded at the study locations
Study Locations                Mean Pollen grains±S.E
Ayegunle                       2.07±0.45d

Ipesi                          1.64±0.25cd

Ipe                            1.54±0.27bcd

Ifira                          1.51±0.21abcd

Akungba                        1.31±0.25abc

Isua                           1.28±0.20abc

Akunnu                         1.19±0.18abc

Iboropa                        1.14±0.19abc

Auga                           1.05±0.17abc

Oba                            0.97±0.19abc

Irun                           0.97±0.19abc

Sosan                          0.97±0.17abc

Ikare                          0.94±0.18abc

Ikaram                         0.94±0.17abc

Oke-Oka                        0.89±0.18ab

Ise                            0.86±0.17ab

Supare                         0.86±0.16ab

Arigidi                        0.80±0.15a

Ogbagi                         0.79±0.18 a

Oke-Agbe                    0.78±0.15a
p Value                     0.000*
Means not followed by the same letter are significantly different at P
Ige & Essien ….. Int. J. Innovative Biosciences Res 9(1):1-20, 2021

The study also showed that the concentration of pollen grains in the atmosphere fluctuates
considerably with the seasons. With regards to the identified pant families, Poaceae which is
among the predominanat plant communities in the study area produces large quantities of pollen
grains which are released into the atmosphere. The variation in cumulative monthly pollen counts
of Poaceae showed that the frequency increased greatly from September, reached its peak in
November and thereafter declined progressively to a relatively low level from February. The
pollen abundance of Amaranthaceae/ Chenopodiaceae increased sharply to its highest peak in
March and declined sharply in April. From May, the pollen abundance declined again
progressively up to August, and rose again in September, maintaining a relatively stable presence
up to December before declining again to the lowest level in February. Equally, while the pollen
grains of Casuarinaceae had only one peak in October; Cyperaceae pollen had its peak in May;
the pollen of Arecaceae declined progressively from its second peak in March to July, after which
it increased again reaching its peak in December. It subsequently declined from November to
February while those of Combretaceae fluctuated considerably from the

                                               11
Ige & Essien ….. Int. J. Innovative Biosciences Res 9(1):1-20, 2021
a. Monthly pollen variation in Location 1 b. Monthly pollen variation in Location 2
c. Monthly pollen variation in Location 3 d. Monthly pollen variation in Location 4
Fig. 3: Monthly variation in spatial distribution of pollen types across study locations (a) 1 (b) 2 (c) 3 (d) 4
12Ige & Essien ….. Int. J. Innovative Biosciences Res 9(1):1-20, 2021
a. Monthly pollen variation in Location 5 b. Monthly pollen variation in Location 6
c. Monthly pollen variation in Location 7 d. Monthly pollen variation in Location 8
Fig. 4: Monthly variation in spatial distribution of pollen types across study locations (a) 5 (b) 6 (c) 7 (d) 8
13Ige & Essien ….. Int. J. Innovative Biosciences Res 9(1):1-20, 2021
a. Monthly pollen variation in Location 9 b. Monthly pollen variation in Location 10
c. Monthly pollen variation in Location 11 d. Monthly pollen variation in Location 12
Fig. 5: Monthly variation in spatial distribution of pollen types across study locations (a) 9 (b) 10 (c) 11 (d) 12
14Ige & Essien ….. Int. J. Innovative Biosciences Res 9(1):1-20, 2021
a. Monthly pollen variation in Location 13 b. Monthly pollen variation in Location 14
c. Monthly pollen variation in Location 15 d. Monthly pollen variation in Location 16
Fig. 6: Monthly variation in spatial distribution of pollen types across study locations (a) 13 (b) 14 (c) 15 (d) 16
15Ige & Essien ….. Int. J. Innovative Biosciences Res 9(1):1-20, 2021
a. Monthly pollen variation in Location 17 b. Monthly pollen variation in Location 18
c. Monthly pollen variation in Location 19 d. Monthly pollen variation in Location 20
Fig. 7: Monthly variation in spatial distribution of pollen across study locations (a) 17 (b) 18 (c) 19 (d) 20
16Ige & Essien ….. Int. J. Innovative Biosciences Res 9(1):1-20, 2021
months of February to June having high occurrences in February, May, June, and September to October.
There were noticeable monthly increase and decrease in the quantity of pollen grains recorded across the
study locations. The cumulative monthly variation in spatial distribution of pollen counts at Location 1
showed that the frequency increased steadily in September and had its highest peak in November and
thereafter declined progressively in December to February and had its second peak in the month of
March. At study Location 2, the pollen counts increases steadily up to the month of October and had its
highest peak of abundance in December and decline in January, rise in March and fluctuates steadily
between the months of April to August and had its second peak in September. Similar parttern of increase
and decrease in pollen counts were observed across the study locations (Fig. 3 to 7).
Similarly, there were also noticeable variations in the quantity and quality of pollen grains recorded
across the study locations. Possibly, differences in the density and distribution of the pollen–producing
plants over the study areas may be one of the primary factors that contributed to the observed variations in
pollen abundance. The pattern of pollen grains distribution across the locations is illustrated in Figures 3
through 7. Similar findings on the airborne pollen flora of Jabulur- the Central India were previously
reported (Al-Eisawi and Danjani, 1988; Mishra et al., 2002). Meteorological parameters were obtained
during the study period and are presented in Table 5.
Table 5: Mean meteorological data of Akoko division, Ondo State, Nigeria
Meteo. Tempe- Relative Light Wind Atmospheric Wind
parameters/ rature humidity Rainfall intensity direction pressure speed
Months (0C) (%) (mm) (W/m2) (degrees) (mbar) (m/s)
October 27.04 81.63 4.86 158.85 182.25 969.86 0.99
November 27.34 71.89 0.28 178.4 175.24 968.98 0.95
December 27.32 62.59 1.14 172.56 173.81 968.54 0.89
January 27.3 55.68 1.46 153.85 168.98 968.62 0.98
February 29.97 67.83 1.3 170.39 162.81 967.93 1.28
March 30.29 68.71 0.33 176.79 157.22 967.81 1.36
April 29.05 75.34 0.26 169.88 169.43 968.2 1.37
May 28.91 79.38 0.46 167.24 181.48 969.28 1.17
June 28.1 81.73 0.1 145.26 180.26 971.01 1.2
July 26.69 67.96 177.86 100.87 168.73 971.05 1.26
August 25.85 62.17 11.14 114.62 123.11 970.6 1.38
September 26.97 76.36 4.59 80.63 174.75 970.72 0.93
Sources: Department of Geography and Planning Sciences, Adekunle Ajasin University, Akungba-Akoko and the
Centre for Atmospheric Research, National Space Research and Development Agency, Federal Ministry of Science
and Technology, Akungba, Nigeria.
Major meteorological parameters have long been reported to influence the release, distribution and
settling of airborne pollen concentration. Naturally, temperature promotes the dehydration of anthers and
dries up pollen grains, and consequently increases the chances of anther dehiscence as well as the ease of
pollen dispersal. This may be responsible for the high number of positive correlation obtained between
some of the pollen types and air temperature. This finding compares favourably with the reports of Yates
and Sparks (1993); Barnes et al. (2001), and van Vliet et al. (2002) who related pollen increase to
increase in temperature.
The magnitude of positive or negative effect of temperature on pollen concentration has been explained
on the basis of its interaction with other meteorological parameters such as relative humidity and rainfall
(McDonald, 1980; Bicakel et al., 1999). According to Spieksma et al. (1985), the beginning of grass
(Poaceae) pollen season seems to be triggered off by a rise in temperature. However, the negative
correlation obtained has also been similarly reported by Mishra et al. (2002) and Khandelwal (1988).
17Ige & Essien ….. Int. J. Innovative Biosciences Res 9(1):1-20, 2021
Because there are more positive correlations with pollen types, it can be concluded that temperature plays
an important role in pollen release.
The decreasing effect of relative humidity on pollen concentration was noticed in this study and this may
be responsible for the negative correlation observed among some of the pollen types analysed. Airborne
pollen wash-out has been associated with high relative humidity. At high condensation, it washes out
pollen grains from the air by formation of large molecules of water droplets particularly during the early
hours of the morning. Similar findings have been reported by Bicakel et al. (1999) and Alba et al. (2000).
However, pollen release and to a greater extent dispersal has been related to daily patterns of temperature,
air current, relative humidity and electrostatic conditions (Spieksma et al., 1985).
Rainfall has been consistently reported as one of the major meteorological factors that lower the
concentration of airborne pollen grains by atmospheric washout and acceleration of the process of their
precipitation and deposition. Also the low pollen counts obtained in the months of June, July and August
may be due to atmospheric washout of pollen because these months are periods associated with constant
rainfall (Table 5). Like the relative humidity, over 75% of the analysed plants showed negative
relationship. It could then be concluded that rainfall and high relative humidity play significant roles in
decreasing atmospheric pollen content. Similar findings were also reported by Alba et al. (2000); Barnes
et al. (2001); Mishra et al. (2002); Njokuocha and Ezenwajiaku (2010).
The concentration and diversity of pollen types at any given time and place may be influenced by wind
direction relative to the location of the sampler. Because the source vegetation are not uniformly
distributed in terms of abundance, diversity, pollen production, flowering season and mode of pollination,
the distribution and concentration of pollen along any direction of the wind will be strongly influenced by
the strength of the wind along its direction both in time and space. Similar relationship and interactions
among individual pollen and plant families with meteorological parameters were observed in the study.
4. CONCLUSION
The result of monitoring spatial and temporal distribution pattern of airborne pollen grains in some
selected localities within Akoko division, Ondo State, Nigeria gives information on diurnal, seasonal and
annual variations in the pollen types and their concentration in the atmosphere. Study revealed that the
pollen load of the entire study area varied quantitatively not only from month-to-month but also from site-
to-site. The period of collection of pollen grains (in months) does not affect the dispersal mechanism and
rate of concentration in the atmosphere. For instance, the highest monthly pollen count was recorded for
the month of November and the lowest in July and August. In the same way, atmospheric pollen studies
conducted in various parts of the world showed that there were variations not only in monthly pollen
concentration, but also site-to-site variations in monthly pollen content of major individual pollen types as
regards maximum count. The study also showed that the concentration of pollen grains in the atmosphere
fluctuates considerably with the seasons. The period of pollen abundance, variability and distribution in
the atmosphere revealed that the highest mean concentration occurred during the late rainy season to early
dry season, followed by the period of dry season to early rainy season and the least occurred during the
mid-rainy season.
DISCLOSURE OF CONFLICT OF INTEREST
The authors declare that there is no conflict of interest.
REFERENCES
Alba, F., Daiz de la Guardia, C. and Comtois, P. (2000). The effect of meteorological parameters on
diurnal patterns of airborne olive pollen concentration. Grana, 39: 200-208.
Agwu, C.O.C. and Akanbi, T.O. (1985). A palynological study of honey from four vegetation zones of
Nigeria. Pollen et Spores, 27:335-348.
Agwu, C.O.C. and Osibe, E.E. (1992). Airborne Palynomorphs of Nsukka during the months of February-
April, 1990. Nigerian Journal of Botany, 5:177-185.
18Ige & Essien ….. Int. J. Innovative Biosciences Res 9(1):1-20, 2021
Agwu, C.O.C. (1997). Modern pollen rain in Nsukka: An indicator of the vegetation of Nsukka Plateau.
Wurzburger Geographische Arbeiten, 92:97-115.
Agwu, C.O.C. (2001). A Study of Niger Delta Environment through air-borne palynomorphs, Port-
Harcourt, Nigeria. Palaeoecology of Africa, 27:191-205.
Al-Eisawi, D. and Danjani, B. (1988). Airborne pollen of Jordan. Grana, 27: 219-227.
Barnes, C., Pacheco, F., Landuyt, J., Hu, F. and Portnoy, J. (2001). The movement of particles in plant
communities. Aerobiologia, 17: 61-68.
Barreto, C.F., Vilela, C.G., Baptista-Neto, J.A. and Barth, O.M (2012). Spatial distribution of pollen
grains and spores in the surface sediments of Guanabara Bay, Rio de Janeiro, Brazil. Brazilian
Academy of Sciences, 84(3): 627-643.
Bicakel, A., Benliogan, D. and Erdogan, D. (1999). Airborne pollen concentration in Kutahya. Tree
Journal of Botany, 23: 75-81.
Bonnefille, R. and Riollet, G. (1980). Pollen des savanna d’Afrique orientale. Anatole Press, Paris,
France. 140pp.
Davies, M.B. (1969). Palynology and environmental history during the Quaternary period. American
Scientist, 57(3): 317-332.
Erdtman, G. (1969). Handbook of Palynology. Muntisguard, Copenhagen. 285pp.
Essien, B.C. and Agwu, C.O.C. (2013). Aeropalynological study of Anyigba, Kogi State, Nigeria.
Standard Scientific Research Essays, 1(13): 347-351.
Essien, B.C. (2014). A comparative analytical study of airborne pollen grains, spores and other
palynomorphs within Grimard Catholic hospital, Anyigba, Kogi State, Nigeria. Scholarly Journal
of Scientific Research and Essay, 3(5): 56-60.
Essien, B.C., Ige, O.E. and Ekeyi, D. (2016). Recent pollen rain in Anyigba: an indicator of the vegetation
of Kogi State, Nigeria. World Journal of Biology and Medical Sciences, 3(1):82-92.
Essien, B.C. and Ige, O.E. (2020). Recent pollen analysis in Akoko environment as indicators of
the vegetation of Ondo State, Nigeria. GSC Biological and Pharmaceutical Sciences,
12(1):116-137.
Essien, B.C. (2020). The study of floral activities and flowering calendar of some selected plant
taxa in Akoko environment, Ondo State, Nigeria. GSC Advance Research and Reviews,
4(1): 59-68.
Giesecke, T., Fontana, S.L., van der Knaap, W.O., Pardoe, H.S. and Pidek, I.A. (2010). From early pollen
trapping to experiments to the Pollen Monitoring Programme. Vegetational History and
Archaeobotany, 19:247-258.
Gonzalo-Garjo, M.A., Tormo-Molina, r., Munoz-Rodriguez, A.F. and Silva-Palacios, I. (2006).
Differeces in the spatial distribution of airborne pollen concentrations at different urban locations
within a city. Journal of Investigational Allergology and Clinical Immunology, 16(1): 37- 43.
Ige, O.E. and Essien, B.C. (2019). Comparative study of dominant Aeropollen and Allergy-
related Cases in Akoko Environment, Ondo State, Nigeria. European Journal of Medical and
Health Sciences, 1(2): 1-8.
Katelaris, C.H., Burke, T.V. and Byth, K. (2004). Spatial variability in the pollen count in Sydney,
Australia: can one sampling site accurately reflect the pollen count for a region? Annals of
Allergy, Asthma and Immunology, 93(2): 131-136.
Khandelwal, A. (1988). Vertical variation of aerospora concentration at Lucknow, India. Geophytology,
18(2): 173-185.
Latorre, F. and Belmonte, J. (2004). Temporal and spatial distribution of atmospheric Poaceae pollen in
Catalonia (NE Spain) in 1996-2001. Grana, 43: 156-163.
McDonald, M.S. (1980). Correlation of air-borne grass pollen levels with meteorological data. Grana,
19:53-56.
Melia, M.B. (1984). The distribution and relationship between palynomorphs in aerosol and deep-sea
sediment off the coast of Northwest Africa. Marine Geology, 58:345-371.
19Ige & Essien ….. Int. J. Innovative Biosciences Res 9(1):1-20, 2021
Mishra, R.P., Singh, B. and Oommachan, M. (2002). Airborne pollen flora of Jabulur- the central India.
Aerobiologia, 18: 73-81.
Moore, P.D. and Webb, J.A. (1978). An illustrated guide to pollen analysis. Hodder and Stoughton, Kent-
London. 133pp.
Njokuocha, R.C. and Ukeje, H.O. (2006). The study of airborne pollen precipitation in the University of
Nigeria (Nsukka) Botanic Garden. Bio-Research, 4(2):88-93.
Njokuocha, R.C. and Ezenwajiaku, T.E. (2010). Airborne pollen flora in Aguata Local Government Area,
Anambra State, Nigeria. Nigerian Journal of Botany, 23(2): 211-224.
Norwak, M., Szymanska, A. and Grewling, I. (2012). Allergic risk zones of plane tree pollen (Platanus
sp.) in Poznan. Postepy Dermamaologii I Allergologii, 29(3): 156-160.
Pardoe, H.S., Giesecke, T., van der Knaap, W.O., Svitavaska-Svobodova, H., Kvavadze, E.V.,
Panajiotiotidis, S., Gerasimidis, A., Pidek, I.A., Zimney, M., Swieta-Musznicka, J., Latalowa, M.,
Noryskiewiez, A.M., Bozilova, E., Tonkov, S., Filipova-Marinova, M.V., vvan Leeuwen, J.F.N.
and Kalnipa, L. (2010). Comparing pollen spectra from Modified Tauber Traps and Moss
samples: example from a selection of woodlands across Europe. Vegetational History and
Archaeobotany, 19:271-283.
Patton, M.Q. (1990). Quantitative evaluation and research methods (2nd Ed.). Sage Publications,
Newbury Park, CA. 523pp.
Patrick, T.M., Kershaw, A.P. and Grindrod, J. (2005). Pollen transport and deposition in riverine and
marine environments within the humid tropics of North-Eastern Australia. Review of
Palaeobotany & Palynology, 134(1-2): 55-69.
Shubharani, R., Roopa, P. and Sivaram, V. (2013). Pollen morphology of selected bee forage plants.
Global Journal of Bio-Science and Biotechnology, 2(1): 82- 90.
Sowunmi, M.A. (1995). Pollen of Nigerian plants II. Grana, 34:120-141.
Spieksma, F.T.M., Assem, D.V.A., and Colleta, A.J.B. (1985). Airbone pollen concentration in Leiden,
The Netherlands, 1977-1981-Poaceae (grasses) variations and relation to hay fever. Grana,
24:99-108.
Subiza, J., Cabrera, M., Valdivieso, R., Subiza, J.L., Jerez, M., Jimenez, J.A., Naegenes, M.J. and Subiza,
E. (1994). Seasonal asthma caused by airborne Platanus pollen. Clin. Exp. Allergy, 24: 1123-
1129.
Tauber, H. (1977). Investigations of aerial pollen transport in a forested area. Dansk Botanisk Arkiv,
32(1):1-121.
Tauber, H. (1974). A static non-overload pollen collector. New Phytology, 73:359-369.
van Vliet, A.J.H., Overeem, AA., De Groot, R.S., Jacobs, A.F.G. and Spieksma, F.T.M. (2002). The
influence of temperature and climate change on the timing of pollen release in the Netherlands.
International Journal of Climatology, 22: 1757-1767.
Yates, I.E. and Sparks, D. (1993). Environmental regulation of anther dehiscence and pollen germination
in pecan. Journal of the American Society for Horticultural Science, 118(6): 699-706.
20You can also read