Clinical characteristics and predictors of pneumonia in patients presenting fever or respiratory symptoms with normal or low leukocyte counts: a ...
←
→
Page content transcription
If your browser does not render page correctly, please read the page content below
Clinical characteristics and predictors of pneumonia in
patients presenting fever or respiratory symptoms with
normal or low leukocyte counts: a retrospective study
Chunting Wang
Peking Union Medical College Hospital https://orcid.org/0000-0002-8240-1275
Jihai Liu
Peking Union Medical College Hospital
Yan Li
Peking Union Medical College Hospital
Jiangshan Wang
Peking Union Medical College Hospital
Shengyong Xu
Peking Union Medical College Hospital
Jun Xu
Peking Union Medical College Hospital
Yi Li
Peking Union Medical College Hospital
Xuezhong Yu
Peking Union Medical College Hospital
Huadong Zhu ( huadongzhu@hotmail.com )
Research article
Keywords: pneumonia, fever, respiratory symptom, C-reactive protein, predictor
DOI: https://doi.org/10.21203/rs.3.rs-26706/v1
License: This work is licensed under a Creative Commons Attribution 4.0 International License. Read Full License
Page 1/15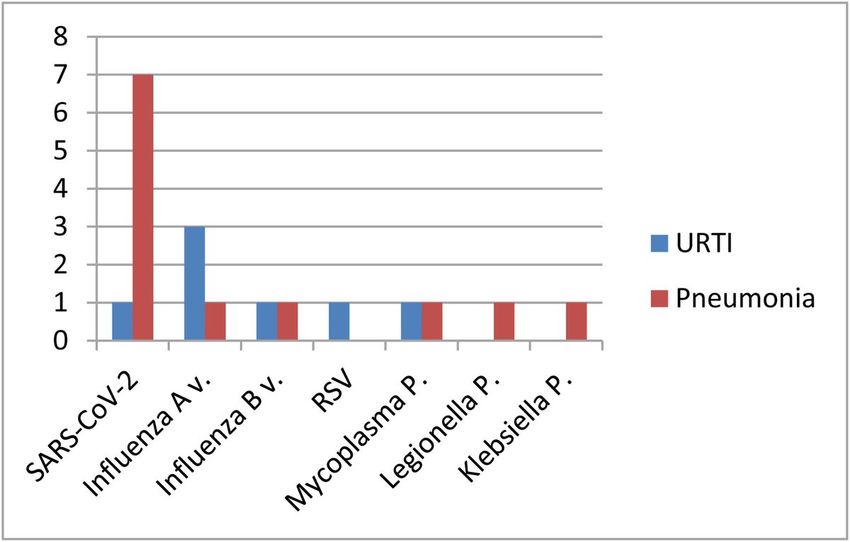
Abstract
Background
Many patients went to the hospital presenting with acute fever, or respiratory symptoms, most of whom have a normal or
low leukocyte counts. The aim of this study was to investigate the clinical characteristics and predictors of pneumonia in
those patients.

Methods
In this retrospective study, adult patients (≥ 18 years old) presenting with acute fever or respiratory symptoms with normal
or low leukocyte counts (≤ 9.5 × 10⁹/L) in Peking Union Medical College Hospital between 26 January 2020 and 10 March
2020 were included. Patients were categorized into groups with pneumonia or upper respiratory tract infection (URTI)
according to chest CT scans. Logistic regression was used to explore predictors of pneumonia.

Results
A total of 195 patients were included, 63 of whom were diagnosed with pneumonia. The median maximum body
temperature was 38.5 °C (38.0-38.8 °C) in patients with pneumonia and 37.5 °C (37.4–37.8 °C) in the other group. There
was a signi cant difference in high-sensitivity C-reactive protein (hsCRP) levels between the two groups (0.21 (0-3.74)
versus 33.4 (15.5–75.5) mg/L, p < 0.001). Multivariable regression showed that the predictive values of pneumonia were
older age (OR 1.06, 95% CI 1.02–1.10, p = 0.004), cough (OR 0.18, 95%CI 0.06–0.56; p = 0.003), higher temperature (OR 3.36,
95%CI 1.16–9.71; p = 0.025) and higher hsCRP level (OR 1.05, 95%CI 1.02–1.09; p = 0.003). The optimal cutoff values
based on the ROC curve analysis were a temperature of 37.8 °C and a hsCRP level of 1.64 mg/L.

Conclusions
Patients with older age, cough, higher temperature and higher hsCRP level were more inclined to have pneumonia.
Temperatures higher than 37.8 °C were a potential predictor of pneumonia in patients with normal or low leukocyte counts
in the early stage. However, a hsCRP level less than 1.64 mg/L could rule out most cases of pneumonia.

Background
Fever or cough is the most common symptom of respiratory infections. Over 10 million patients visit the emergency
department because of fever or cough in the United States per year.[1] Pneumonia is in the differential diagnosis of
respiratory tract symptoms that are the most common cause of urgent emergency department visits, with high
hospitalization and mortality rates worldwide.[2–7] The diagnosis of pneumonia usually depends on symptoms and chest
imaging.[7, 8] However, it is not feasible to obtain chest radiography in all patients admitted to the hospital who present
with acute fever or respiratory symptoms. Since delays in correct diagnosis increase the risk of poor outcomes[9], it is
crucial to identify clues that indicate pneumonia at the rst visit. Thus, physicians can differentiate pneumonia and ensure
appropriate treatment and disposition at an earlier time.

Previous studies identi ed some predictors of pneumonia, such as higher temperature and higher C-reactive protein (CRP)
level. In a cohort study of 28 883 adult participants with acute cough, 720 had a chest radiograph within the rst 7 days[10].
In total, 115 patients were radiographically diagnosed with pneumonia. The results showed that a temperature > 37.8 °C,
crackles on auscultation, oxygen saturation < 95% and pulse > 100 beats per minute were predictors of pneumonia.[10] A
recent meta-analysis evaluating the accuracy of biomarkers such as CRP and procalcitonin in patients with acute cough or

                                                          Page 2/15
suspected CAP showed that CRP was the preferred biomarker for the diagnosis of outpatient CAP with a positive likelihood
ratio (+ LR) and a negative likelihood ratio (-LR) of 2.08 and 0.32, respectively, for a cutoff value of 20 mg/L; 3.64 and 0.36,
respectively, for a cutoff value of 50 mg/L; and 5.89 and 0.47, respectively, for a cutoff value of 100 mg/L.[11] However, the
best indicator of pneumonia in patients with normal or low leukocyte counts is still unknown.
With the emergence and spread of severe acute respiratory syndrome coronavirus 2 (SARS-CoV-2) since December 2019,
[12–14] several patients presenting with fever or respiratory symptoms have come to hospitals. To strictly control the
spread of COVID-19 (coronavirus disease 2019), all patients with acute fever (axillary temperature ≥ 37.3 °C) or respiratory
symptoms were required to go to the fever clinic of Peking Union Medical College Hospital. Additionally, patients with an
epidemiological history of COVID-19 (de ned as: 1) a history of travel to or residence in Wuhan and its surrounding areas
and communities with reported cases within 14 days before the onset of disease; 2) contact with suspected or con rmed
COVID-19 patients within 14 days before disease onset; 3) contact with patients with fever and respiratory symptoms from
Wuhan and its surrounding areas and communities with reported cases within 14 days before disease onset; and 5)
clustering onset of disease) [15]were also required to go to the fever clinic, regardless of their temperature. Most of those
patients had normal or low leukocyte counts, which may mislead physicians, resulting in the misdiagnosis of their condition
as an upper respiratory tract infection (URTI). The aim of our study was to investigate the characteristics and predictors of
pneumonia in patients with normal or low leukocyte counts.
Methods
Study design and setting
In this retrospective study, we screened patients who visited the fever clinic of Peking Union Medical College Hospital with
acute fever or respiratory symptoms between 26 January 2020 and 10 March 2020. Adult patients (age ≥ 18) with normal
or low leukocyte counts (white blood cell count ≤ 9.5 × 10⁹/L) con rmed by the laboratory were included. Demographic,
clinical and laboratory data were extracted from electronic medical records. Patients were categorized into the pneumonia
or URTI group according to chest CT scans.
Acute fever or respiratory symptoms were de ned as follows: 1) illness onset in the community within 2 weeks; 2) fever with
axillary temperature ≥ 37.3 °C; 3) respiratory symptoms presenting as sore throat, cough, sputum, or shortness of breath;
and 4) no other obvious cause.
Pneumonia was diagnosed in our study when the above criteria were met, and new pulmonary in ltrate was con rmed on
chest CT.
Patients were excluded if 1) they were aged < 18 years; 2) they had been hospitalized during the last 28 days; 3) they had
taken antibiotics before admission; and 4) they had respiratory symptoms were de nitely attributed to diseases such as
tuberculosis, chronic obstructive pulmonary disease, asthma, interstitial lung disease, lung cancer, pulmonary embolism,
and heart failure.
This study was approved by the institutional review board committee of Peking Union Medical College Hospital (Approved
Number: S-K1144).
Data Collection
Demographic, clinical, laboratory data, treatment and outcome data for all patients were extracted from electronic medical
records using formatted case record forms by physicians and checked by another researcher.
Page 3/15Complete blood cell counts and chest CT were performed in all patients. The results of routine blood examinations,
including renal and liver function tests and the measurements of the levels of creatine kinase, lactate dehydrogenase, and
hsCRP, were collected.
Pathogens in respiratory specimens were examined by real-time polymerase chain reaction (RT-PCR) for common
respiratory viruses (such as in uenza and RSV) in most patients and in sputum culture for bacteria or fungi in a few
patients. Blood serum was tested for Mycoplasma pneumoniae and Legionella pneumophila in patients who were
suspected of having these diseases. Given the ongoing COVID-19 epidemic, all patients were tested for SARS-CoV-2 test
using next-generation sequencing or RT-PCR methods.
Statistical analysis
The results are presented as the median (IQR) and n (%). The differences between the pneumonia and URTI groups were
assessed with the Mann-Whitney U test, the χ² test, or Fisher’s exact test, as appropriate. To explore the predictors of
pneumonia, we used logistic regression, and variables signi cant at a two-tailed p value of < 0.001 in the univariate analysis
were included in the multivariable regression model. A two-tailed p value < 0.05 was considered statistically signi cant.
Statistical analyses were performed using SPSS software (version 19.0).
To determine the accurate cutoff values of predictors of pneumonia, receiver operating characteristic (ROC) curve analysis
was performed with an online statistical calculator (www.medcalc.org).
Results
Study population
A total of 3128 patients were screened at the fever clinic of Peking Union Medical College Hospital between 26 January
2020 and 10 March 2020. Forty-three percent (1345) presented with acute fever or respiratory symptoms. A total of 866
patients underwent both complete blood cell counts and chest CT scans, of whom 392 had normal or low leukocyte counts.
A total of 197 were excluded because they met one of the exclusion criteria, as described in the methods. A total of 195
patients were included in the nal analysis. Of these patients, 32% (63) were diagnosed with pneumonia by chest CT
(Fig. 1).
Clinical and Laboratory Characteristics
The demographic and clinical characteristics are provided in Table 1. The median age of all patients was 35 years (IQR 29–
42), ranging from 18 years to 86 years, and females accounted for more than half (59%). Comorbidities were more
commonly seen in patients with pneumonia than in those with URTIs. Compared with patients with URTIs, patients
diagnosed with pneumonia had a lower pulse oxygen saturation level (98% (97–100%) versus 99% (98–100%), p < 0.001)
and higher maximum body temperature (38.5 °C (38.0-38.8 °C) versus 37.5 °C (37.4–37.8 °C), p < 0.001), especially
temperatures higher than 37.8 °C (p < 0.001). Eight patients were found to have pneumonia without fever in the study. The
incidences of cough and sputum production were higher in patients with pneumonia than in those with URTIs (73% versus
32%, 41% versus 14%, p < 0.001). The median duration from fever onset to clinic visit was 2 days, with a signi cant
difference between the two groups. Similarly, the duration from illness onset to clinic visit was longer in the pneumonia
group than in the URTI group (1 (1–4) versus 3 (2–4) days, p < 0.001).
Page 4/15Table 1
Demographic, clinical and laboratory ndings
Total URTI Pneumonia p value
(n = 195) (n = 132) (n = 63)
Demographics and clinical characteristics
Age, years 35(29–42) 32(27–39) 40(34–60) < 0.001
Sex
Female 116(59%) 81(61%) 35(56%) 0.440
Male 79(41%) 51(39%) 28(44%)
Comorbidity 35(18%) 18(14%) 17(27%) 0.023
Hypertension 9(5%) 3(2%) 6(10%) 0.059
Diabetes 4(2%) 2(2%) 2(3%) 0.822
Coronary heart disease 1(1%) 0 1(2%) 0.323
Carcinoma 8(4%) 3(2%) 5(8%) 0.139
Connective tissue disease 2(1%) 1(1%) 1(2%) 0.543
Other 16(8%) 10(8%) 6(10%) 0.643
Pulse ≥ 125 beats per min 22(11%) 11(8%) 11(18%) 0.088
Systolic blood pressure, mmHg 129(118–138) 129(116–140) 128(120–138) 0.986
Pulse oxygen saturation at visit, % 99(98–100) 99(98–100) 98(97–100) < 0.001
Fever(Temperature ≥ 37.3 °C) 179(92%) 124(94%) 55(87%) 0.161
Maximum body temperature, °C 37.7(37.5–38.2) 37.5(37.4–37.8) 38.5(38.0-38.8) < 0.001
≥37.8 °C 84/179(47%) 37/124(30%) 47/55(85%) < 0.001
Sore throat 50(27%) 35(27%) 15(24%) 0.686
Cough 88(45%) 42(32%) 46(73%) < 0.001
Sputum 44(23%) 18(14%) 26(41%) < 0.001
Shortness of breath 14(7%) 9(7%) 5(8%) 0.773
Myalgia 42(22%) 26(20%) 16(25%) 0.365
Headache 44(23%) 29(22%) 15(24%) 0.774
Diarrhoea 11(6%) 9(7%) 2(3%) 0.484
Duration from fever onset to visit, days 2(1–4) 1(1–3) 3(1–4) 0.001
Duration from illness onset to visit, days 2(1–4) 1(1–4) 3(2–4) < 0.001
Laboratory ndings
White blood cell count, ×109 per L 6.45(5.39–7.86) 6.51(5.53–7.77) 6.36(4.90–8.17) 0.466
Data are median(IQR), n%, or n/N%. p values were calculated by the Mann-Whitney U test, the χ² test, or Fisher’s exact
test, as appropriate. Abbreviation: URTIs = upper respiratory tract infections, NLR = neutrophil-to-lymphocyte ratio, ALT =
alanine aminotransferase, LD = lactate dehydrogenase, hsCRP = high sensitivity C-reactive protein.
Page 5/15Total URTI Pneumonia p value
(n = 195) (n = 132) (n = 63)
Lymphocyte count, ×109 per L 1.46(1.08–1.93) 1.61(1.19–2.03) 1.17(0.79–1.48) < 0.001
NLR 2.93(1.92–4.42) 2.64(1.75–3.78) 3.63(2.70–5.26) < 0.001
Hemoglobin, g/L 141(130–152) 139(130–152) 142(129–149) 0.747
Platelet count, ×109 per L 224(186–258) 227(193–260) 210(165–248) 0.015
Albumin, g/L 45(42–48) 46(44–49) 43(40–46) < 0.001
ALT, U/L 12(8–24) 12(8–17) 15(9–35) 0.089
Creatinine, µmol/L 71(60–85) 68(59–82) 75(63–89) 0.044
LD, U/L 165(141–199) 161(141–187) 191(158–216) 0.010
hsCRP, mg/L 1.7(0-24.62) 0.21(0-3.74) 33.4(15.5–75.5) < 0.001pneumonia were admitted to our hospital. Mechanical ventilation was implemented in one of these inpatients. All patients
with pneumonia in this study survived.
Predictors of Pneumonia
We used logistic regression analysis to explore the predictive values of pneumonia (Table 2). In univariable analysis, age,
pulse oxygen saturation level, maximum body temperature, cough, sputum production, duration from illness onset to visit,
lymphocyte count, NLR, albumin level, lactate dehydrogenase level, and hsCRP level showed an increased association with
pneumonia. We chose variables with p < 0.001 in the univariable analysis for inclusion in the multivariable regression model
to investigate predictors of pneumonia. Our study found that older age (OR 1.06, 95% CI 1.02–1.10, p = 0.004), cough (OR
0.18, 95%CI 0.06–0.56; p = 0.003), higher temperature (OR 3.36, 95%CI 1.16–9.71; p = 0.025) and higher hsCRP level (OR
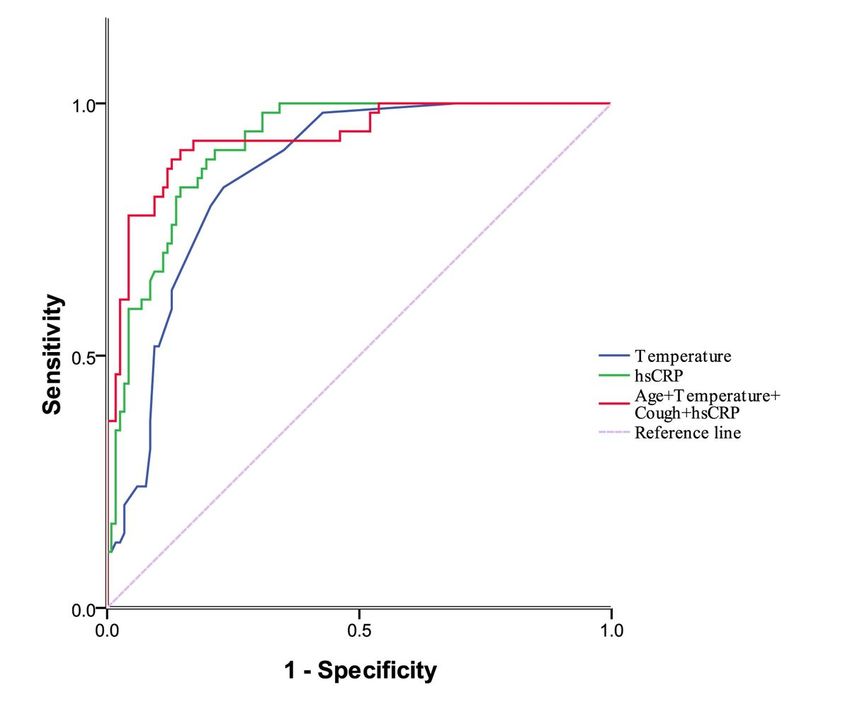
1.05, 95%CI 1.02–1.09; p = 0.003) were predictive of pneumonia. To calculate accurate cutoff values, ROC curves were
generated. The results showed that the area under the ROC curve was 0.85 (95% CI 0.79–0.90) for temperature and 0.90
(95% CI 0.85–0.94) for hsCRP level. When age, cough, temperature and hsCRP were included in the ROC analysis, the AUC
increased to 0.93 (95% CI 0.89–0.97), with a sensitivity of 90.7% and a speci city of 85.5% (Fig. 3). A cutoff value of
37.8 °C was predictive for pneumonia, with a sensitivity of 81.8% and speci city of 75.8%. A hsCRP level of 1.64 mg/L had
a negative likelihood ratio of 0.07, with a sensitivity of 95.0% and a speci city of 70.4% (Table 3).
Table 2
Logistic regression analysis to explore predictors of pneumonia
Univariable p value Multivariable p value
OR (95% CI) OR (95% CI)
Age, years 1.06(1.04–1.09) < 0.001 1.06(1.02–1.10) 0.004
Pulse oxygen saturation at visit, % 0.62(0.49–0.78) < 0.001 0.78(0.49–1.24) 0.287
Maximum body temperature, °C 6.09(3.29–11.28) < 0.001 3.36(1.16–9.71) 0.025
Cough 0.17(0.09–0.34) < 0.001 0.18(0.06–0.56) 0.003
Sputum 0.23(0.11–0.46) < 0.001 1.29(0.28–5.87) 0.746
Duration from fever onset to visit, days 1.11(0.98–1.25) 0.11
Duration from illness onset to visit, days 1.13(1.01–1.26) 0.035
Lymphocyte count, ×109 per L 0.38(0.22–0.65) 0.001
NLR 1.17(1.04–1.31) 0.007
Albumin, g/L 0.79(0.71–0.86) < 0.001 0.91(0.76–1.09) 0.322
Lactate dehydrogenase, U/L 1.01(1.00-1.02) 0.019
hsCRP, mg/L 1.07(1.04–1.09) < 0.001 1.05(1.02–1.09) 0.003
OR = odds ratio, CI = con dence interval, NLR = neutrophil-to-lymphocyte ratio, hsCRP = high sensitivity C-reactive protein.
Page 7/15Table 3
AUC, sensitivity, speci city of predictors based on ROC analysis
n/N(%) AUC(95%CI) Cut-off Sensitivity% Speci city% +LR -LR
(95%CI) (95%CI) (95%CI) (95%CI)
Temperature 179/195(92%) 0.85(0.79– 37.8 °C 81.8(69.1– 75.8(67.3– 3.38(2.40– 0.24(0.10–
0.90) 90.9) 83) 4.70) 0.40)
hsCRP 185/195(95%) 0.90(0.85– 1.64 mg/L 95.0(86.1– 70.4(61.6– 3.21(2.40– 0.07(0.02–
0.94) 99.0) 78.2) 4.20) 0.20)
AUC = area under the receiver operating characteristic curve, +LR = positive likelihood ratio,-LR = negative likelihood ratio,
hsCRP = high sensitivity C-reactive protein.
Discussion
The rapid and accurate diagnosis of patients with respiratory symptoms is a common challenge for outpatient clinicians.
When patients present with fever or respiratory symptoms and a normal leukocyte count, the diagnosis of a URTI is usually
considered rst. Our study revealed that 32% of those patients were ultimately con rmed to have pneumonia by chest CT.
Therefore, it is necessary for physicians to appropriately order chest radiography and even chest CT. In a multicenter
prospective study, researchers found that 3% of patients were found to have pneumonia on CT but not on concurrent chest
radiography.[16] These patients had similar clinical characteristics to those with pneumonia on chest radiography, [16]
emphasizing the importance of chest CT.
It is crucial for physicians to recognize pneumonia in patients who present with fever or respiratory symptoms and order a
chest CT appropriately, especially during the epidemic of COVID-19. To our knowledge, this is the rst study to explore the
predictors and calculate the associated cutoff values for the identi cation of pneumonia in patients with normal or low
leukocyte counts. There were 63 patients diagnosed with pneumonia among 195 patients in our study. Older age, cough,
higher temperature and higher hsCRP level were found to be associated with pneumonia.
The median age of patients with pneumonia was 40 years (IQR 34–60) in this study, ranging from 20 years to 86 years.
With increasing age, the risk for pneumonia increased. As a previous study revealed that advanced age is one of the
independent prognostic predictors of mortality in patients with CAP, [17, 18] it was also associated with readmission[19].
Cough is a common symptom in patients presenting at the emergency department[1] and represents infectious or non-
infectious lung disease. It was identi ed in 73% of the patients with pneumonia and 32% of the patients with URTI in this
study. Pneumonia caused by some pathogens is characterized by a dry cough and even the absence of a fever[8].
Therefore, even without fever, cough was an indication of pneumonia.
It had been demonstrated in a previous study that temperature is a good predictor of pneumonia.[10] In our study, the
median maximum body temperature was 37.5 °C (IQR 37.4–37.8 °C) in the group of patients with URTI and 38.5 °C (IQR
38.0-38.8 °C) in patients with pneumonia (p < 0.001). There were 8 patients diagnosed with pneumonia without a fever. The
etiology in these 8 patients was SARS-CoV-2 in 4 patients and K. pneumonia in one patient, leaving 3 patients in whom no
pathogen was detected. Eighty-seven percent patients experienced a temperature higher than 37.3 °C. We used a cutoff
value of 37.8 °C based on the ROC analysis to predict pneumonia. This was similar to a prospective cohort study conducted
by Moore M et al. [10]. Therefore, the diagnosis of pneumonia and more examinations should be considered once the
temperature exceeds 37.8 °C.
CRP is an acute-phase protein that indicates acute in ammatory responses. It was identi ed as a predictor of pneumonia in
several studies.[11, 20–22] A CRP level ≤ 10 mg/L was useful for ruling out CAP in most patients.[11]Steurer et al found
there was no pneumonia diagnosed when the CRP levels were < 10 mg/L or if the CRP levels were between 11 and 50 mg/L
and the patient did not complain of dyspnea and fever associated with cough.[23] However, some researchers found that
Page 8/15the CRP level did not improve the prediction of pneumonia; instead, it can help clinicians make a decision regarding the use
of antibiotics. [24, 25] In contrast to previous studies[11, 20], we found that a hsCRP level of 1.64 mg/L had a negative
likelihood ratio of 0.07 in the ROC analysis, which means it was a strong predictor of the absence of pneumonia in patients
with normal or low leukocyte counts. Further investigations showed that three patients had a hsCRP level less than
1.64 mg/L in the pneumonia group, two of whom were diagnosed with COVID-19 according to the Chinese management
guidelines (version 7.0)[15]. Most cases with pneumonia had a higher hsCRP.
The overall detection rate of pathogens in this study was 10% in all patients and 19% in patients with pneumonia, which
was lower than that previously reported[26, 27]. A population-based study showed the detection of pathogens in 853 (38%)
patients, of which viruses accounted for 22%.[26] In adults, viruses, particularly in uenza, rhinovirus, and coronavirus, cause
one-third of cases of pneumonia.[28] In this study, the prevalence of viral infection was 14% in patients with pneumonia,
with SARS-Cov-2 being the most common virus, followed by in uenza virus. One important reason was that all patients
screened were outpatients, and few of them had the opportunity to undergo further etiology detection. It is worth noting that
the COVID-19 pandemic is still a crisis. [29, 30]A prospective study is needed with more examinations of pathogens in the
future.
There are several limitations of our study. First, due to the retrospective study design, there may be some selection bias. The
interpretation of our ndings might be limited by the study design and sample size. Second, there were no data about
physical examinations owing to the thick protective suits worn by medical staff, which may have resulted in missing risk
factors such as crackles that were observed in a previous study[10]. Third, this study was performed in a single-center
setting, and patients were included during the epidemic of COVID-19, which may have affected the results. However, by
including adult patients from the fever clinic of a Class A tertiary comprehensive hospital in China, we believe our study
population is representative of cases presenting with acute fever and respiratory symptoms.
Conclusions
Nearly one-third of the patients who presented with acute fever or respiratory symptoms with normal or low leukocyte
counts were con rmed to have pneumonia. The predictive values of pneumonia were older age, cough, higher temperature
and higher hsCRP level. A temperature higher than 37.8 °C was a predictor of pneumonia, and chest radiography or CT is
recommended. However, a hsCRP level less than 1.64 mg/L may help clinicians rule out most cases of pneumonia. For
patients with a de nite exposure history of COVID-19, both the detection of SARS-CoV-2 and chest CT are suggested,
regardless of body temperature and hsCRP level.
Abbreviations
CAP
community-acquired pneumonia
CI
con dence interval
COVID-19
coronavirus disease 2019
CT
computed tomography
hsCRP
high-sensitivity C-reactive protein
IQR
interquartile range
LR
Page 9/15likelihood ratio
OR
odds ratio
ROC
receiver operating characteristic
RT-PCR
real-time polymerase chain reaction
SARS-CoV-2
severe acute respiratory syndrome coronavirus 2
URTI
upper respiratory tract infection
Declarations
Ethics approval and consent to participate:
This study was approved by the institutional review board committee of Peking Union Medical College Hospital (Approved
Number: S-K1144) and informed consent was taken from all the patients.
Consent for publication
Not applicable.
Availability of data and materials
We declared that the datasets used and/or analyzed during the current study are available from the corresponding author
on reasonable request.
Competing interests:
The authors declare that they have no competing interests..
Funding:
This work was supported by Chinese Academy of Medical Sciences Innovation Fund for Medical Sciences (2020-I2M-
CoV19-002).
Authors’ contributions:
Huadong Zhu conceived the study, designed and had full access to all of the data in the study and take responsibility for
the integrity of the data and the accuracy of the data analysis. Jihai Liu, Yan Li, Jiangshan Wang and Shengyong Xu
collected data. Jun Xu, Yi Li and Xuezhong Yu provided statistical advice on study design and analyzed the data. Chunting
Wang drafted the manuscript, and all of the authors critically revised the manuscript for important intellectual content and
gave nal approval for the version to be published.
Page 10/15Acknowledgements:
None.
References
1. Rui P, Kang K. National Hospital Ambulatory Medical Care Survey: 2017 emergency department summary tables.
National Center for Health Statistics. Available from:
https://www.cdc.gov/nchs/data/nhamcs/web_tables/2017_ed_web_tables-508.pdf.
2. Mortality GBD, Causes of Death C. Global, regional, and national age-sex speci c all-cause and cause-speci c mortality
for 240 causes of death, 1990–2013: a systematic analysis for the Global Burden of Disease Study 2013. Lancet.
2015;385(9963):117–71.
3. Ramirez JA, Wiemken TL, Peyrani P, Arnold FW, Kelley R, Mattingly WA, Nakamatsu R, Pena S, Guinn BE, Furmanek SP,
et al. Adults Hospitalized With Pneumonia in the United States: Incidence, Epidemiology, and Mortality. Clin Infect Dis.
2017;65(11):1806–12.
4. Ruhnke GW, Coca-Perraillon M, Kitch BT, Cutler DM. Trends in mortality and medical spending in patients hospitalized
for community-acquired pneumonia: 1993–2005. Med Care. 2010;48(12):1111–6.
5. Quan TP, Fawcett NJ, Wrightson JM, Finney J, Wyllie D, Jeffery K, Jones N, Shine B, Clarke L, Crook D, et al. Increasing
burden of community-acquired pneumonia leading to hospitalisation, 1998–2014. Thorax. 2016;71(6):535–42.
6. de Miguel-Diez J, Jimenez-Garcia R, Hernandez-Barrera V, Jimenez-Trujillo I, de Miguel-Yanes JM, Mendez-Bailon M,
Lopez-de-Andres A. Trends in hospitalizations for community-acquired pneumonia in Spain: 2004 to 2013. Eur J Intern
Med. 2017;40:64–71.
7. Cao B, Huang Y, She DY, Cheng QJ, Fan H, Tian XL, Xu JF, Zhang J, Chen Y, Shen N, et al. Diagnosis and treatment of
community-acquired pneumonia in adults: 2016 clinical practice guidelines by the Chinese Thoracic Society, Chinese
Medical Association. Clin Respir J. 2018;12(4):1320–60.
8. Prina E, Ranzani OT, Torres A. Community-acquired pneumonia. Lancet. 2015;386(9998):1097–108.
9. Metlay JP, Fine MJ. Testing strategies in the initial management of patients with community-acquired pneumonia. Ann
Intern Med. 2003;138(2):109–18.
10. Moore M, Stuart B, Little P, Smith S, Thompson MJ, Knox K, van den Bruel A, Lown M, Mant D. Predictors of pneumonia
in lower respiratory tract infections: 3C prospective cough complication cohort study. Eur Respir J 2017, 50(5).
11. Ebell MH, Bentivegna M, Cai X, Hulme C, Kearney M. Accuracy of Biomarkers for the Diagnosis of Adult Community-
acquired Pneumonia: A Meta-analysis. Acad Emerg Med. 2020;27(3):195–206.
12. Li Q, Guan X, Wu P, Wang X, Zhou L, Tong Y, Ren R, Leung KSM, Lau EHY, Wong JY, et al. Early Transmission Dynamics
in Wuhan, China, of Novel Coronavirus-Infected Pneumonia. N Engl J Med. 2020;382(13):1199–207.
13. Huang C, Wang Y, Li X, Ren L, Zhao J, Hu Y, Zhang L, Fan G, Xu J, Gu X, et al. Clinical features of patients infected with
2019 novel coronavirus in Wuhan, China. Lancet. 2020;395(10223):497–506.
14. Tian S, Hu N, Lou J, Chen K, Kang X, Xiang Z, Chen H, Wang D, Liu N, Liu D, et al. Characteristics of COVID-19 infection
in Beijing. J Infect. 2020;80(4):401–6.
15. National Health Commission of the People’s Republic of China.Chinese management guideline for COVID-19 (version
7.0). http://www.nhc.gov.cn/yzygj/s7653p/202003/46c9294a7dfe4cef80dc7f5912eb1989.shtml. pdf (accessed Mar
6, 2020; in Chinese).
16. Upchurch CP, Grijalva CG, Wunderink RG, Williams DJ, Waterer GW, Anderson EJ, Zhu Y, Hart EM, Carroll F, Bramley AM,
et al. Community-Acquired Pneumonia Visualized on CT Scans but Not Chest Radiographs: Pathogens, Severity, and
Clinical Outcomes. Chest. 2018;153(3):601–10.
Page 11/1517. Han X, Zhou F, Li H, Xing X, Chen L, Wang Y, Zhang C, Liu X, Suo L, Wang J, et al. Effects of age, comorbidity and
adherence to current antimicrobial guidelines on mortality in hospitalized elderly patients with community-acquired
pneumonia. BMC Infect Dis. 2018;18(1):192.
18. Kolditz M, Braeken D, Ewig S, Rohde G. Severity Assessment and the Immediate and Long-Term Prognosis in
Community-Acquired Pneumonia. Semin Respir Crit Care Med. 2016;37(6):886–96.
19. Capelastegui A, Espana Yandiola PP, Quintana JM, Bilbao A, Diez R, Pascual S, Pulido E, Egurrola M. Predictors of
short-term rehospitalization following discharge of patients hospitalized with community-acquired pneumonia. Chest.
2009;136(4):1079–85.
20. van Vugt SF, Broekhuizen BD, Lammens C, Zuithoff NP, de Jong PA, Coenen S, Ieven M, Butler CC, Goossens H, Little P,
et al. Use of serum C reactive protein and procalcitonin concentrations in addition to symptoms and signs to predict
pneumonia in patients presenting to primary care with acute cough: diagnostic study. BMJ. 2013;346:f2450.
21. Minnaard MC, de Groot JAH, Hopstaken RM, Schierenberg A, de Wit NJ, Reitsma JB, Broekhuizen BDL, van Vugt SF,
Neven AK, Graffelman AW, et al. The added value of C-reactive protein measurement in diagnosing pneumonia in
primary care: a meta-analysis of individual patient data. CMAJ. 2017;189(2):E56–63.
22. Flanders SA, Stein J, Shochat G, Sellers K, Holland M, Maselli J, Drew WL, Reingold AL, Gonzales R. Performance of a
bedside C-reactive protein test in the diagnosis of community-acquired pneumonia in adults with acute cough. Am J
Med. 2004;116(8):529–35.
23. Steurer J, Held U, Spaar A, Bausch B, Zoller M, Hunziker R, Bachmann LM. A decision aid to rule out pneumonia and
reduce unnecessary prescriptions of antibiotics in primary care patients with cough and fever. BMC Med. 2011;9:56.
24. Hopstaken RM, Muris JW, Knottnerus JA, Kester AD, Rinkens PE, Dinant GJ. Contributions of symptoms, signs,
erythrocyte sedimentation rate, and C-reactive protein to a diagnosis of pneumonia in acute lower respiratory tract
infection. Br J Gen Pract. 2003;53(490):358–64.
25. Groeneveld GH, van 't Wout JW, Aarts NJ, van Rooden CJ, Verheij TJM, Cobbaert CM, Kuijper EJ, de Vries JJC, van
Dissel JT. Prediction model for pneumonia in primary care patients with an acute respiratory tract infection: role of
symptoms, signs, and biomarkers. BMC Infect Dis. 2019;19(1):976.
26. Jain S, Self WH, Wunderink RG, Fakhran S, Balk R, Bramley AM, Reed C, Grijalva CG, Anderson EJ, Courtney DM, et al.
Community-Acquired Pneumonia Requiring Hospitalization among U.S. Adults. N Engl J Med. 2015;373(5):415–27.
27. Holter JC, Muller F, Bjorang O, Samdal HH, Marthinsen JB, Jenum PA, Ueland T, Froland SS, Aukrust P, Husebye E, et al.
Etiology of community-acquired pneumonia and diagnostic yields of microbiological methods: a 3-year prospective
study in Norway. BMC Infect Dis. 2015;15:64.
28. Ruuskanen O, Lahti E, Jennings LC, Murdoch DR. Viral pneumonia. Lancet. 2011;377(9773):1264–75.
29. Remuzzi A, Remuzzi G. COVID-19 and Italy: what next? Lancet. 2020;395(10231):1225–8.
30. Holshue ML, DeBolt C, Lindquist S, Lofy KH, Wiesman J, Bruce H, Spitters C, Ericson K, Wilkerson S, Tural A, et al. First
Case of 2019 Novel Coronavirus in the United States. N Engl J Med. 2020;382(10):929–36.
Figures
Page 12/15Figure 1
Flow chart of patient selection
Page 13/15Figure 2
Pathogens Pathogens were identi ed in 19 patients, with 12 patients in the pneumonia group and 7 in the URTI group.
Abbreviations: In uenza A v. = In uenza A virus, In uenza B v. = In uenza B virus, Mycoplasma P.= Mycoplasma
pneumoniae, Legionella P.= Legionella pneumophila, Klebsiella P.= Klebsiella pneumonia.
Page 14/15Figure 3
ROC curve: predictors of pneumonia
Page 15/15You can also read