European PV manufacturing - does it make sense? - L. Oberbeck Institut Photovoltaïque d'Île-de-France Total Gas, Renewables and Power
←
→
Page content transcription
If your browser does not render page correctly, please read the page content below

European PV manufacturing – does it
                      make sense?
                      L. Oberbeck
                      Institut Photovoltaïque d'Île-de-France
                      Total Gas, Renewables and Power

                               May 6, 2021

                           DFBEW conference, May 6, 2021

TOTAL Classification: Restricted Distribution
TOTAL - All rights reserved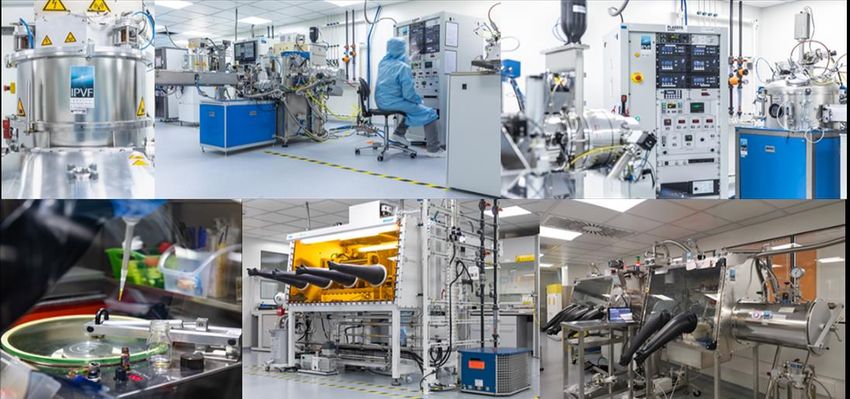
Institut Photovoltaïque d'Île-de-France IPVF

                                                Our ambition                                            Six programmes
                                                Streamline upstream research with a strong industrial
                                                foothold and operate a world-class experimental         ❖ Techno-economic and environmental assessment
                                                platform to:                                            ❖ Perovskite on c-Si tandem modules
                                                ❖ Radically improve the performances of PV modules      ❖ Low-cost III/V on c-Si tandem cells
                                                ❖ Develop disruptive PV-based technologies
                                                                                                        ❖ Advanced characterization & modeling
                                                Founding members                                        ❖ Solar to fuel
                                                                                                        ❖ PV breakthrough technologies demonstration

                                                A French Institute for Energy Transition

                           DFBEW conference, May 6, 2021

TOTAL Classification: Restricted Distribution
TOTAL - All rights reserved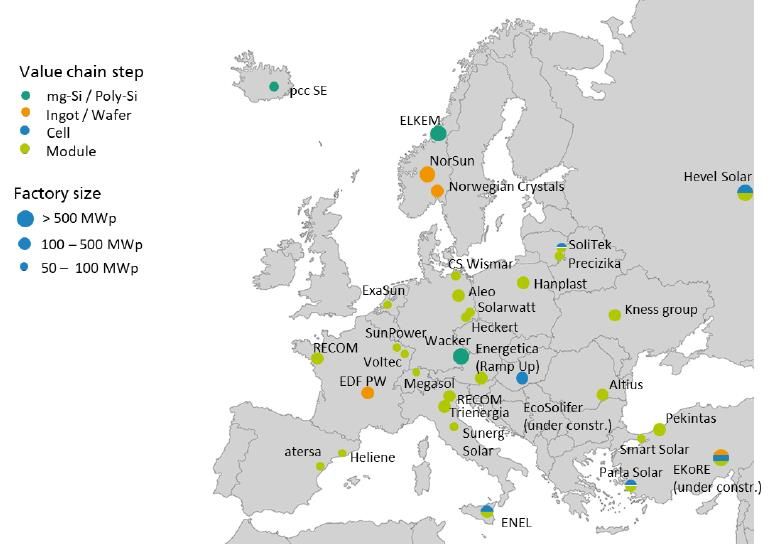
Setting the scene (1) – PV markets and manufacturing

     • Global cumulative installation ca. 760 GW by end of 2020
     • Global installation 2020 ca. 135 GW
     • Top 3 markets: China, Europe, US
     • Market segments: utility-scale (dominating), industrial & commercial,
       residential and specialty markets (floating, integrated PV, …)
     • Production capacity ca. 270 GW
     • Production strongly dominated by China

                                                      Si wafers                Cells   Modules

                 IEA PVPS, 2019

                           DFBEW conference, May 6, 2021                                         3

TOTAL Classification: Restricted Distribution
TOTAL - All rights reserved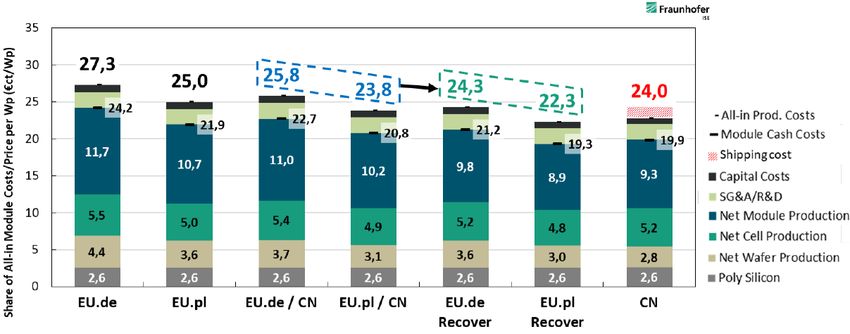
Setting the scene (2) – PV technologies and prices / costs

                                            Thin-film                                  IBC

                                                                                             Graph courtesy of Pietro Altermatt, Chen Yifeng
                                                                      22.6% Maxeon 5
                                                           Multi-Si

                                                           Mono-Si

                  • Market share of crystalline Si PV
                    technology ca. 93% in 2020
                  • Current workhorse of PV industry: PERC
                    (Passivated Emitter and Rear Cell),
                    module efficiency ca. 20.5% currently
                  • Module price ca. 20 c$/W
                  • Module price learning rate 40%

                           DFBEW conference, May 6, 2021                                                                                       4

TOTAL Classification: Restricted Distribution
TOTAL - All rights reserved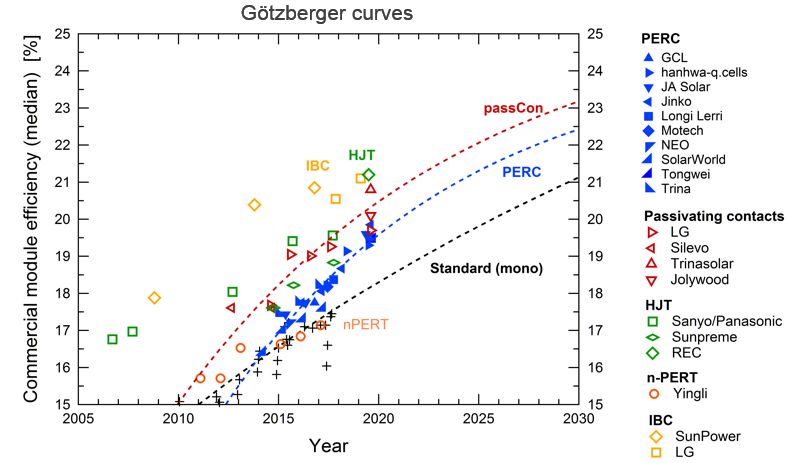
European markets and manufacturing

              Annual installations                                Annual installations                          Cumulative installations
              Europe                                              Germany                                       and plans France

                                                                                                                                           SolarPowerEurope, 2020
         • Cumulative PV installation in Europe ca. 137 GW, annual growth of
           13-23% expected
         • Cumulative PV installation in Germany ca. 55 GW (largest PV fleet in
           Europe), ca. 6 GW installations expected for 2021
         • Cumulative PV installation in France ca. 10 GW, ambitious targets of
           up to 44 GW by 2028
         • Current PV production in Europe: mainly small-scale (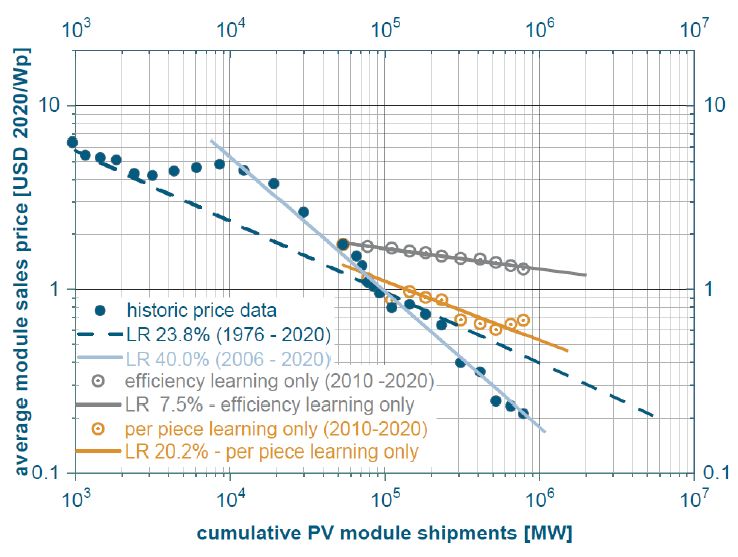
PV technology options for manufacturing in Europe
                                                                                        Expected evolution of market shares of different
                                                                                                    solar cell technologies

      Five PV technology options for European manufacturing:

      • PERC (current standard technology)

      • Pathways to higher PV module efficiencies >22%

               o Upgrade of existing PERC production lines:
                      passivated contact technologies (“TOPCon”
                      Tunnel Oxide Passivated Contact)

               o New production lines: silicon heterojunction
                                                                                           Technology comparison (indicative only)
                      HJT or interdigitated back-contact IBC
                                                                                          PERC           TOPCon      SHJ / IBC       Perovskite / Si
                      technologies                                                                                                      tandem

               o Market entry of novel technology expected in
                                                                    Efficiency
                                                                    potential              •              ✓            ✓✓              ✓✓✓
                                                                    Bifaciality                                                      Depending on
                      2022: perovskite on silicon tandem modules                           •              ✓         ✓✓ / •*             Si cell
                                                                    TempCo
                                                                                         •                ✓           ✓✓*              ✓✓✓
                           DFBEW conference, May 6, 2021
                                                                    Manufact.
                                                                    cost                ✓✓✓              ✓ (?)        •* (?)               ?
                                                                                                                                                       6
                                                                   *Depending on concrete process flow
TOTAL Classification: Restricted Distribution
TOTAL - All rights reserved
Cost competitiveness of European manufacturing?

                                                                        PERC 144 half-cells, bifacial module with transparent backsheet and Al frame   “Recover”: EU
                                                                                                                                                       supply chain at       Assumptions for relative differences between EU and
                                                                                                                                                       Chinese costs                 Chinese performance parameters
Competitiveness of a European PV
manufacturing chain, VDMA, 2020

                                                                                                                                                                         World market share for size of cell production fabs
                                   •   VDMA / Fraunhofer ISE study for 1 GW integrated fab (Si ingot to module) finds that PV module
                                       manufacturing in Europe can be competitive if
                                        o   transport costs add significantly to the price of imported modules (around 10%)
                                        o   European fabs reach sizes of ≥5 GW
                                        o   GW-scale supply chain returns to Europe
                                        o   environmental impact / CO2 emissions are valued
                                   •   However, some assumptions questionable and available supply chain crucial
                                   •   Note: size of cell / module fabs is growing, fabs >5 GW becoming standard over next years
                                   •   Note also: historically, PV manufacturing is a low-margin business

                                              DFBEW conference, May 6, 2021
                                                                                                                                                                                                                               7
TOTAL Classification: Restricted Distribution
TOTAL - All rights reserved
Some comments on European manufacturing

          ✓ Securing PV energy autonomy                                 − European materials supply chain needs to be re-
                                                                          established
          ✓ Large and growing European markets available
                                                                        − Difficult to compete on cost basis
          ✓ Sustainable production with European energy mix
          ✓ Creating / securing jobs in Europe, incl. supply chain      − Higher quality of manufacturing and product?
                                                                        − Financing of European fabs
          ✓ World-leading research institutes

          Other considerations:
                   • PV cell manufacturing in Asia and module manufacturing in Europe?
                   • Investment in European fabs by Asian PV manufacturers?

                           DFBEW conference, May 6, 2021
                                                                                                                         8
TOTAL Classification: Restricted Distribution
TOTAL - All rights reserved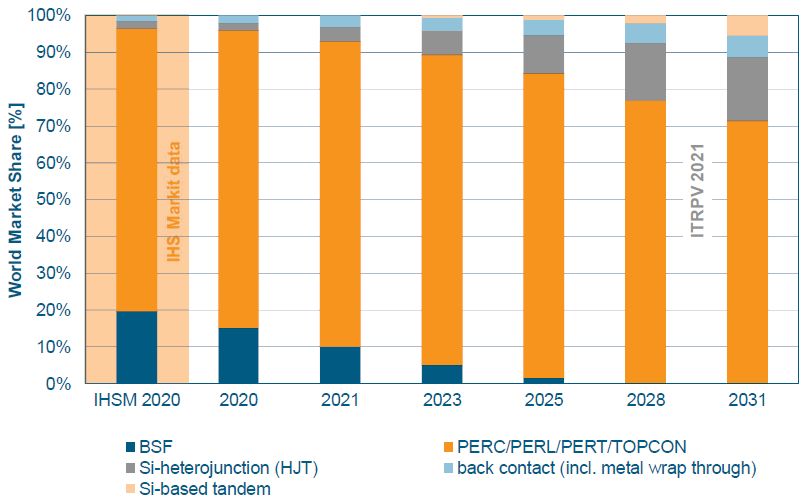
Summary and discussion points
                                                                                                               Potential PV module efficiency evolution

         • PV manufacturing largely dominated by Chinese companies

                                                                                                                                                                 W. Hoffmann, A. Metz, EUPVSEC 2019.
         • Monocrystalline Si PERC is workhorse of the PV industry, current module efficiencies
           ca. 20.5%
         • Module prices decrease with learning rate of 40%
         • Markets in Europe and world-wide are growing
         • European manufacturing mainly small-scale (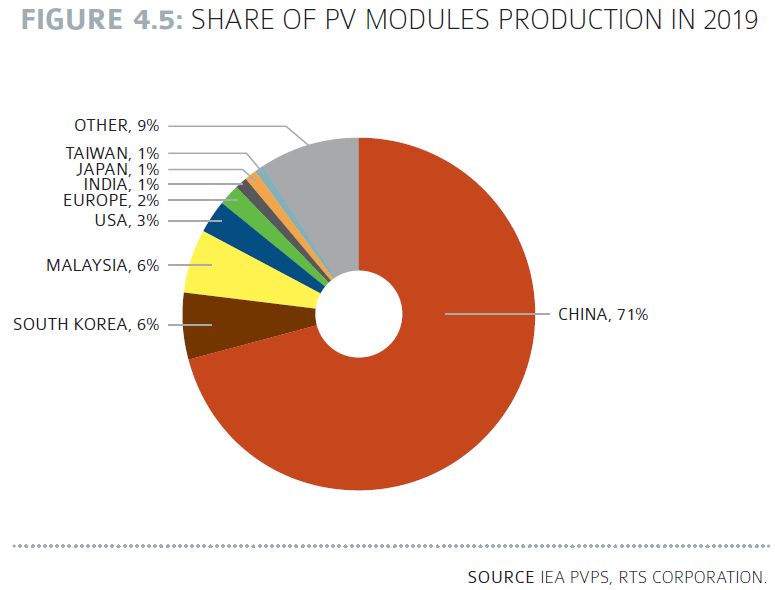
Thank you very much for
                 your attention
                 lars.oberbeck@total.com

                           DFBEW conference, May 6, 2021

TOTAL Classification: Restricted Distribution
TOTAL - All rights reserved
You can also read