The Effect of Sodium Fluoride on Prokaryotes - Jorge Reyes-Arbujas Grade 10 Central Catholic High School
←
→
Page content transcription
If your browser does not render page correctly, please read the page content below
The Effect of Sodium Fluoride on
           Prokaryotes
        Jorge Reyes-Arbujas
              Grade 10
     Central Catholic High School
Background Information • Sodium fluoride is known for its toxicity at high concentrations • The lethal human dose-32 to 64 mg/kg body weight • active ingredient in toothpaste • Fluoridation is the process of putting sodium fluoride in water to prevent tooth decay • Fluoridation has been used since the 1940s
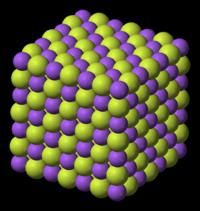
Sodium Fluoride
• Fluoride salts are used
  to enhance the
  strength of teeth by the
  formation
  of fluorapatite, a
  naturally occurring
  component of tooth
  enamel
Escherichia coli
• Large and diverse
group of gram (-)
bacteria
Surrounded by an extra
cell wall composed of
lipopolysaccharides
• Free living, symbiont,
or pathogen
• Common prokaryotic
cell modelPurpose: • To determine if sodium fluoride has an effect on E. coli survivorship.
Hypotheses:
• Null hypothesis: Sodium fluoride will not have
  a significant effect on the survivorship of E.coli

• Alternative hypothesis: Sodium fluoride will
  significantly reduce the survivorship of E. coli
Materials
o   Labeling tape                 o   Sodium
o    Ethanol                          Fluoride(0.01g/100mL)
                                  o   SDF (sterile dilution fluid)
o    Latex gloves                     (10 mM KH2PO4, 10 mM
o    E. coli DH5 Alpha                K2HPO4, 1 mM MgSO4, 0.1
o    Micropipettes                    mM CaCl2, 100 mM NaCl)
                                  o   Turntable
o    Micro rack
                                  o   Luria Broth agar plates
o    Micro tubes                  o   Bunsen burner
o    LB media (0.5% yeast         o   Vortex
    extract, 1% tryptone, 1%      o   Sidearm flask
    sodium chloride).
                                  o   Spreader bars
o   Luria Broth agar plates (to   o   Klett spectrophotometer
    be infused with sodium
    fluoride)                     o   Incubator
Liquid Pulse Procedure 1. E. Coli was grown overnight in sterile LB media. 2. Sample of the overnight culture was added to fresh media in a sterile sidearm flask 3. The culture was incubated at 37°C until a density of 50 Klett spectrophotometer units was reached (Cell density approximately 108 cells/mL) 4. The culture was diluted in a sterile dilution fluid to a concentration of approximately 105 cells/mL 5. Sodium Fluoride was with SDF to create the following experimental concentrations:
Liquid Pulse Concentration Chart
               0%      0.1%     1%      10%

SDF            9.9mL   9.89mL   9.8mL   8.9mL

Sodium         0mL     0.01mL   0.1mL   1mL
fluoride
E. Coli        0.1mL   0.1mL    0.1mL   0.1mL

Total Volume   10mL    10mL     10mL    10mL
Liquid Procedure cont.
6. 100 µL of cell culture was then added to the test
tubes, yielding a final volume of 10 mL and a cell
density of approximately 103 cells/mL
7. The solution was then mixed by vortexing and
allowed to sit at room temperature for 15 minutes
8. After vortexing to evenly suspend cells, 100 µL
aliquots were removed from the tubes and spread on
LB agar plates
9. The plates were incubated at 37°C for 24 hours
10. The resulting colonies were counted visually. Each
colony is assumed to have risen from one cellInfused Plate Procedure 1. The following volumes of NaF stock were spread onto LB agar plates to create the desired concentrations:200 microliters (10-4%) and 2 microliters(10-6%) 2. The plates were incubated at 37°C for an hour for infusion 3. 100 ul of E.coli suspension from the CONTROL TUBE were spread onto each infused plate 4. The plates were incubated overnight and the resulting colonies counted
Infused Plate Concentration Chart
                  Low      High

SDF               198 μL   0 μL

Sodium Fluoride   2 μL     200 μL
NaF Effects on E.coli
Survivorship(Liquid Pulse Experiment)
600
500
400
Colony count
300
200
100
0
0% 0.10% 1% 10%
concentrationsStatistical Analyses
• ANOVA: Single Factor • Dunnett’s Test
– Analysis of Variation – Statistical test that
– Statistical test that compares an
compares the means of experimental group
multiple groups directly to the control
– P-value from ANOVA group
testing identifies – Identifies that the
significance if P-value is experimental group is
< 0.05 significantly different
than the control if t-
value > t-critLiquid Pulse-ANOVA
• The P-Value
Anova: Single Factor shows that
SUMMARY there is no
Groups Count Sum Average Variance
Column 1
Column 2
8
8
4744
4722
593
590.25
32.57143
30.78571
significant
Column 3
Column 4
8
8
4719 589.875
4685 585.625
22.69643
49.41071 effect
ANOVA
Source of VariationSS df MS F P-value F crit
Between Groups222.625 3 74.20833 2.191229 0.111274 2.946685
Within Groups948.25 28 33.86607
Total 1170.875 31
Alpha:0.05
P-Value=0.111274NaF Effects on E.coli
Survivorship(Infused Plate Experiment)
P-Value=0.03293
600
500
400
Colony Count
300
200
100
0
0% Low High
ConcentrationsInfused Plate-ANOVA
Anova: Single Factor
SUMMARY • The P-Value shows us
Groups Count Sum Average Variance
Column 1
Column 2
3
3
1788 596 79
1793 597.6667 60.33333
that there is a
Column 3 3 1736 578.6667 17.33333
significant effect.
ANOVA
Source of VariationSS df MS F P-value F crit
Between Groups
664.2222 2 332.1111 6.359574 0.03293 5.143253
Within Groups
313.3333 6 52.22222
Total 977.5556 8
Alpha:0.05Dunnett’s Test: Infused Plate
Variable T-Value Interpretation
Concentrations
T-Crit=3.6
Sodium Fluoride Low 0.0282 Not Significant
High 3.22 No SignificantConclusions • Liquid Pulse experiment-null accepted – no significant effect revealed • Infused plate experiment –null accepted – No significant effect revealed
Limitations
• Slight lag in synchronization of plating
• Inability to count the exact amount of cells on
  each plate
• Limited sodium fluoride exposures
• Only one exposure time
• Only survivorship assessed
Future Changes
•   More trials
•   Different microbe
•   Growth curve
•   Varying exposures and exposure times
•   Synergistic effects
References • www.sciencelab.com/msds.php?msdsId=9927 595 • www.medicalnewstoday.com/articles/68511 • http://www.cdc.gov/ecoli/
You can also read