3rd quarter 2019 CEO Jacob Tveraabak | CFO Hilde Horn Gilen October 31, 2019 - StrongPoint

Page created by Ruben Snyder
 
CONTINUE READING
3rd quarter 2019 CEO Jacob Tveraabak | CFO Hilde Horn Gilen October 31, 2019 - StrongPoint
3rd quarter 2019

CEO Jacob Tveraabak | CFO Hilde Horn Gilen

October 31, 2019
3rd quarter 2019 CEO Jacob Tveraabak | CFO Hilde Horn Gilen October 31, 2019 - StrongPoint
Agenda
•   Intro
•   Highlights Q3 2019
•   Other key financial figures
•   Q&A
3rd quarter 2019 CEO Jacob Tveraabak | CFO Hilde Horn Gilen October 31, 2019 - StrongPoint
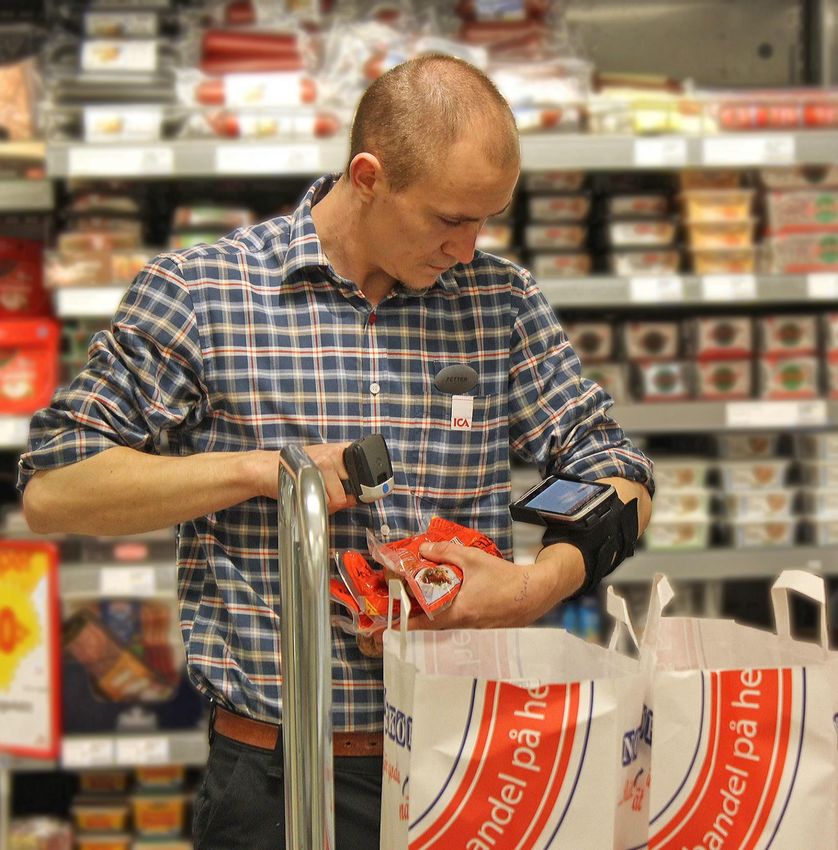
Mission

“Driving retailers
productivity by providing
innovative integrated
technology solutions”
3rd quarter 2019 CEO Jacob Tveraabak | CFO Hilde Horn Gilen October 31, 2019 - StrongPoint
Strong market fundamentals for retail technology – providing a
  “double opportunity” for StrongPoint

             Retailers’ needs                  Opportunity for StrongPoint

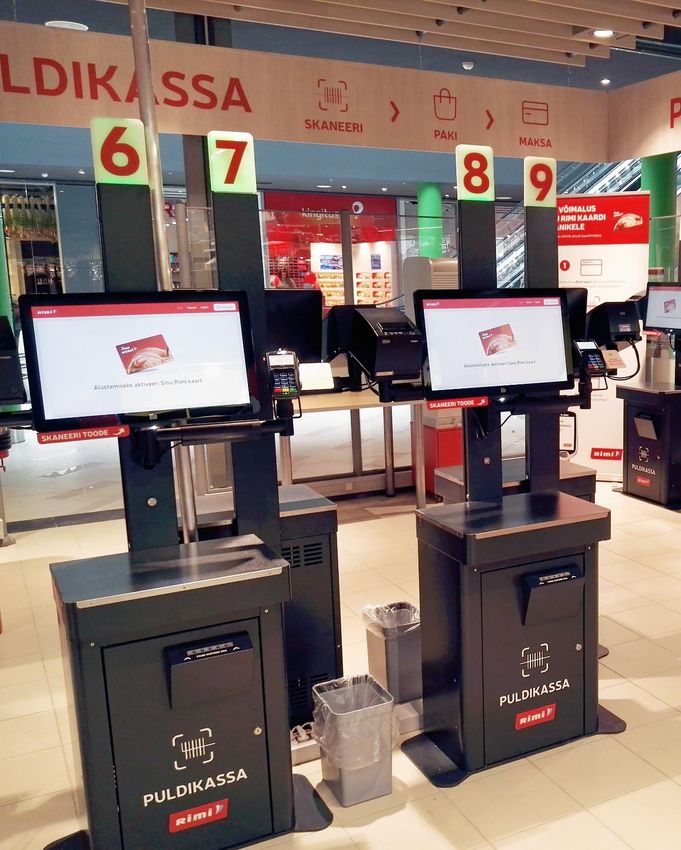
                                                Technology solutions in-store to
              1. In-store: Pressure on brick
                                                improve retailers’ productivity
                 & mortar retailers’ margin
                                                and hence uphold margins
E-commerce

                                                World-class e-commerce
              2. Incumbents: Pressure to        solutions for picking and
                 establish online presence      delivery
3rd quarter 2019 CEO Jacob Tveraabak | CFO Hilde Horn Gilen October 31, 2019 - StrongPoint
Our Solutions
3rd quarter 2019 CEO Jacob Tveraabak | CFO Hilde Horn Gilen October 31, 2019 - StrongPoint
Key focus areas

           I.     Maintain and grow relevance with retailers in
                  current key Markets (Norway, Sweden, Baltics)

           II.    Significantly grow presence with retailers in Spain
                  to mirror key Markets’ penetration

           III.   Grow e-commerce into a substantial portion of
                  StrongPoint’s business

           … and be the best owner and employer for all
           businesses under the StrongPoint-umbrella
3rd quarter 2019 CEO Jacob Tveraabak | CFO Hilde Horn Gilen October 31, 2019 - StrongPoint
Highlights Q3 2019
3rd quarter 2019 CEO Jacob Tveraabak | CFO Hilde Horn Gilen October 31, 2019 - StrongPoint
Highlights Q3 2019

1   Strong performance in
    Retail Technology, however
    overall flat performance

    Several customer breakthroughs
2
    and deliveries

3   Important milestones for
    go-to-market model
1 3rd quarter revenue: 2% growth vs. last year
     Revenue
     MNOK
                                                                              +2%
           301         307                                              308
                                                                              288   287
                                                            276
     254         258                           259
                             250                     250
                                   238                            233                     237

                                         205

     Q1 16 Q2 16 Q3 16 Q4 16 Q1 17 Q2 17 Q3 17 Q4 17 Q1 18 Q2 18 Q3 18 Q4 18 Q1 19 Q2 19 Q3 19
1 3rd quarter revenue in BAs: Strong performance in Retail Technology
 Revenue
 MNOK
 Retail Technology                                               Cash Security                                            Labels
                                              +20%
                                                     222
                            214               213
                                        196                191
                      189
183 179
                177
                                  161
          145

                                                                                                         -57%
                                                                                                    73
                                                                                                                                                                  +7%
                                                                                                                          42   46   43   44        48             43
                                                                                40                                                            41        38   39         42     40
                                                                                               36        35
                                                                 27                  22                         26
                                                                      16   20             16                         16

Q1   Q2   Q3    Q4    Q1    Q2    Q3    Q4     Q1    Q2    Q3    Q1   Q2   Q3   Q4   Q1   Q2   Q3   Q4   Q1     Q2   Q3   Q1   Q2   Q3   Q4   Q1   Q2   Q3   Q4   Q1    Q2     Q3
     2017                    2018                   2019              2017                2018                2019              2017                2018                2019
1 3rd quarter profitability: flat development vs. last year
                    EBITDA
                    MNOK

                                            36
                                 35

                                                       31                                                          +3 MNOK
                                                                                                                     28

                                                                                                              22             22
                                                                                          21
                                                                                                    18                            18
                                                                                                         15
                                                                                     14
                                                                  11                           11
                      10
                                                                                 7

                   Q1 16 Q2 16 Q3 16 Q4 16 Q1 17 Q2 17 Q3 17 Q4 17 Q1 18 Q2 18 Q3 18 Q4 18 Q1 19 Q2 19 Q3 19

Note: Quarterly figures in 2019 include positive effect of IFRS 16 of MNOK 5.7
3rd quarter profitability in BAs: Strong performance in Retail
  1 Technology
        EBITDA
        MNOK
        Retail Technology                                                    Cash Security                                                        Labels

                                      29            +15 MNOK

                                                               25    26
                                                         23

                                                                                                                           -7 MNOK
                                17
                                                                                                                        15
      14                 14
                                            11    11
             9      9                                                                                                                                                9                    -0.4 MNOK
                                                                                                                                                                9
                                                                                               6                                                                               7    7         6           6
                                                                                                                               6                            5                            5
                                                                                                                                                                          4                         4
                                                                                                                  2                   2            2

                                                                            -1           -1
                                                                                  -3
                                                                                                     -5                                     -5

      Q1     Q2    Q3    Q4    Q1     Q2    Q3    Q4     Q1    Q2    Q3                                    -9                                     Q1    Q2      Q3   Q4   Q1   Q2   Q3   Q4   Q1   Q2     Q3
                                                                           Q1     Q2    Q3     Q4    Q1    Q2     Q3    Q4    Q1     Q2    Q3
              2017                      2018                  2019                                                                                          2017                2018               2019
                                                                                   2017                       2018                 2019
Note: Quarterly figures in 2019 include positive effect of IFRS 16 of MNOK 3.6 for Retail Technology, MNOK 0.8 for Cash Security, and MNOK 1.2 for Labels
2 Several customer break-throughs and deliveries

         • ~80% growth in sale of our e-commerce solutions (yet
           from a small base) with continued deliveries to retailers
           in primary markets

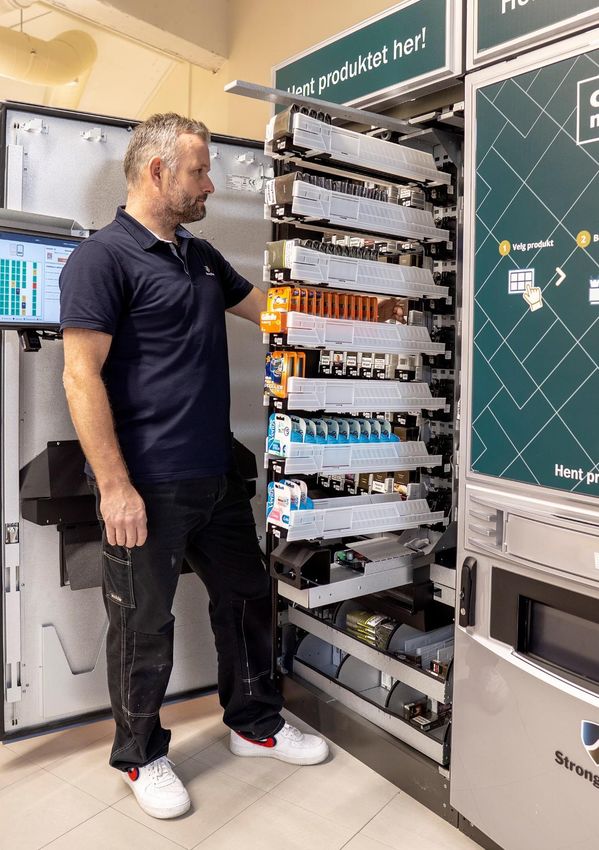
         • Delivered the first integrated automated age verification
           based on facial recognition into our Self-Checkout and
           Vensafe solutions in the Baltics

         • Completed the first installations of the new Cash
           Management solutions: Unico and Compact
3 Important milestones for go-to-market model

         • ~50% growth in Cash Management solutions through
           RoadRunners concept in Spain vs. last year, with continued
           strong interest in rental solutions (same level as Q2)

         • Partner agreement with Exclusivas Iglesias for distribution of
           StrongPoint’s solutions in Portugal
Direction and initiatives forward
  Focus! On Retail Technology; and continued utilization of Partners where that makes sense
         • Restructuring our internal partner setup; handling by operational BUs
         • Adjusting our go-to market approach in Germany

  I.     Maintain and grow relevance with retailers in key markets (Norway, Sweden,
         Baltics):
         • Strong expressed interest from customers in Reflexis, WFM & Task management system
         • Continuous exploration of 3rd party technology solutions to introduce to our key markets

  II.    Significantly grow presence with retailers in Spain:
         • Continuous recruitment to build organization and presence, primarily in Sales and Marketing
         • Operationalizing the improved value proposition for RoadRunners: Unico and Compact added to
           our Cash Management portfolio
         • Building on e-commerce momentum in Spain: significant interest in picking and delivery solutions

  III.   Grow e-commerce into a substantial portion of StrongPoint’s business:
         • Investments in E-commerce Logistics Suite (“E20”) to improve scalability of solution sales
         • Expansion of E-commerce solutions portfolio in the making
         • Recruiting Sales personnel for international growth
Other key financial figures
Earnings per share (EPS)                                                                                                                          EPS
                                                                                                                                                         EPS adjusted*

        EPS per quarter                                                                       EPS rolling 12 month

                                                                                                0,96      0,96
                                                                                                                              0,88      0,86
                                                                                                                                                  0,82
                                                                                                                    0,73

                                                                                             0,57
                                                                                                       0,54
                                                                                                                           0,48      0,48      0,48
                                                                 0,39
                                                              0,30                                               0,30
          0,27                 0,27                                        0,25
                    0,24
      0,19                                   0,17
                           0,16                                         0,16
                 0,12                                                                 0,13
                                      0,07                                        0,06
                                                       0,05

                                                    -0,05                                     Q2-18     Q3-18     Q4-18     Q1-19     Q2-19     Q3-19
       Q4-17      Q1-18     Q2-18      Q3-18          Q4-18    Q1-19     Q2-19     Q3-19

* EPS adjusted for amortisation of intangible assets, mainly from M&A
Cash Flow effects in 2019
Cash
MNOK

                    16
                                                                                  • Working Capital development
                             13                                                     mainly related to seasonal
                                              22       24                           changes in receivables and
          68                          13                                            prepaid expenses
                                                                         50
                                                                2
                                                                                  • Capex and change in debt is
                                                                                    influenced by Rental Solution
  27
                                                                                    Cash Management Spain

  Cash   EBITDA   IFRS 16   Change   Capex   Change Dividend   Other     Cash
31.12.18                      WC              debt                     30.09.19
Net leverage of 1.24x rolling 12 months EBITDA

Net Leverage multiples*                       0.98   1.17    1.10    1.09    0.81     1.44    1.22    1.24

                                                                                                               NIBD incl IFRS
Net Interest Bearing Debt                                                                                      NIBD excl IFRS
MNOK
                                                                                      65,2            56,1
                                                                                              60,7

                                                             71,1    71,8
                                                     62,3                    54,6     55,1            56,1
                                              51,4                                            45,8

                                             Q4-17   Q1-18   Q2-18   Q3-18   Q4-18   Q1-19** Q2-19** Q3-19**

* Net Interest Bearing Debt / Rolling 12 EBITDA
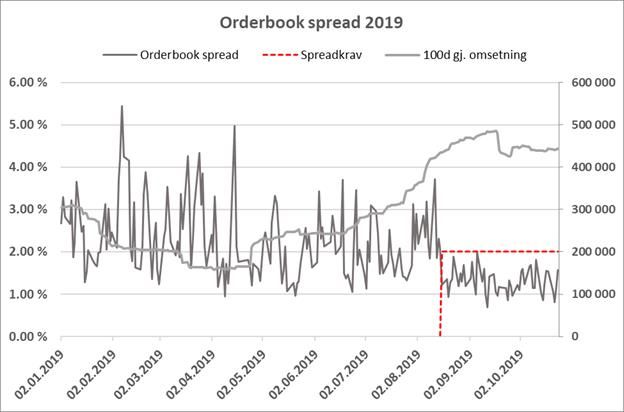
** Including IFRS 16 balance effect
Investor Relations – ambition to increase share liquidity

• Commissioned Research ABGSC
• Meetings held with current and
  potential investors
• Meetings held with Corporate
  Finance players
• Increased coverage in media
• Web-page, Social Media, Press
  Release
• Market Making agreement with
  Sparebank 1 Markets
Investor Relations

    Financial calendar 2020

    • Q4 2019 – 12.02 (Strategy Update Session)
    • Q1 2020 – 29.04 (General Assembly)
    • Q2 2020 – 14.07
    • Q3 2020 – 22.10

    IR-contact:

    CFO Hilde Horn Gilen
    hilde.gilen@strongpoint.com
    +47 920 60 158
Q&A

Jacob Tveraabak         Hilde Horn Gilen
CEO                     CFO
Thank you!
You can also read