Evaluating the Performance of Retaining Walls and Embankments - September 15, 2021
←
→
Page content transcription
If your browser does not render page correctly, please read the page content below

TRANSPORTATION RESEARCH BOARD

Evaluating the Performance of
 Retaining Walls and
 Embankments
 September 15, 2021

 @NASEMTRB
 #TRBwebinar
PDH Certification The Transportation Research Board
 has met the standards and
 Information: requirements of the Registered
 Continuing Education Providers

•1.5 Professional Development Program. Credit earned on completion
 of this program will be reported to
Hour (PDH) – see follow-up
 RCEP. A certificate of completion will
email for instructions
 be issued to participants that have
•You must attend the entire
 registered and attended the entire
webinar to be eligible to receive session. As such, it does not include
PDH credits content that may be deemed or
•Questions? Contact construed to be an approval or
TRBWebinars@nas.edu endorsement by RCEP.

#TRBwebinar

Learning Objectives
1. Identify the economy and risk management
 provided by geotechnical instrumentation
 and monitoring
2. Identify new design methods and modeling
 from instrumentation and monitoring of
 column-supported embankments
3. Discuss the interaction between wall and
 wall foundations for load support improved
 by geotechnical instrumentation of full-scale
 construction

Evaluating the Performance
 of Retaining Walls and
 Embankments

 Economy and Risk Control

 Barry R. Christopher, Ph.D., P.E.
 barryc325@aol.com
Retaining Walls

Why monitor performance?
 The real answer--

• TO SAVE MONEY
 – Save Lives
 – Minimize Damages
 – Reduce Delays

• Instrumentation answers
 questions to remove
 uncertainties
• See “Why Monitor Geotechnical Performance”
 by Marr for simplified method to help quantify
 benefits of geotechnical instrumentation.

Monitoring Schemes

• Confirm design stress levels
• Monitor safety during construction
• Allow modification of construction
 methods
• Control construction rates
Monitoring Schemes
 (cont.)

• Provide base reference for future
 designs
 - Improve design
 - Improve economy
 - Confirm performance of materials
 - Allow use of new materials
• Establish maintenance requirements

Monitor when:
undesirable outcome $ x probability of occurrence
 > monitoring $
Instruments for monitoring
 Retaining Walls & Embankments
Golden Rules of Instrumentation
 • Every instrument must have a purpose (every
 instrument should provide data to help answer a
 question)
 • Instrumentation program must be planned and
 executed in a systematic way
 • Watch the details
Principal Measurements
 • Groundwater Level and Flow
 • Lateral and Vertical Deformation
 • Strain
 • Load and Pressure
 • Time and Temperature
Ground water Piezometers Multi-point piezometers Bentonite Open standpipe Piezoresistive Grout, or Packer seal Vibrating Wire Moisture meters & Tensiometers
Deformation Measurements Crack gages Inclinometers Shape Accel Arrays • Photogrammetry • Automated Total Laser Station Extensometers Pore pressure ±1 mm in 100 m transducer Profilers Tilt meters
Strain Measurements
 (Local and Average)

Bonded Resistance &
 Vibrating wire
 Strain gages

 Adjacent
 Inclinometers

 Fiber optics with Bragg
Rod or wire extensometers grading reflectors
Load and Pressure Measurements
 Embedment
Contact Pressure Pressure Gage
 Gage
Time and Temperature

Temperature
• Thermocouples, thermistors, and weather station
Time
• Automated Continuous monitoring
 calibrates temperature effects
 Noon Day 1 2 3
• Best Instrument
 – Your eyes
 – Cameras
 (especially during
 construction)
Retaining Walls
 Two Types of Monitoring Programs

• Comprehensive Instrumentation
 Program
 – When justified by improved safety and
 reduced time, cost and/or delays.

 Limited (Minimum) Program
 – Should always be considered
Comprehensive Program Example
 (Reiner Ave. MSE wall)

 Christopher et al., 1990
Third Runway West Wall –
 135 ft tall
 SeaTac Airport Stuedlein et al., 2021
GRS-IBS Wall (VDOT)

 Note:
 RPC: Rectangular
 pressure cell,
 SG: strain gage,
 SC: settlement cell, &
 ST: survey targets

Instrumentation used to verify design for cost effective
 and easier to construct retaining wall, with reduced
 maintenance (no bump) Gebremariam et al., 2020
Comprehensive
 Monitoring
 Program
Limited Monitoring Program

• Horizontal movement of face
• Vertical movement of surface
• Local movement / deterioration of face
• Performance of supported structures

 Minimum – As built with Survey Points
 Alternates - total station pts., laser extensometers
A Reason for Monitoring Performance
 Any QUESTIONS?
References
• FHWA/NHI 13241 - Geotechnical Instrumentation
• Marr, W.A., “Why Monitor Geotechnical Performance” Seventh
 International Symposium on Field Measurements in
 Geomechanics, 2007. https://doi.org/10.1061/40940(307)4
• Christopher, B.R., Holtz, R.D. and Allen, T.M., "Instrumentation for a
 12.6 m High Geotextile-Reinforced Wall", Proceedings of the
 International Reinforced Soil Conference, British Geotechnical Society,
 Glasgow, Scotland, Sep 1990, pp 73-78.
• Stuedlein, A.W., Allen, M.S., Holtz, R.D., and Christopher, B.R.,
 “Assessment of Reinforcement Strains in Very Tall Mechanically
 Stabilized Earth Walls.” Journal of Geotechnical and Geoenvironmental
 Engineering, ASCE, 2012, pp. 345-356.
• Gebremariam, F., Tanyu, B.F., Christopher, B.R., Leshchinsky, D., Han,
 J., and Zornberg, J.G., Evaluation of Vertical Stress Distribution in Field
 Monitored GRS-IBS Structure,” Geosynthetics International, 2020.
9/14/2021

Load transfer and differential movement in
 column-supported embankments

 Liang Chern Chow, PE
 American Engineering Testing, Inc.
 September 15, 2021

 Modes of Failure

 Load transfer

These columns are
the foundations of
the embankment.

 BS Code, FHWA (2017) 2

 1
9/14/2021

Case Study #1: I-35E Cayuga Interchange
• $115 million dollar project (1 mile)
• 10 bridges, new alignment, poor soils, big fills, RR

 MnDOT 3

 Value engineering proposal
• Value engineering proposal
 – Redesign of column-supported embankments
 – Menard became Geotech Engineer of Record

 MnDOT 4

 2
9/14/2021

 CSE Mainline North

 Dense to Very Dense Sand
15 ft
 Average ϕ′ = 41 to 46°

 Stiff Clay
20 ft OCR ≈ 3.5
 Su(UC) = 1,500 psf

>30 ft Medium Dense to Dense Sand
 Average ϕ′ = 32 to 38°

 5

 Strain gage/rebar strainmeter

 Rigid inclusion column

 6

 3
9/14/2021

 7

Load cell*

 8

 4
9/14/2021

Earth pressure cell**

 9

 On top of column
 Thick‐plate EPC

 10

 5
9/14/2021

 Modes Shape
 of Failure
 Accel Arrays

 Pros Cons
 High precision Can be $$
 Large movement Need fixed ref end
 Automated Difficult to repair
 Low maintenance

 11

SAA data
plots are presented
with X and Y,
calculating the Z
value

 12

 6
9/14/2021

 3.5 years of monitoring results
 LC
 @597
 @622

 @572

 PZ
 CMC #597 SG Level
 1
 HEPC
 4 LC
 2 & SG
 3 LEPC

 PZ HEPC

 LEPC #571

 Chow, Han & Reuter (2020) 13

 Load Distribution
 CMC #572 CMC #597 CMC #622
 LC LC
 SG 1 SG 1 Dense to V
 Dense Sand
 SG 2 SG 2
 SG 3
 SG 3
 Stiff
 N.P. Clay

 SG 4
 SG 4 Sand

#622
Max load = 320 kips
Stress = 1,650 psi < 3,440 psi
 (break)
End Bearing = 190 kips
How about in soft clay?

 Chow, Han & Reuter (2020) 14

 7
9/14/2021

 Case study #2: I-35 Flyover Bridge, MN
• I-35 Forest Lake UBOL and Bridges (Letting in 2017).

• Predicted approx. 3 inch max settlement at the top of
 the LTP. Less than 0.5 inch predicted after 6 to 9
 months waiting period.

 Cayuga

 Menard DFI S3 (2019) 15

 Settlement
• Horizontal SAA placed 6 inch above top of columns

Predicted long‐term
 ~2.5m (8’ spacing)
settlement Max settlement ~9
 months after
 construction = 3.7”
 Menard DFI S3 (2019) 16

 8
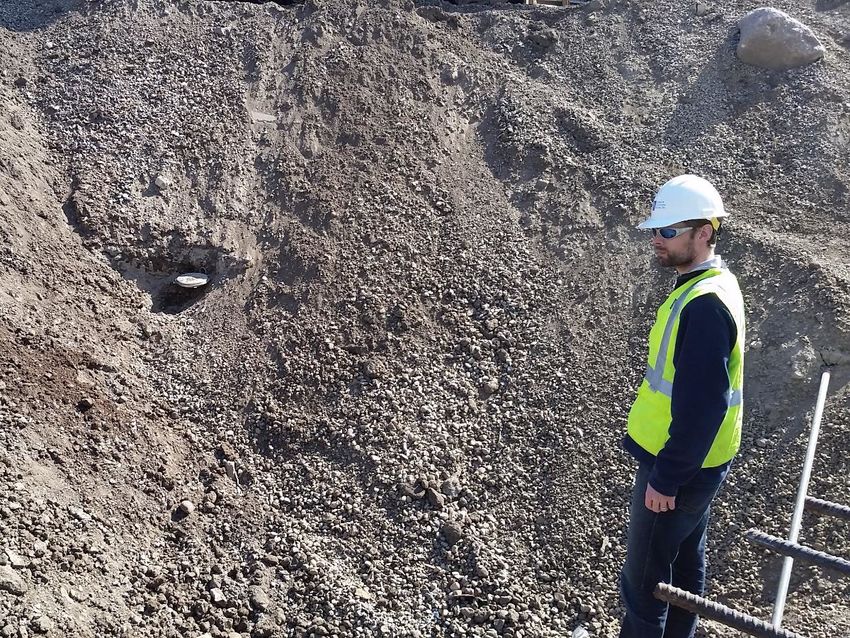
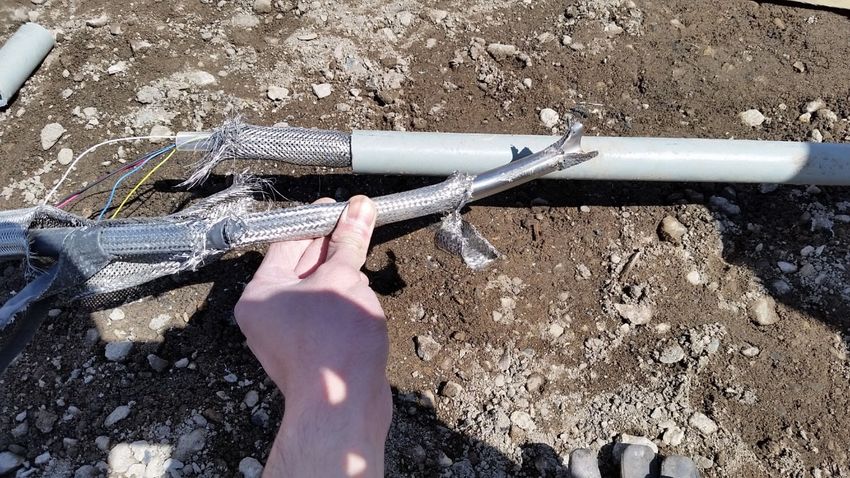
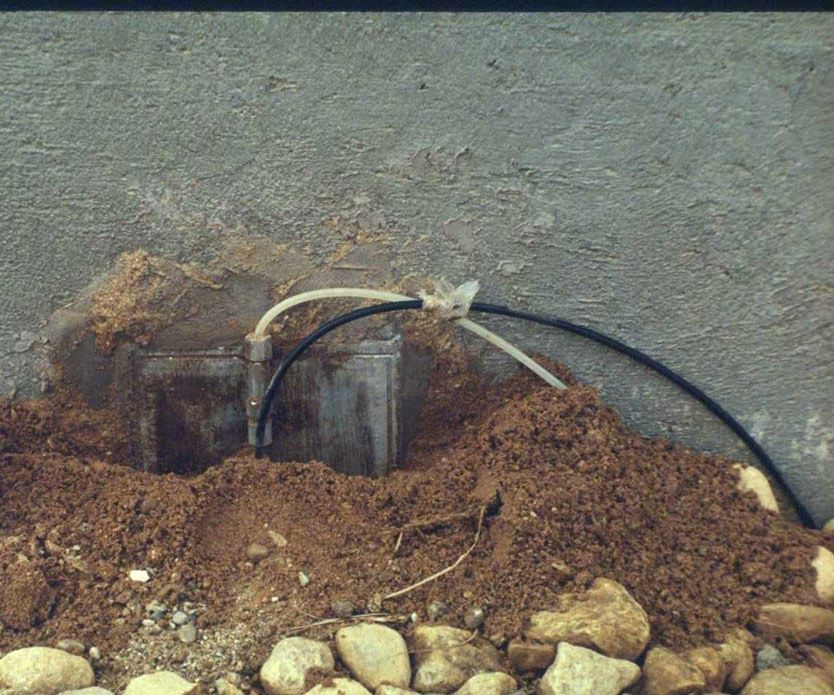
9/14/2021

 Lateral displacements

• Vertical SAA placed in front of MSE wall

 Menard DFI S3 (2019) 17

 Damages & Risks

 This doesn’t work

 18

 9
9/14/2021

 19

 Protect your investments
• Provide cable protection and cable slacks:
 – Conduit type and size, e.g. electrical vs. plumbing conduits
 – Minimum buried depth, e.g. 6 inches
 – Visible markings, GPS coordinates
• Extra sensors for redundancy, e.g. piezometer saturation
• Good planning and communications with contractor,
 subcontractors, and owner/client.

 20

 10
9/14/2021

 Closing notes
• Modes of failure is a good place to start for
 instrumentation planning.
• Presented two case studies and monitoring
 results:
 – Max. compressive stress in columns (Strain gage)
 – Validate model and design parameters
 model to understand the behavior
• Discussed potential damages and good
 practices

 21

 Acknowledgement

 Thank you
 lchow@amengtest.com

 22

 11
9/14/2021

 Instrumentation to Evaluate
Interaction between Wall and
 Foundation
 Jie Han, Ph.D., PE, F.ASCE
 The University of Kansas
 jiehan@ku.edu

 Outline of Presentation

 •Project Background
 •Instrumentation
 •Data Analysis
 •Long-term Monitoring
 •Concluding Remarks

 -2-

 1
9/14/2021 Background Wind load Sound Wind load barrier wall Highway Casing Bedrock Rock socket -3- Current Practice and Issues Proposed P x P Field test with instrumentation required! Pile Pile Pile y Geosynthetics Geosynthetics M Leveling + Rock socket Bedrock Bedrock pad Casing Issues: Rock socket No design method Bedrock available Pile capacity vs. Long, large diameter piles Leveling offset socked into rock/firm soil, Geosynthetics pad Pile group effect i.e., very costly Bedrock 2
9/14/2021

 Test Section
 8in (0.2m) impermeable
 1 ft (0.3m) drainage fill soil cover Reaction pile Granular backfill
Pile Test pile

 20ft (6m)
 high
 3ft (1m)
Geogrids embedment
 Sandstone

 14ft (4.2m) long Limestone

 Shale
Bedrock
 Limestone

 Maintained displacement method for loading tests
 -5-

 Test Wall and Test Piles Pierson et al. (2011)

 A B Test piles
 BG BS C
 D 15ft
 Reaction
 piles

 -6-

 3
9/14/2021

 Types of Instrumentation
 • Load Cells
 • Displacement Transducers
 • Earth Pressure Cells
 • Strain Gauges on Geogrid
 • Inclinometer and Casing
 • Photo Targets Attached to Facing
 • Tell-tales
 • Data Acquisition
 -7-

 Lateral Loading Test of Single Pile
Displacement
transducer Local cell Horizontal profile
 of lateral deflection

 Vertical profile of
 Lateral deflection

 Huang et al.- (2013)
 8-

 4
9/14/2021

 Lateral Loading Test of Group Piles
Test Piles

 Load Cells
 Disp. transducers

 Reaction Piles

 -9-

 Earth Pressure Cell and Strain Gauges

 - 10 -

 5
9/14/2021

Inclinometer and Casing

 - 11 -

 Photogrammetry

 - 12 -

 6
9/14/2021

 Photogrammetry

Black area = 6 inch scale

 - 13 -

 Tell-Tales
 Similar to settlement plate

 - 14 -

 7
9/14/2021

 Data Acquisition

Serviceability and Ultimate Capacity
 800 180 kips

 Serviceability
 600 135
 Ultimate
 Load (kN)

 FS = 3.0
 400 90
 2.0
 1.7
 200 45

 0
 0 1 2 3 4 5
 Pile offset distance (x d)

Serviceability = 25 mm (1 in.), Ultimate displacement = 20%d
 - 16 -

 8
9/14/2021

 Earth Pressures and Geogrid Strains
 Induced by Laterally Loaded Piles
 Strain
 gauges

 EPCs
 P

 Sing Pile B Group Pile B
 Huang et al. (2013) Huang et al. (2014) - 17 -

 Vertical Profile of Lateral Deflections of
 Single Pile and Wall
 2in 4in Pile B
 From photogrammetry
20ft 1in 2in 3in 4in
 20ft

 From inclinometer
 Pile head deflection (mm)
 Pile head deflection (mm)
10ft 10ft

 Pile is rigid! Wall facing is flexible!

 Huang et al. (2013) - 18 -

 9
9/14/2021

 Horizontal Profile of Lateral Deflections of Wall
 under Single and Group Pile Loading
 Pile B at El. 5.4m
 Instrumented data indicate group effect.
-10 ft 10 ft
 (4.4in) Pile head deflection (mm)
 74% Pile head
 deflection (mm) 4in

 74%
 2in

 (6in)

 All the wall facing deflection data were obtained by the photogrammetry method.
 Huang et al. (2013)
 How about long-term monitoring?Huang et al. (2014)
 - 19 -

 Shape Accelerometer Array
 for Long-term Monitoring

 - 20 -

 10
9/14/2021

Monitoring with Shape Accelerometer Array

 SAA

 SAA

 - 21 -

 Lateral Pile Loading Test
 with Instrumentation

 Rollins et al. (2009).

 - 22 -

 11
9/14/2021 Concluding Remarks Pile(s) in MSE wall subjected to lateral loading is a complicated interaction problem. Instrumentation helped verify a cost-effective design option and determine design parameters. Instrumentation including load cells, displacement transducers, earth pressure cells, strain gauges, inclinometer and casing, photogrammetry, tell-tales, and data acquisition system gathered useful data for this evaluation. The findings from the instrumentation and evaluation provide guidance for future design and applications. Recent technology - Shape Accelerometer Array (SAA) enables long-term automatic monitoring of earth structure performance. ‐ 23 ‐ Acknowledgements The study was financially sponsored by the Kansas Department of Transportation (KDOT) through the KTran program. The KDOT project monitor was Mr. James Brennan. The test wall was constructed by the KDOT crew. Research Investigators: Drs. R.L. Parsons, J. Han, M. Pierson, and J. Huang, the University of Kansas This study was also supported by Applied Foundation Testing, Dan Brown and Associates, and Tensar International Corporation. - 24 - 12
9/14/2021

 References
Huang, J., Han, J., Parsons, R.L., and Pierson, M. (2013). “Refined numerical modeling of a
laterally-loaded drilled shaft in an MSE wall.” Geotextiles and Geomembranes, 37, 61-73.
Huang, J., Bin-Shafique, S., Han, J., and Rahman, M.S. (2014). “Modeling of laterally loaded
drilled shaft group in MSE wall.” ICE Geotechnical Engineering Journal, 167(GE4). 402-414.
Pierson, M.C., Parsons, R.L., Han, J., and Brennan, J.J. (2011). “Laterally loaded shaft group
capacities and deflections behind an MSE wall.” Journal of Geotechnical and
Geoenvironmental Engineering, ASCE. Reston, Virginia, 137(10), 882-889
Rollins, K., Herbst, M., Gerber, T. & Cummins, C. (2009). “Monitoring Displacement vs. Depth
in Lateral Pile Load Tests Using Shape Accelerometer Arrays.” Procs. 17th Intl. Conf. on Soil
Mech. and Geotech. Engrg. ISSMGE, IOS Press, Vol. 3, p. 2016-2019.
Vessely, M., Robert, W., Richrath, S., Schaefer, V.R., Smadi, O., Loehr, E., & Boeckmann, A.
(2019). Geotechnical Asset Management for Transportation Agencies, Volume 2:
Implementation Manual. NCHRP Research Report 903.

 - 25 -

 Thanks! Questions?
 jiehan@ku.edu

 - 26 -

 13
Today’s Panelists
Moderator:
Derrick Dasenbrock, FHWA

 Liang Chern Chow,
 American Engineering Testing

Barry Christopher,
Christopher Consultants

 Jie Han,
 University of Kansas

 #TRBwebinar
• Subscribe to the newsletter for the most
 recent TRB news & research!
• Even previous subscribers must
 resubscribe!

https://bit.ly/ResubscribeTRBWeekly
TRB’s New Podcast!
• Have you heard that we have a new
 podcast, TRB’s Transportation Explorers?
• Listen on our website or subscribe
 wherever you listen to podcasts!

#TRBExplorers
Get involved with TRB
• Receive emails about upcoming webinars:
https://mailchi.mp/nas.edu/trbwebinars

• Find upcoming conferences:
 http://www.trb.org/Calendar

#TRBWebinars
Get Involved with TRB
 #TRBwebinar

 Getting involved is free!

 Be a Friend of a Committee bit.ly/TRBcommittees
 – Networking opportunities
 – May provide a path to Standing Committee membership

Join a Standing Committee bit.ly/TRBstandingcommittee

 Work with CRP https://bit.ly/TRB-crp

 Update your information www.mytrb.org
You can also read