EVALUATION OF SEMANTIC SEGMENTATION METHODS FOR DEFORESTATION DETECTION IN THE AMAZON
←
→
Page content transcription
If your browser does not render page correctly, please read the page content below
The International Archives of the Photogrammetry, Remote Sensing and Spatial Information Sciences, Volume XLIII-B3-2020, 2020
                                                 XXIV ISPRS Congress (2020 edition)

    EVALUATION OF SEMANTIC SEGMENTATION METHODS FOR DEFORESTATION
                       DETECTION IN THE AMAZON

                                 R. B. Andrade1 , G. A. O. P. Costa1, ∗, G. L. A. Mota1 , M. X. Ortega2 ,
                                               R. Q. Feitosa2 , P. J. Soto2 , C. Heipke3
                     1
                      Dept. of Informatics and Computer Science, Rio de Janeiro State University (UERJ), Brazil
                                      renanbides@gmail.com, (gilson.costa, guimota)@ime.uerj.br
                 2
                   Dept. of Electrical Engineering, Pontifical Catholic University of Rio de Janeiro (PUC-Rio), Brazil
                                                 (mortega, raul, psoto)@ele.puc-rio.br
                 3
                   Institute of Photogrammetry and GeoInformation, Leibniz Universität Hannover (LUH), Germany
                                                      heipke@ipi.uni-hannover.de

                                                      Commission III, WG III/7

KEY WORDS: Amazon Forest, Deforestation, Semantic Segmentation, Change Detection, Deep Learning, DeepLabv3+

ABSTRACT:

Deforestation is a wide-reaching problem, responsible for serious environmental issues, such as biodiversity loss and global climate
change. Containing approximately ten percent of all biomass on the planet and home to one tenth of the known species, the
Amazon biome has faced important deforestation pressure in the last decades. Devising efficient deforestation detection methods
is, therefore, key to combat illegal deforestation and to aid in the conception of public policies directed to promote sustainable
development in the Amazon. In this work, we implement and evaluate a deforestation detection approach which is based on a Fully
Convolutional, Deep Learning (DL) model: the DeepLabv3+. We compare the results obtained with the devised approach to those
obtained with previously proposed DL-based methods (Early Fusion and Siamese Convolutional Network) using Landsat OLI-8
images acquired at different dates, covering a region of the Amazon forest. In order to evaluate the sensitivity of the methods to the
amount of training data, we also evaluate them using varying training sample set sizes. The results show that all tested variants of
the proposed method significantly outperform the other DL-based methods in terms of overall accuracy and F1-score. The gains in
performance were even more substantial when limited amounts of samples were used in training the evaluated methods.

                      1. INTRODUCTION                                  of unsustainable economic development, primarily caused by
                                                                       the extension of agricultural activities at industrial scale, such as
Covering an area of approximately 5.5 million km2 , which is           soybean cropping and cattle farming, forest fires, illegal mining
equivalent to approximately one third the size of the South Amer-      and logging and expansion of informal settlements (Goodman
ican continent, the Amazon rainforest encompasses half of the          et al., 2019, Malingreau et al., 2012, Nogueron et al., 2006). All
remaining tropical forest area on the planet (World Wildlife           these factors are directly associated with deforestation.
Fund, 2020a). Home to the largest collection of plants and an-
imal species on the planet, the Amazon biome contains unpar-           According to the National Institute for Space Research (INPE)
alleled biodiversity: it is the natural habitat of one tenth of the    (Shimabukuro et al., 2013), deforestation accelerated signific-
known species in the world (The Worldwatch Institute, 2015).           antly in the Brazilian Legal Amazon area during the 1990’s and
                                                                       early 2000’s. Likewise, the World Wildlife Fund (World Wild-
The forest covers most of the Amazon river basin, source of            life Fund, 2020b) estimates that more than a quarter of the rain-
20% of all free-flowing fresh water on Earth (Assunção, Rocha,       forest will vanish by 2030, if the current rate of deforestation
2019). Additionally, the Amazon forest produces vast quantit-          continues.
ies of water for most of South America’s extents. The so-called
                                                                       Deforestation is one of the largest sources of CO2 emissions re-
“flying rivers”, formed by masses of air loaded with water vapor
                                                                       lated to anthropogenic activities. It is a wide-reaching problem,
generated through evapotranspiration, carry moisture to most
                                                                       responsible for the reduction of carbon storage, greenhouse gas
of Brazil and regulate rainfall regimes in the central, south-
                                                                       emissions, and other serious environmental issues such as bio-
east and southern regions of South America (Lovejoy, Nobre,
                                                                       diversity losses and climate change (De Sy et al., 2015).
2018). The induced rain is responsible for irrigating crops and
for filling the rivers and dams used to generate electrical energy
                                                                       The above mentioned facts indicate the importance of the pre-
by a large number of hydropower plants.
                                                                       servation of the Amazon biome, and Remote Sensing (RS) data
                                                                       provide key capability to monitor this environment. It can be
Moreover, tropical rainforests store from 90 to 140 billion met-
                                                                       used not only in the combat of illegal activities, but also in the
ric tons of carbon, and are known to help stabilize the world-
                                                                       planning and development of public policies to promote sus-
wide climate. The Amazon forest alone contains 10% of all
                                                                       tainable development in the region (Sathler et al., 2018).
biomass on the planet (De Sy et al., 2015). Unfortunately, for
decades the Amazon biome has faced several threats as a result
                                                                       Since the late 1980’s, the Brazilian National Institute for Space
∗   Corresponding author                                               Research (INPE) has been using RS data to monitor the Brazi-

                                                  This contribution has been peer-reviewed.
                   https://doi.org/10.5194/isprs-archives-XLIII-B3-2020-1497-2020 | © Authors 2020. CC BY 4.0 License.                1497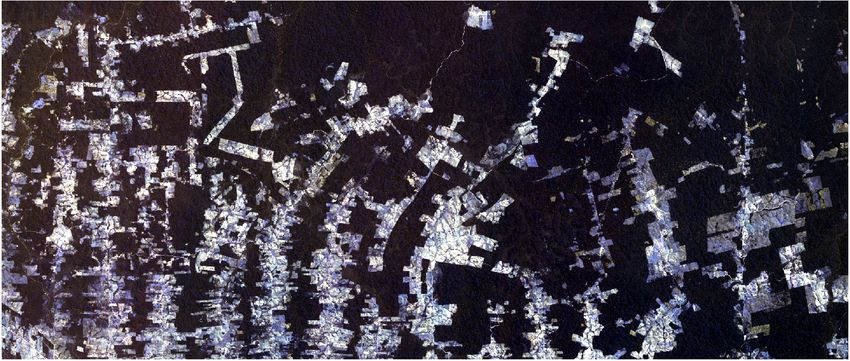
The International Archives of the Photogrammetry, Remote Sensing and Spatial Information Sciences, Volume XLIII-B3-2020, 2020
                                               XXIV ISPRS Congress (2020 edition)

lian Legal Amazon area (BLA). Since 1988, the Amazon Defor-          2.1   Patch-wise Classification
estation Monitoring Project (PRODES) has produced annual re-
ports about deforestation of native vegetation in the BLA, deliv-    Patch-wise classification change detection produces a global
ering deforestation maps derived from Landsat images (Valeri-        decision by considering two distinct patches of the same ob-
ano et al., 2004). Relying on MODIS data the Near Real-Time          ject acquired at distinct time instances. Among the outstanding
Deforestation Detection project (DETER-A) started in 2004 to         methods that can be found in the literature, (Chu et al., 2016)
support actions from governmental agencies against illegal de-       proposes a CD method that uses a pair of Deep Belief Net-
forestation (Shimabukuro et al., 2006). With the change in           works (DBN), one for each patch. A modified backpropaga-
the deforestation patterns observed in the last decade, in which     tion algorithm minimizes the DBNs’ outputs distances for non-
most deforestation polygons started to show areas of less than       changed examples and maximizes them for the changed ones.
25 ha, a new version of the project, the DETER-B, was launched       The DBN outputs are submitted to PCA/k-means clustering,
in 2015, in order to monitor, on a daily basis, changes in veget-    which produces the final result. In experiments using very high
ation cover of as small as 1 ha, from the WFI/CBERS-4 and            resolution (VHR) images of urban areas, the method outper-
AWiFS/IRS sensor systems (Diniz et al., 2015).                       formed traditional approaches.

All the above mentioned projects, however, rely mostly on visual     A similar idea underlies the Siamese Convolutional Neural Net-
interpretation and manual operations. This is due basically to       works (S-CNN) applied in (Daudt et al., 2018), which corres-
the high level of accuracy expected for the official information     ponds to a pair of convolutional nets with shared weights. Con-
provided by those projects to different stakeholders. There is,      volutional outputs are concatenated and a fully connected net-
therefore, a demand for automatic methods that can support           work delivers the decision. An alternative approach to S-CNN
such projects in ways that can further improve the accuracies        is also presented by the authors: the so-called Early Fusion
obtained and, at the same time, diminish the need for human          (EF), which consists of concatenating two image pairs as the in-
intervention, so as to improve their response times.                 put of the convolutional network. In the experiments, Sentinel-2
                                                                     RS images of urban areas were employed to compare the per-
In this work, we evaluate an approach based on a specific Deep       formance of EF and S-CNN to some baseline methods. The
Learning (DL) Fully Convolutional Network (FCN) architec-            authors reported that the EF and S-CNN delivered the best res-
ture, the DeepLabv3+ (Chen et al., 2018b), which we adapted          ults, and that the EF method was slightly superior to the S-CNN
to deforestation change detection. We also compare the results       method.
obtained with this approach to the ones reported in a previous
work (Ortega et al., 2019) over the same study area. Addition-       2.2   Semantic Segmentation
ally, we investigate the different methods’ demands for training
samples in relation to the delivered accuracies. In short, the       Semantic segmentation is characterized by producing pixel lev-
major contributions in this work are:                                el decisions, in contrast to global patch-wise classification. A
                                                                     successful method for the semantic segmentation of VHR im-
                                                                     ages is presented in (Wang et al., 2019). It employs an en-
  • We adapted the previously proposed semantic segmenta-            semble of several multiscale multiconnection ResNets and a
    tion method DeepLabv3+ to deforestation change detec-            class-specific attention model. Experiments compared it to six
    tion, and evaluated the method’s performance over an area        state-of-the-art models, including the DeepLabv3+, in two ur-
    of the Amazon forest.                                            ban benchmark datasets (Mnih, 2013, ISPRS, 2020). In order to
  • We evaluated the impact of varying hyperparameter val-           reduce the loss of spatial features and strengthen object bound-
    ues of the proposed method in the deforestation detection        aries, the so-called dense-coordconv network (DCCN) was pro-
    accuracy.                                                        posed in (Yao et al., 2019). In the experiments, the authors com-
                                                                     pared DCCN with other deep convolutional neural networks (U-
  • We evaluated the sensitivity of the proposed method to the       net, SegNet, DeepLabv3), showing that DCCN delivered higher
    amount of labeled samples used in training stage.                accuracies. Aiming at increasing the robustness of segmenta-
                                                                     tion in blurred or partially damaged VHR RS images, (Peng et
  • We compared the performance of the proposed method               al., 2019) proposes the RobustDenseNet and the use of multi-
    to those delivered by deep learning-based methods previ-         modal data (NIR, RGB and DSM). Experiments compared the
    ously employed in deforestation detection in the Amazon          proposed model with DeepLabv3+ on the ISPRS Postdam 2D
    region.                                                          dataset (ISPRS, 2020), with randomly added motion blur to
                                                                     spectral data, and randomly deleted colors of small areas. The
The remainder of this article is organized as follows. In the next   results show the superiority of the proposed model over Dee-
section we review related works. Section 3 describes the Deep-       pLabv3+. (Guo et al., 2020) used a pre-trained modified aligned
Labv3+ architecture, while section 4 presents the adaptations        Xception (Chollet, 2016) and the DeepLabv3+ model combined
of the original module carried out in this research. In Section 4    with transfer learning strategies for extraction of snow cover
we also describe the other change detection methods, to which        from high spatial resolution RS images.
the proposed method is compared. Section 5 is dedicated to the
description of the experiments. In Section 6 we present and ana-     An FCN architecture inspired by U-Net is presented in (de Jong,
lyze the results of the experiments, and in Section 7 we present     Bosman, 2019). One of its benefits is that it can take advantage
the conclusions and directions for further work.                     of previously trained U-Nets. Another important aspect is its
                                                                     multi-scale structure, which is able to generate multiple scales
                                                                     difference images. This method was applied to high resolu-
                    2. RELATED WORK                                  tion RS images of the ISPRS Vaihingen dataset (ISPRS, 2020),
                                                                     achieving over 90% overall accuracy. A Fully Atrous convolu-
This section presents some DL patch-wise classification and se-      tional neural network (FACNN) architecture for semantic seg-
mantic segmentation approaches.                                      mentation and CD was introduced in (Zhang et al., 2019). Test-

                                                This contribution has been peer-reviewed.
                 https://doi.org/10.5194/isprs-archives-XLIII-B3-2020-1497-2020 | © Authors 2020. CC BY 4.0 License.             1498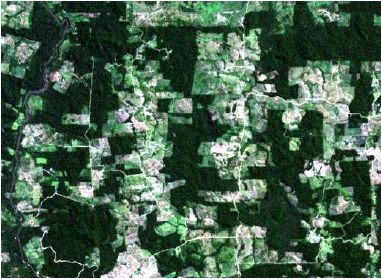
The International Archives of the Photogrammetry, Remote Sensing and Spatial Information Sciences, Volume XLIII-B3-2020, 2020
                                               XXIV ISPRS Congress (2020 edition)

ing results using VHR images showed that the FACNN signific-            by a factor 16, the encoder output feature map in DeepLabv3+ is
antly outperforms several recent FCN models (FCN-16, U-Net,             first bilinearly upsampled by a factor of 4 and then concatenated
Dense-Det, DeepLabv3 and SR-FCN (Ji et al., 2019)) in land              with the corresponding low-level feature map from the network
cover classification.                                                   backbone that has the same spatial resolution. Before concaten-
                                                                        ation, a 1×1 convolution is applied on the low-level features to
2.3   Deforestation Mapping                                             reduce the number of channels associated with those features,
                                                                        so that they do not outweigh the importance of the encoder’s
The work (Ortega et al., 2019) presents an evaluation of meth-          output. After concatenation, 3×3 convolutions are applied to
ods for automatic deforestation detection, an Early Fusion (EF)         refine the features, finally followed by another simple bilinear
Convolutional Network and a Siamese Convolutional Network               upsampling by a factor of 4 (Chen et al., 2018b).
(S-CNN), taking a Support Vector Machine (SVM) as baseline.
These patch classification methods were evaluated on a data-            In (Chen et al., 2018b) the authors also used the Xception model
set covering the Brazilian Legal Amazon. The DL-based ap-               (Chollet, 2016), adapted for the task of semantic segmentation,
proaches outperformed the SVM baseline, both in terms of F1-            as the backbone of the encoder network. A deeper model, as in
score and Overall Accuracy, with a superiority of S-CNN over            (Dai et al., 2017), was used. The max pooling operations were
EF.                                                                     replaced by depthwise separable convolution with striding, and
                                                                        batch normalization (Ioffe, Szegedy, 2015) and ReLU activa-
To the best of our knowledge, (Ortega et al., 2019) is the only         tion were added after each 3×3 depthwise convolution, as in
research reported in the literature dedicated to monitoring Ama-        the MobileNet design (Howard et al., 2017).
zon deforestation based on DL. The research presented herein
uses the same dataset. But, instead of employing patch-wise                   4. DEFORESTATION DETECTION METHODS
classification methods, this work is dedicated to the investiga-
tion of the benefits of using a particular semantic segmentation        In this section, we shortly describe the methods evaluated in this
architecture, the DeepLabv3+ in deforestation monitoring.               work for deforestation detection, the previously proposed Early
                                                                        Fusion (EF) and Siamese Convolutional Network (S-CNN), and
                                                                        the one introduced in this work, based on fully convolutional
              3. THE DEEPLAB V3+ MODEL
                                                                        semantic segmentation with the DeepLabv3+ model (DL).
The first DeepLab module was proposed in (Chen et al., 2014).           4.1   Early Fusion (EF)
Its major novelty is the particular implementation of the ‘hole
algorithm’, which has been previously proposed for improving            The EF method is based on the CNN model proposed in (Daudt
efficiency on the computation of the undecimated wavelet trans-         et al., 2018), originally employed for change detection in urban
form (Mallat, 2018), and came to be known in the DL field               areas. It is composed of a number of convolutions and pooling
by the terms atrous or dilated convolution. Dilated convolu-            layers, followed by a fully connected layer and a softmax layer,
tion is designed to enlarge the field-of-view of traditional filters,   to carry out the final classification.
thus incorporating larger image contexts, without increasing the
number of parameters or the amount of computations.                     The term Early Fusion is related to the concatenation of co-
                                                                        registered images from two different epochs, before further pro-
The second DeepLab version introduced atrous spatial pyramid            cessing. The images are stacked along the spectral dimension to
pooling (ASPP). ASPP were designed to probe a feature layer             generate a unique (synthetic) input image for subsequent patch
with filters with different fields-of-view, by performing a se-         extraction.
quence of dilated convolutions with different sampling rates,
                                                                        The image patches are defined and extracted through a sliding
thus capturing image context at multiple scales (Chen et al.,
                                                                        window procedure. Each patch is submitted to classification,
2018a).
                                                                        and the corresponding class label is assigned to the central pixel
                                                                        of each patch.
The first two versions of DeepLab relied on a fully connected
Conditional Random Field (CRF) (Krähenbühl, Koltun, 2011)             The EF model evaluated in this work is composed of three con-
to enhance the level of detail (e.g., of object boundaries) of the      volutional layers (Conv) with ReLU as activation function, two
outcome of the convolutional networks. The CRF component                max-pooling (MaxPool) layers and two fully connected layers,
was droped in the third DeepLab module (Chen et al., 2017),             the last one being a softmax with two outputs, associated with
in which the ASPP component was augmented by using image-               the deforestation and no-deforestation classes. The input tensor
level features, or image pooling (Liu et al., 2015), which encode       has dimensions 15×15×16 (H×W×C), the first Conv layer has
global image context.                                                   96 7×7×16 filters, using padding. It is followed by a MaxPool
                                                                        (2×2) layer, which generates a 7×7×96 tensor. The second
Finally, the DeepLabv3+ model (Chen et al., 2018b) adopts an            Conv layer has 192 5×5×96 filters, it is also followed by a
encoder-decoder structure using the original DeepLabv3 as an            MaxPool (2×2) layer, resulting in a 3×3×192 tensor. The last
encoder. The simple decoder module was devised to enhance               Conv layer has 256 3×3×192 filters, generating a 3×3×256
segmentation results especially along object boundaries. Spe-           tensor which is flattened (amounting to a 2304 feature vector)
cifically, the last feature map before the logits layer in the ori-     and connected to the softmax layer.
ginal DeepLabv3 model is used as the encoder output.
                                                                        4.2   Siamese Convolutional Network (S-CNN)
The encoder features from DeepLabv3 are usually computed
with an output stride of 16, the output stride being the ratio of       A Siamese convolutional network comprises two identical CNN
the input image spatial resolution to the output feature map spa-       branches that share the same hyperparameters and weight val-
tial resolution. In order to recover object segmentation details        ues (Zhang et al., 2018). The model evaluated in this work is
which are not recovered through a simple bilinear upsampling            also based in the work of (Daudt et al., 2018).

                                                 This contribution has been peer-reviewed.
                  https://doi.org/10.5194/isprs-archives-XLIII-B3-2020-1497-2020 | © Authors 2020. CC BY 4.0 License.               1499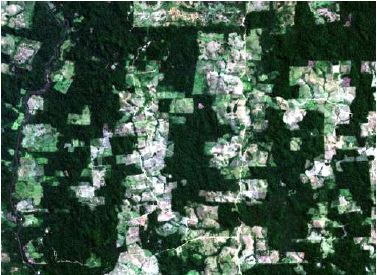
The International Archives of the Photogrammetry, Remote Sensing and Spatial Information Sciences, Volume XLIII-B3-2020, 2020
XXIV ISPRS Congress (2020 edition)
Corresponding patches from co-registered images of two dif-
ferent epochs are processed individually on each branch of the
network, generating feature vectors that are concatenated and
associated to a fully connected layer followed by a softmax
layer with two outputs (Zhang et al., 2018). Similar to the EF
approach, a class label is assigned to the central pixel of each
patch.
Each branch of the network is similar to the architecture de-
scribed in the previous section, with the difference that the in-
put tensor has dimensions 15×15×8, and the filters in the first
Conv layer have sizes 7×7×8. Also, the final feature vectors
are concatenated into a 4608 sized one, and connected to the
softmax layer.
4.3 DeepLab-based Change Detection (DLCD)
As in the EF approach, the proposed DeepLab-based deforest-
ation detection (DLCD) technique takes as input a synthetic
image, created through stacking along the spectral dimension
two co-registered images from different epochs. But different
from the previously described methods, which were devised for
patch, or image classification in the computer vision termino-
logy, DLCD delivers dense labeling of input patches through a
FCN. Figure 1. DLCD model. Layer descriptions contain: convolution
type (Conv for regular convolution; SConv for depthwise
Since the size of the deforestation areas (or objects) in the data- separable convolution), number of filters, filter size, stride,
set evaluated in this work are much smaller than the objects
dilation rate.
present in the images of the datasets tested in (Chen et al.,
2018b) (i.e., PASCAL VOC 2012 and Cityscapes), and the vast
majority of the samples/pixels are of the no-deforestation (or
background) class, we experimented with patches of smaller
sizes than in (Chen et al., 2018b) and obtained better and more
consistent results with a patch size of 64×64 pixels.
In order to adjust the network architecture to the selected input
patch size and to an output stride of 8, we changed the rates of
the convolutions in the atrous spatial pyramid pooling to 3 and
6 (originally, rates 12 and 24 were employed), and removed the
convolution with the highest rate because it would degenerate
into a 1×1 convolution. We also used rate 1 in the middle block, Figure 2. T1: August, 2016.
and rates 1 and 2 in the exit blocks convolutions of the adapted
Xception backbone (originally, rates 2 and 4 were employed in
the exit blocks). Figure 1 shows the architecture of the DLCD
model.
5. EXPERIMENTS
5.1 Data Set Description
The study area is located in the Brazilian Legal Amazon, more
specifically in Pará State, Brazil, centered on coordinates of 03o
Figure 3. T2: July, 2017.
17’ 23” S and 050o 55’ 08” W. This area has faced a significant
deforestation process in the period tracked and monitored by
PRODES (Valeriano et al., 2004). of the reference were not considered in the analysis, because
they had been deforested in previous years.
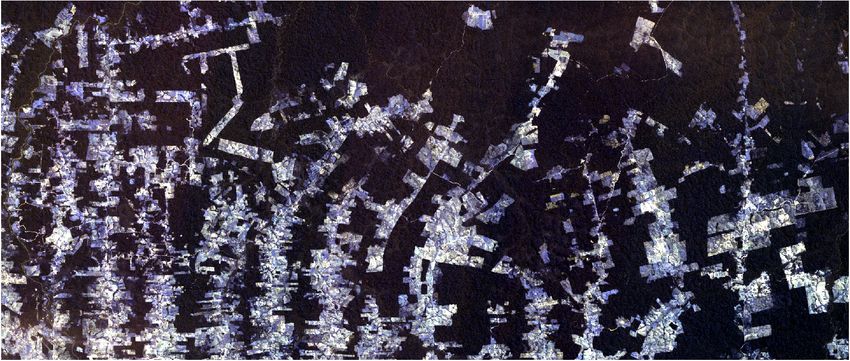
Figure 2 shows the study area on August 2nd, 2016 and Figure
3 shows the same area on July 20th, 2017. These dates were The reference deforestation polygons represent transitions from
chosen due to the lower presence of clouds, a common problem forest to no-forest. In this work image pixels that intersect such
over all the Brazilian Legal Amazon region. polygons are considered as samples of the deforestation class.
The other pixels are associated with the no-deforestation class,
Figure 4 shows the reference change map of deforestation that which includes areas where the forest cover remains unchanged
occurred between December 2016 and December 2017. This and areas where deforestation has previously occurred.
data is freely available at the PRODES database (http://terrabra
silis.dpi.inpe.br/map/deforestation). However, some polygons The dataset comprises a pair of Landsat 8-OLI images, with
This contribution has been peer-reviewed.
https://doi.org/10.5194/isprs-archives-XLIII-B3-2020-1497-2020 | © Authors 2020. CC BY 4.0 License. 1500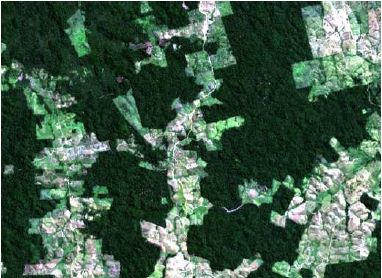
The International Archives of the Photogrammetry, Remote Sensing and Spatial Information Sciences, Volume XLIII-B3-2020, 2020
                                               XXIV ISPRS Congress (2020 edition)

30m spatial resolution. We applied an atmospheric correction                  Table 2. Deforestation area in the training scenarios.
to each scene, and clipped them to the target area. The fi-
nal images have 1100×2600 pixels and seven spectral bands                     Training tiles    Area (pixels)     Proportion (%)
(Coastal/Aerosol, Blue, Green, Red, NIR, SWIR-1, and SWIR-                        1 tile            2137               1.1
                                                                                 2 tiles           12112               3.3
2). Following (Ortega et al., 2019), we also included an ad-                     3 tiles           16376               2.9
ditional band in those images, which corresponds to the Nor-                     4 tiles           24438               3.3
malized Difference Vegetation Index (NDVI) (Carlson, Ripley,
1997) calculated for every pixel using the Red and the NIR              the deforestation area in relation to the total area of the tiles
bands.                                                                  considered in the different training scenarios.
The dataset is extremely imbalanced considering the ratio of
                                                                        The patch sizes for the EF and S-CNN methods were set to
the deforested area in the studied period to the area in which
                                                                        15×15. During the training procedure of both methods, data
deforestation did not occur. Table 1 shows the proportions of
                                                                        augmentation was performed only on patches associated to the
the deforestation area in relation to the total area in the study
                                                                        deforestation class, i.e., for which the central pixel belongs to
region. The training, validation and test set rows in Table 1
                                                                        the deforestation class. Each training patch was rotated by 90o ,
show the proportions in relation to the total area covered by the
                                                                        and flipped in the horizontal and vertical axis.
tiles considered in the respective sets (see next section).
                                                                        Additionally, under-sampling was employed for the no-defores-
We observe that highly imbalanced datasets pose a challenge
                                                                        tation class to balance the number of training patches for both
for predictive modeling as the learning process of most clas-
                                                                        classes. In this way, 8,118 training pairs of patches were ob-
sification algorithms is often biased toward the majority class
                                                                        tained for each class. The validation set was composed by a
examples, so that minority ones are not well modeled into the
                                                                        total of 40,642 pairs of patches, 963 of the deforestation class,
final system (Guo, Viktor, 2004). As described in the next sec-
                                                                        and 39,679 of no-deforestation class, which corresponds to the
tion, in this work we explore different techniques to deal with
                                                                        class distribution in the test set, which comprises 1,716,000
class imbalance in the training process of the proposed method.
                                                                        pairs, of which 40,392 were deforestation pairs and 1,675,608
         Table 1. Deforestation area in the study region.               no-deforestation pairs.

      Deforestation      Area (pixels)      Proportion (%)              For training the EF and S-CNN methods the batch size was set
          Total             72298                2.6                    to 32. We used early stopping to break after 10 epochs without
       Training set         24438                3.3                    improvement and a dropout rate of 0.2 was set for the last fully
      Validation set         8807                2.3                    connected layer. We employed the Adam optimizer, with the
         Test set           39053                2.3                    learning rate of 0.001 and weight decay of 0.9.
5.2   Experimental Setup                                                For the DLCD method we used patches of 64×64, with an over-
                                                                        lap of 48×48 pixels. The selected training patches were subjec-
Following (Ortega et al., 2019) the experiments relied on the           ted to data augmentation, they were rotated by 90o , 180o , 270o ;
two optical images mentioned in the previous section. As an             and the original and rotated versions of the patches were flipped
NDVI band was stacked along the spectral dimension of the               vertically. Patches with no deforestation pixels were not used
corresponding images, the resulting input images for the defor-         in the training procedure.
estation detection methods comprise eight bands, which were
normalized to zero mean and unit variance.                              The batch size was set to 16, and the number of epochs was
                                                                        set to 100. We also used early stopping, to halt the procedure
We divided the input images into tiles of the same size and ob-
                                                                        after 10 epochs without improvement. Adam optimizer with a
tained a total of 15 tiles. Tiles 1, 7, 9 and 13 were used for train-
                                                                        learning rate of 0.001 was used in training.
ing, tiles 5 and 12 for validation and tiles 2, 3, 4, 6, 8, 10, 11,
14 and 15 for test. Figure 4 shows the image tile locations and         As mentioned before, in order to deal with the high class im-
the corresponding reference deforestation areas (in blue color).        balance between the majority class (no-deforestation) and the
                                                                        minority class (deforestation), in the case of the EF and S-
                                                                        CNN methods, we balanced the training set so that it contains
                                                                        the same number of deforestation and no-deforestation patches.
                                                                        This was possible because those techniques perform patch-wise
                                                                        classification, so that a patch can be labeled as belonging to a
                                                                        particular class (that of its center pixel).

                                                                        In the case of the proposed DLCD method, which assigns a
                                                                        label to each pixel within a patch, it is not so simple to bal-
                                                                        ance the training set. We could have decided to select for train-
                                                                        ing patches with a higher proportion of deforestation pixels,
      Figure 4. Tile references and deforestation polygons.
                                                                        say 10%, but this would result in a much smaller training set.
                                                                        Therefore, in an attempt to further deal with class imbalance we
In order to evaluate the sensitivity of the methods to the amount       employed the weighted focal loss function (Lin et al., 2017) in
of training data, we ran experiments considering four different         the training of the DLCD model.
scenarios: using training samples from a single tile (13); from
two tiles (1 and 13); from three tiles (1, 7 and 13); and from          The weighted focal loss function was proposed for object re-
four tiles (1, 7, 9 and 13). Table 2 shows the proportions of           cognition problems with extreme foreground-background class

                                                 This contribution has been peer-reviewed.
                  https://doi.org/10.5194/isprs-archives-XLIII-B3-2020-1497-2020 | © Authors 2020. CC BY 4.0 License.                  1501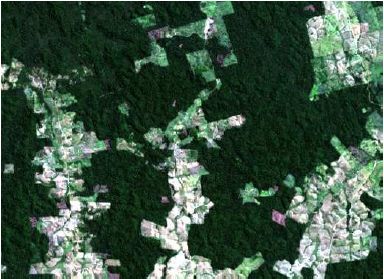
The International Archives of the Photogrammetry, Remote Sensing and Spatial Information Sciences, Volume XLIII-B3-2020, 2020
                                               XXIV ISPRS Congress (2020 edition)

imbalance. It is described in Equation 1, where y ∈ {±1} spe-         98.8%. When using one, two and three tiles for training, the
cifies the ground-truth class; p ∈ [0, 1] is the model’s estimated    DLCD-4 variant outperformed both Early Fusion and Siamese
probability for class y = 1 (the deforestation class); and α rep-     Networks methods by, respectively, 3.66% and 2.83% for one
resents the weight associated to the deforestation class.             training tile, 1.81% and 1.64% for two training tiles and 1.46%
                                                                      and 1.05% for three training tiles.

              W F L(pt ) = −αt (1 − pt )γ log(pt )             (1)
                            (
                              p       if y = 1
              where pt =
                              1 − p otherwise
                           (
                             α       if y = 1
               and αt =
                             1 − α otherwise

In order to investigate the influence of the parameters α and γ of
the weighted focal loss function in the classification accuracy of
the DLCD method, we performed a grid search. Accordingly,
in the experiments we considered the following values of α:
0.9, 0.8, 0.7, 0.6 and 0.5. Additionally, for each different α                Figure 5. F1-score×number of tiles for training.
value, we varied the γ values from 0 to 5 (integer values), which
amounts to a total of 30 combinations of α and γ values.

                         6. RESULTS

Figures 5 and 6 summarize the results of our experiments in
terms of F1-score for the deforestation class and Overall Ac-
curacy achieved by the Early Fusion (EF) and Siamese Net-
works (S-CNN) methods used in (Ortega et al., 2019) and by
the DeepLabv3+ change detection (DLCD) model implemen-
ted in this work. The figures show the performance obtained by
each method for different number of tiles used for training. For
the sake of clarity, we show the results of only four combina-
tions of the weights/γ values of the weighted focal loss func-
tion, namely: DLCD-1, for weights 0.1/0.9 and γ equal to 0;
                                                                          Figure 6. Overall accuracy×number of tiles for training.
DLCD-2, for weights 0.5/0.5 and γ equal to 0; DLCD-3, for
weights 0.5/0.5 and γ equal to 1; DLCD-4, for weights 0.5/0.5
and γ equal to 2. Those combinations were the ones that pro-          Figures 8 and 10 show visual examples of the outcomes of the
duced the best results, considering all the 30 possible variations.   Early Fusion, Siamese Networks and DeepLabv3+ based meth-
                                                                      ods (DLCD-1 variant), over the test tiles 6 and 14.
The results show that the DeepLabv3+ based models (DLCD)
significantly outperformed all the other methods in terms of          As can be seen in figures the method implemented in this work
overall accuracy and F1-score, in all the training scenarios (i.e.,   produced a notably lower number of false deforestation areas,
number of training tiles).                                            which is particularly important for operational reasons, consid-
                                                                      ering the effort and costs involved in the reconnaissance of the
In the best result for the F1-score using 4 tiles for training,       actual deforestation by the local authorities, involved in penal-
71.8%, was obtained with the DLCD model, using a weight               izing the perpetrators or in mitigating the effects of illegal de-
of 0.1 for the no-deforestation class and a weight of 0.9 for the     forestation.
deforestation class, and a γ equal to 0 (DLCD-1). In this scen-
ario, the DLCD-1 variant outperformed both Early Fusion and
Siamese Networks by 8.6% and 8.9%, respectively.                                            7. CONCLUSION
When using one, two and three tiles for training, the DLCD-1
variant outperformed both Early Fusion and Siamese Networks           In this work we evaluated three deep learning-based methods
methods by, respectively, 20.5% and 16.3% for one training tile;      employed for the task of deforestation detection in the Amazon
14.4% and 13.1% for two training tiles; and 9.3% and 8.6% for         rainforest. We compared the performances of two previously
three training tiles.                                                 presented methods: Early Fusion (EF), Siamese Convolutional
                                                                      Neural Network (S-CNN), with the one of a method based on
In terms of Overall Accuracy, the best result, when using 4 tiles     the DeepLabv3+ model, implemented in this work.
for training, was obtained using weight of 0.5 for both deforest-
ation and no-deforestation classes, with γ equal to 1 (DLCD-3),       We evaluated the methods over Landsat OLI-8 images, acquired
with a score of 98.8%. In this scenario, the DLCD-3 variant           in 2016 and 2017 over the same region of the Brazilian Legal
outperformed the Early Fusion and Siamese Networks methods            Amazon, and used deforestation polygons produced by the PRO-
by 0.97% and 0.77%, respectively. The same weight configur-           DES deforestation monitoring project, of the Brazilian National
ation but with a γ of 2 (DLCD-4) obtained a similar score of          Space Research Institute (INPE), as references.

                                                This contribution has been peer-reviewed.
                 https://doi.org/10.5194/isprs-archives-XLIII-B3-2020-1497-2020 | © Authors 2020. CC BY 4.0 License.              1502
The International Archives of the Photogrammetry, Remote Sensing and Spatial Information Sciences, Volume XLIII-B3-2020, 2020
XXIV ISPRS Congress (2020 edition)
We also evaluated the methods with varying sizes of training Chollet, F., 2016. Xception: Deep Learning with Depth-
sample sets, and, in the case of the proposed DeepLabv3+ meth- wise Separable Convolutions. CoRR, abs/1610.02357.
od, we tested various combinations of parameters of the fo- http://arxiv.org/abs/1610.02357.
cal loss function, used in the training procedure. The results
showed that all variants of the proposed method significantly Chu, Y., Cao, G., Hayat, H., 2016. Change detection of remote
outperformed the EF and S-CNN methods in terms of F1-score, sensing image based on deep neural networks. 2016 2nd In-
and also yielded better Overall Accuracy results. ternational Conference on Artificial Intelligence and Industrial
Engineering (AIIE 2016), Atlantis Press, 262–267.
The gains in performance were even more significant when lim- Dai, J., Qi, H., Xiong, Y., Li, Y., Zhang, G., Hu, H., Wei, Y.,
ited amounts of samples were used in training the deep learning 2017. Deformable Convolutional Networks. 2017 IEEE Inter-
models, which indicates that the proposed method has a better national Conference on Computer Vision (ICCV), 764-773.
generalization capacity than the evaluated counterparts. While
no important gains were noted by varying the parameters of Daudt, R. C., Le Saux, B., Boulch, A., Gousseau, Y., 2018.
the selected loss function, this seems to indicate that proposed Urban change detection for multispectral earth observation us-
method deals satisfactory with high class imbalance. ing convolutional neural networks. IGARSS 2018 - 2018 IEEE
International Geoscience and Remote Sensing Symposium,
A natural path for further investigation is to evaluate the pro- 2115–2118.
posed method using data from other sensors, especially from
SAR systems, since cloud coverage is a critical problem for de Jong, K. L., Bosman, A. S., 2019. Unsupervised change
forest monitoring in tropical regions. detection in satellite images using convolutional neural net-
works. 2019 International Joint Conference on Neural Net-
Additionally, in this work we evaluated the proposed method works (IJCNN), 1–8.
considering a specific site in the Brazilian Legal Amazon. Fur-
De Sy, V., Herold, M., Achard, F., Beuchle, R., Clevers, J.,
ther studies should be carried out to investigate the transferab-
Lindquist, E., Verchot, L., 2015. Land use patterns and related
ility potential of the method, e.g., evaluating its performance
carbon losses following deforestation in south america. Envir-
when training with samples from a particular site, and testing
onmental Research Letters, 10(12).
on images covering different sites in the Amazon.
Diniz, C. G., d. A. Souza, A. A., Santos, D. C., Dias, M. C.,
d. Luz, N. C., d. Moraes, D. R. V., Maia, J. S., Gomes, A. R.,
ACKNOWLEDGEMENTS d. S. Narvaes, I., Valeriano, D. M., Maurano, L. E. P., Adami,
M., 2015. DETER-B: The New Amazon Near Real-Time De-
This work is supported by CNPq (Conselho Nacional de Desen- forestation Detection System. IEEE Journal of Selected Topics
volvimento Cientı́fico e Tecnológico), CAPES (Coordenação in Applied Earth Observations and Remote Sensing, 8(7), 3619-
de Aperfeiçoamento de Pessoal de Nı́vel Superior), and FAPERJ 3628.
(Fundação de Amparo à Pesquisa do Estado do Rio de Janeiro).
Goodman, R., Aramburu, M., Gopalakrishna, T., Putz, F.,
Gutiérrez, N., Alvarez, J., Aguilar-Amuchastegui, N., Ellis,
REFERENCES P., 2019. Carbon emissions and potential emissions reductions
from low-intensity selective logging in southwestern Amazo-
Assunção, J., Rocha, R., 2019. Getting greener by going black: nia. Forest Ecology and Management, 439, 18-27.
the effect of blacklisting municipalities on Amazon deforesta-
tion. Environment and Development Economics, 24, 115-137. Guo, H., Viktor, H. L., 2004. Learning from Imbalanced Data
Sets with Boosting and Data Generation: The DataBoost-
Carlson, T. N., Ripley, D. A., 1997. On the rela- IM Approach. SIGKDD Explor. Newsl., 6(1), 30–39. ht-
tion between NDVI, fractional vegetation cover, and leaf tps://doi.org/10.1145/1007730.1007736.
area index. Remote Sensing of Environment, 62(3), 241 -
252. http://www.sciencedirect.com/science/article/ Guo, X., Chen, Y., Liu, X., Zhao, Y., 2020. Extraction of snow
pii/S0034425797001041. cover from high-resolution remote sensing imagery using deep
learning on a small dataset. Remote Sensing Letters, 11(1), 66-
Chen, L.-C., Papandreou, G., Kokkinos, I., Murphy, K., Yuille, 75. https://doi.org/10.1080/2150704X.2019.1686548.
A. L., 2014. Semantic Image Segmentation with Deep Convolu-
Howard, A. G., Zhu, M., Chen, B., Kalenichenko, D., Wang,
tional Nets and Fully Connected CRFs. CoRR, abs/1412.7062.
W., Weyand, T., Andreetto, M., Adam, H., 2017. MobileN-
Chen, L., Papandreou, G., Kokkinos, I., Murphy, K., Yuille, ets: Efficient Convolutional Neural Networks for Mobile Vision
A. L., 2018a. DeepLab: Semantic Image Segmentation with Applications. ArXiv, abs/1704.04861.
Deep Convolutional Nets, Atrous Convolution, and Fully Con- Ioffe, S., Szegedy, C., 2015. Batch Normalization: Accelerating
nected CRFs. IEEE Transactions on Pattern Analysis and Ma- Deep Network Training by Reducing Internal Covariate Shift.
chine Intelligence, 40(4), 834-848. ArXiv, abs/1502.03167.
Chen, L., Papandreou, G., Schroff, F., Adam, H., 2017. Re- ISPRS, 2020. ISPRS 2d semantic labeling challenge.
thinking Atrous Convolution for Semantic Image Segmenta- http://www2.isprs.org/commissions/comm3/wg4/
tion. CoRR, abs/1706.05587. http://arxiv.org/abs/1706.05587. semantic-labeling.html. Accessed: 2020-02-03.
Chen, L., Zhu, Y., Papandreou, G., Schroff, F., Adam, H., Ji, S., Wei, S., Lu, M., 2019. A scale robust convolutional neural
2018b. Encoder-Decoder with Atrous Separable Convolution network for automatic building extraction from aerial and satel-
for Semantic Image Segmentation. CoRR, abs/1802.02611. lite imagery. International Journal of Remote Sensing, 40(9),
http://arxiv.org/abs/1802.02611. 3308-3322.
This contribution has been peer-reviewed.
https://doi.org/10.5194/isprs-archives-XLIII-B3-2020-1497-2020 | © Authors 2020. CC BY 4.0 License. 1503The International Archives of the Photogrammetry, Remote Sensing and Spatial Information Sciences, Volume XLIII-B3-2020, 2020
XXIV ISPRS Congress (2020 edition)
(a) T1 - 2016 (b) T2 - 2017
Figure 7. Test tile number 6.
(a) EF (b) S-CNN (c) DLCD-1
True Deforestation False Deforestation
True No-Deforestation False No-Deforestation
Figure 8. Change maps predicted by EF, S-CNN and DLCD-1 on test tile number 6.
(a) T1 - 2016 (b) T2 - 2017
Figure 9. Test tile number 14.
(a) EF (b) S-CNN (c) DLCD-1
True Deforestation False Deforestation
True No-Deforestation False No-Deforestation
Figure 10. Change maps predicted by EF, S-CNN and DLCD-1 on test tile number 14.
Krähenbühl, P., Koltun, V., 2011. Efficient inference in fully Lin, T., Goyal, P., Girshick, R. B., He, K., Dollár, P., 2017.
connected CRFs with Gaussian edge potentials. Advances in Focal Loss for Dense Object Detection. CoRR, abs/1708.02002.
Neural Information Processing Systems, 24, 109-117. http://arxiv.org/abs/1708.02002.
This contribution has been peer-reviewed.
https://doi.org/10.5194/isprs-archives-XLIII-B3-2020-1497-2020 | © Authors 2020. CC BY 4.0 License. 1504The International Archives of the Photogrammetry, Remote Sensing and Spatial Information Sciences, Volume XLIII-B3-2020, 2020
XXIV ISPRS Congress (2020 edition)
Liu, W., Rabinovich, A., Berg, A. C., 2015. ParseNet: Looking Yao, X., yang, h., Wu, Y., Penghai, W., Wang, B., Zhou, X.,
Wider to See Better. ArXiv, abs/1506.04579. Wang, S., 2019. Land Use Classification of the Deep Convo-
lutional Neural Network Method Reducing the Loss of Spatial
Lovejoy, T. E., Nobre, C., 2018. Amazon Tipping Point. Sci- Features. Sensors, 19, 2792.
ence Advances, 4(2).
Zhang, C., Wei, S., Ji, S., Lu, M., 2019. Detecting Large-
Malingreau, J., Eva, H., de Miranda, E., 2012. Brazilian Scale Urban Land Cover Changes from Very High Resolu-
Amazon: a significant five year drop in deforestation rates but tion Remote Sensing Images Using CNN-Based Classification.
figures are on the rise again. Ambio, 41(3), 309-314. ISPRS International Journal of Geo-Information, 8(4), 189.
Mallat, S., 2018. A Wavelet Tour of Signal Processing. 3 edn, http://dx.doi.org/10.3390/ijgi8040189.
Academic Press, Cambridge, MA, 832.
Zhang, Z., Vosselman, G., Gerke, M., Tuia, D., Yang, M. Y.,
Mnih, V., 2013. Machine Learning for Aerial Image Labeling. 2018. Change detection between multimodal remote sensing
PhD thesis, University of Toronto. data using siamese cnn.
Nogueron, R., Barreto, P., Souza Jr, C., Anderson, A., Salomão,
R., 2006. Human pressure on the Brazilian Amazon forests.
World Resources Institute, Washington, DC.
Ortega, M., Castro, J., Nigri Happ, P., Gomes, A., Feitosa, R.,
2019. Evaluation of Deep Learning Techniques for Deforesta-
tion Detection in the Amazon Forest. ISPRS Annals of Photo-
grammetry, Remote Sensing and Spatial Information Sciences,
IV-2/W7, 121-128.
Peng, Y., Sun, S., Pan, Y., Li, R., 2019. Robust Semantic Seg-
mentation By Dense Fusion Network On Blurred VHR Remote
Sensing Images. arXiv e-prints, arXiv:1903.02702.
Sathler, D., Adamo, S., Lima, E., 2018. Deforestation and local
sustainable development in Brazilian Legal Amazonia: an ex-
ploratory analysis. Ecology and Society, 23(2).
Shimabukuro, Y., dos Santos, J., Formaggio, A., Duarte, V.,
Rudorff, B., 2013. The brazilian amazon monitoring program:
Prodes and deter projects. F. Archard, M. Hansen (eds), Global
Forest Monitoring from Earth Observation, CRC Press, Boca
Raton, chapter 9, 167–184.
Shimabukuro, Y., Duarte, V., Anderson, L., Valeriano, D., Arai,
E., Freitas, R., Rudorff, B. F., Moreira, M., 2006. Near real
time detection of deforestation in the Brazilian Amazon us-
ing MODIS imagery. Ambiente e Agua - An Interdisciplinary
Journal of Applied Science, 1(1), 37-47.
The Worldwatch Institute, 2015. Vital Signs Volume 22 - The
Trends That Are Shaping Our Future. Island Press.
Valeriano, D. M., Mello, E. M. K., Moreira, J. C., Shimabukuro,
Y. E., Duarte, V., Souza, I. M., dos Santos, J. R., Barbosa, C.
C. F., de Souza, R. C. M., 2004. Monitoring tropical forest from
space: the PRODES digital project. The International Archives
of the Photogrammetry, Remote Sensing and Spatial Informa-
tion Sciences, XXXV(B7), 272–274.
Wang, J., Shen, L., Qiao, W., Dai, Y., Li, Z., 2019. Deep
Feature Fusion with Integration of Residual Connection and
Attention Model for Classification of VHR Remote Sensing
Images. Remote Sensing, 11(13). https://www.mdpi.com/2072-
4292/11/13/1617.
World Wildlife Fund, 2020a. Places: Amazon. https://www.
worldwildlife.org/places/amazon. Accessed: 2020-02-
20.
World Wildlife Fund, 2020b. Amazon deforestation. https:
//wwf.panda.org/our_work/forests/deforestation_
fronts2/deforestation_in_the_amazon. Accessed:
2020-02-20.
This contribution has been peer-reviewed.
https://doi.org/10.5194/isprs-archives-XLIII-B3-2020-1497-2020 | © Authors 2020. CC BY 4.0 License. 1505You can also read