Evolutionary Characteristics of Project Interdependent Network within National Quality Award Projects of China - E3S Web of Conferences
←
→
Page content transcription
If your browser does not render page correctly, please read the page content below
E3S Web of Conferences 253, 01067 (2021) https://doi.org/10.1051/e3sconf/202125301067
EEM 2021

 Evolutionary Characteristics of Project Interdependent Network
 within National Quality Award Projects of China
 Lixin Fu1,a,Liang Liu2*,b
 1 School of Management, Shanghai University Shanghai 200444, China
 2 School of Management, Shanghai University Shanghai 200444, China

 Abstract. The research on the evolutionary law of project interdependent network is the innovation in
 construction industry. Based on the complex network theory and method, this research establishes the project-
 project correlation network, and it is built based on the actual case of the National Quality Award Projects of
 China (NQAPC). We aim to systematically analyze the structural characteristics and evolution mechanism of
 the project interdependent network by using global network parameters. As network size increases, the degree
 follows power-law distribution, the average path length tends to decrease, and the clustering coefficient and
 heterogeneity gradually increases. The research results may help managers achieve higher performance in
 strategic network management of construction projects.

 that project program managers should explore the
 1 Introduction management methods that adapt to the specific
 characteristics of the project program, such as culture,
 As an extension of the project concept, the project political environment and organizational challenges, from
 program is a group of interrelated projects that need to be a strategic perspective 5. Partington et al. divided the
 coordinated and managed 1. The project program is a competitiveness of the project program management into
 strategic community composed of several different sub- four levels, and constructed an analysis framework for
 projects according to a specific structure. There are competitiveness of project program management 6.
 temporal, geographical or logical interrelationships The interdependence of multiple projects in the project
 between the projects 2. In addition, during the program forms an intricately correlated system 7.
 implementation of the project program, there are Complex network is an abstraction of complex system,
 uncertainties such as fierce resource conflicts, the and it can effectively describe the topological structure of
 changing industry environment and target constraints 3. complex system, revealing the hidden laws of complex
 Thereby, the effective management of the project program system from the structural point of view 8. At present, the
 needs to be based on complex thinking and theory, from a research on the relationship structure of project-project
 strategic height, in order to obtain the overall goal of the correlation network has been widely carried out in the
 project program and the emergence of organizational fields of finance, technology, innovation, and R&D
 functions. projects. For example, Zaabi used several social network
 Traditionally, the standard for measuring the success system indicators to analyze the interdependence of
 of a project is to "complete the project on time, within projects based on the network and node levels 9. Pardis et
 budget and within prescribed standards", but it is far from al. used network analysis methods to better understand the
 enough to measure the success of the project program. The relationship and interdependence between basic fast-
 project program management has complex interface, long tracking practices in the construction industry 10. In
 implementation cycle, large capital investment, heavy general, the specific research on this aspect of the
 workload of organizational coordination, and strong construction industry is still in the exploratory stage.
 interaction with external environment. Therefore, There is a lack of consideration of the interdependence of
 managing large-scale project program by using traditional large-scale engineering projects at the national or industry
 project management knowledge system and tools has level, and the research on the related network structure and
 induced several problems such as loss of control of goals, evolution of the project program is even rarer.
 delayed decision-making, low organizational efficiency, To address this research gap, based on the case of the
 unbalanced resources, and information asymmetry 4. How National Quality Award Projects of China (NQAPC), this
 to better control the project status and process, and research builds a project-project correlation network
 coordinate the organization's interests and conflicts has based on organization associations, and uses global
 become an urgent problem to be solved. After reviewing network parameters to systematically analyze the
 the previous research literature, Mark et al. put forward structural characteristics and evolution mechanism of the

 ae-mail: flx_naughty@163.com
 b* Corresponding author: e-mail: liangliu@shu.edu.cn

© The Authors, published by EDP Sciences. This is an open access article distributed under the terms of the Creative Commons Attribution
License 4.0 (http://creativecommons.org/licenses/by/4.0/).
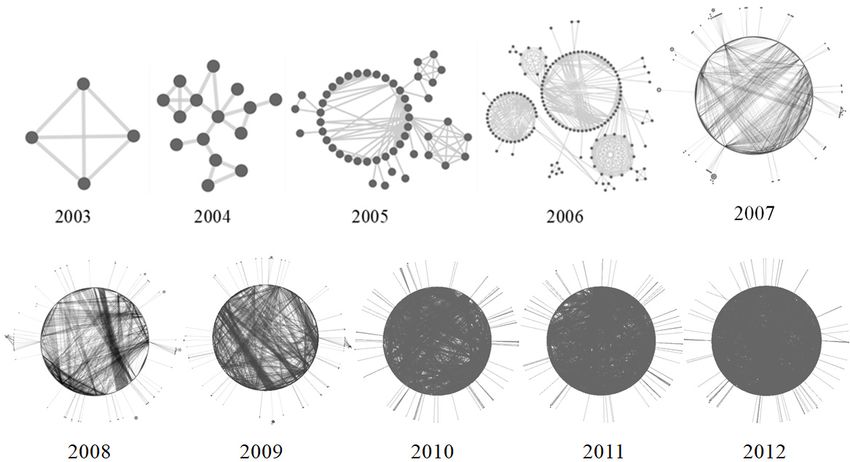
E3S Web of Conferences 253, 01067 (2021) https://doi.org/10.1051/e3sconf/202125301067
EEM 2021

 project interdependent network. The innovations of this 2 Basic network analysis parameters
 study are: we transform the traditional dichotomous
 network from the organization projection to the project To analyze the topology properties of the NQAPC project
 projection, and propose to shift from the inter- interdependent network, we use seven selected network-
 organizational network based on project cooperation to the level global measurement parameters, namely density,
 inter-project network based on organizational diameter, average degree, degree distribution,
 relationships. We use complex network methods to the in- heterogeneity, clustering coefficient and average path
 depth identification of the project network evolution length etc. The theoretical definition and practical
 characteristics at the national level. The research results significance of all selected parameters are summarized in
 may help managers to achieve higher performance of Table 1.
 strategic network management in construction project
 management.
 TABLE Ⅰ. Theoretical definition and practical significance of network-level parameters

 Name Theoretical definition Practical significance
 The ratio of actual connections in the network to the maximum A higher density represents a higher project relevance of the
 Density
 number of possible connections network, and the network has a stronger cohesion.
 The maximum value of the geodesic distance between all pairs The larger the diameter, the more difficult the communication
 Diameter
 of nodes in the network between these projects.
 Average The higher the average degree, the larger the scale of the network
 The average degree of all nodes in the network and the closer the network connection.
 degree
 The degree distribution of the project program network represents
 Degree node degree distribution function P(k) or cumulative degree
 the probability that a randomly selected project has k directly
 distribution distribution function P(>k)
 correlated.
 A measure of the degree of uniformity of node distribution (in Reflecting certain tendency and disorder of the network structure
 Heterogeneit undirected networks, the degree of heterogeneity of regular caused by the uneven distribution of project characteristics, the
 y networks is 0; in scale-free networks, the degree of greater the degree of network heterogeneity, the more complicated
 heterogeneity is higher than regular network) the connection of each project in the network.
 Average Explain the professional distance between different projects, the
 The average clustering coefficient of the network is the
 clustering homology of contractors, and the transferability of cooperation
 average of the clustering coefficients of all nodes
 coefficient between common contractors among projects, etc.
 Average path The average of the shortest path length of all nodes in the The smaller the average path length, the easier the information
 length network transmission between the projects.

 This study takes the project interdependent network of
 3 A case study of the NQAPC network NQAPC as the case. Considering the authority and
 completeness of published data, a bipartite network is
 firstly established based on the awarded projects and the
 3.1 The NQAPC network model contractors from 2003 to 2012. Fig. 1 shows a schematic
 view for explaining the bipartite network and its
 In the construction industry of China, the scale of
 projection. The upper nodes are regarded as the contractor
 engineering projects is increasing, involving more
 organizations, while the lower nodes are the award
 technical fields and wider geographical range. Such mega-
 winning projects. Then, based on the complex network
 project program needs to be completed by a large number
 modeling and analysis method, this research build the
 of contractors with various professional qualifications and
 cumulative largest interconnected cluster topology of the
 technical advantages. As a part of the Chinese Quality
 NQAPC network from 2003 to 2012 by using Cytoscape
 Product Award, the National Quality Projects Award is the
 software, as is shown in Fig. 2, giving us a good
 highest honor award in terms of construction quality
 understanding of the evolution of the range and
 (http://www.cacem.com.cn/), as well as the earliest
 configuration of the networks over time.
 national quality award with the highest specification
 Table 2 shows the statistical data of the overall
 requirements in the construction industry in China. The
 NQAPC network from 2003 to 2012. Statistics show that
 National Quality Project Award covers 10 types of projects,
 the NQAPC network as of 2012 contains 1,307 award-
 including housing construction, municipal engineering,
 winning projects and 948 contractors. With the increase of
 railway, highway, electric power, chemical engineering,
 the project interdependent network, the proportion of
 smelting, port, water conservancy and communications,
 projects within the largest component to the total number
 and the award targets include project enterprises in
 of projects increases rapidly, from 7.41% in 2003 to 82.1%
 construction, design and consulting. Since its
 in 2012. The number of project interconnections within
 establishment in 1981, 1410 engineering projects have
 the largest component, M (i.e., the number of network
 been awarded successively, among which 50 have won the
 edges), from less than ten to tens of thousands, indicating
 gold medal and 1360 have won the silver medal,
 that the number of contractors shared by different projects
 representing the highest level of project quality in the
 through organizational association (technical cooperation
 construction industry of China.
 or resource sharing) is increasing, and the project

 2
E3S Web of Conferences 253, 01067 (2021) https://doi.org/10.1051/e3sconf/202125301067
EEM 2021

 correlations become more common. This study mainly In this section, we will explore the structural evolution of
 analyzes the largest component of the NQAPC network the NQAPC network. In particular, we use the seven
 from 2003 to 2012. This is for two reasons: On the one network-level global measurement parameters selected in
 hand, the largest component contains at least 80% of the Table 1 to characterize the structural evolution of the
 projects in the whole network, which can accurately largest component. And based on the network
 express the interconnection mode and basic characteristics characteristics, we discuss how to cultivate a strong and
 of the NQAPC network. On the other hand, it can avoid effective construction mode of project program network to
 the calculation error of network global parameters caused help us understand the project interdependent network
 by the existence of a few isolated nodes or small connected more deeply and comprehensively. Since the largest
 component. component in 2003 is quite small, the global measurement
 of the connection network in 2003 is meaningless,
 therefore, it is excluded.

 Figure 1. Schematic view for explaining bipartite graph and its
 projection

 Figure 2. The cumulative largest interconnected cluster
 3.2 Structural evolution analysis of the NQAPC topology of the NQAPC network (2003-2012)
 network
 Table Ⅱ. Total network statistics of the NQAPC from 2003 to 2012

 Year
 2003 2004 2005 2006 2007 2008 2009 2010 2011 2012
 Statistical characteristic
 number of projects each year 54 74 86 116 155 138 149 145 191 199

 number of contractors each year 91 142 158 201 237 210 296 273 333 281

 number of projects up to year 54 128 214 330 485 623 772 917 1108 1307

 Number of contractors up to year 91 207 296 400 500 590 680 767 863 948
 number of nodes (projects) in the largest component up
 4 15 49 152 336 465 587 731 905 1073
 to year
 number of nodes (projects) in the largest component up
 7.41 11.72 22.9 46.06 69.28 74.64 76.04 79.72 81.68 82.10
 to year(as a percentage %)

 number of edges (interconnections) in the largest
 6 20 131 560 1606 2848 4262 6024 8251 11563
 component up to year

 projects are embedded in the network. Fig. 3b shows that
 3.2.1 Density decreases and diameter fluctuates as the scale of the network increases, the network diameter
 experiences fluctuations in the first few years, and finally
 Fig. 3 shows the evolution of the density and diameter of stabilizes at 9 (we set the distance between two adjacent
 the NQAPC network over the years from 2003 to 2012. It projects to 1). This shows that when the network size
 can be seen from Fig. 3a, that as the scale of the project increases to a certain extent, any two projects in the
 interdependent network increases, the overall network network can be established a connection with other
 density decreases sharply from 0.19 (2004) to 0.02 (2012), projects less than 10 steps, indicating that the NQAPC has
 and the network becomes more and more sparse. This greater relevance. And it also shows that the domestic
 indicates many newly added projects only share a few contractor market is very active. Contractors with multiple
 contractors with part of the original projects in the network. qualifications have participated in different types of
 This is consistent with the actual phenomenon. Because projects, and a few key contractors involved in a large
 the size of a project is limited, it only needs to work with number of projects, forming a bridge between projects,
 part of the contractors who can complete the project. At leading to "ten-degree connected spaces."
 the same time, these contractors are involved in the
 construction of other projects. Through the connection of
 these contractors with the existing projects, the new

 3
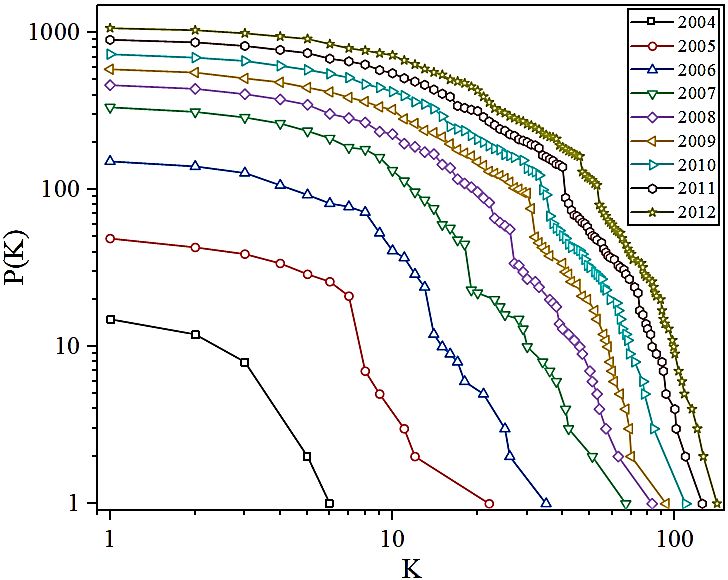
E3S Web of Conferences 253, 01067 (2021) https://doi.org/10.1051/e3sconf/202125301067
EEM 2021

 Figure 3. Evolution of the density and diameter of the Figure 4. Evolution of the average degree and heterogeneity of
 cumulative largest component up to the given year. the cumulative largest component up to the given year.

 3.2.2 Average degree and heterogeneity increases 3.2.3 Degree distribution follows the same rule
 with time
 A typical widely studied global network attribute is the
 The average degree, that is, the average number of edges distribution of node degree. The statistical results show
 (connection) per node (project), can represent the that the degree distribution of many large-scale networks
 connectivity of the overall network. Fig. 4a shows that as obeys the power-law distribution. Researchers call this
 the network scale develops, the average degree of the kind of network scale-free network 11. The graph of the
 network increases linearly, and it increases dramatically distribution P� � of the number of connection k for each
 from an initial value of 2.667 in 2004 to 21.553 in 2012. project is quite rugged, especially at the tail of the
 This indicates that, as time goes by, due to the addition of distribution. Instead, we use the cumulative form, which
 new projects, the number of nodes increase, and the total can effectively reduce the number of statistical errors
 edge growth is faster than that of projects. Because the caused by the system size, while the shape of the
 new edges not only come from the connections between distribution is well preserved 12. Fig. 5 shows that from
 the new projects, but also from the connections between 2004 to 2012, the NQAPC network presents an
 the new projects and the existing projects in the network. approximate degree distribution, and its distribution
 The number of nodes and edges of the largest component characteristics are mainly reflected in more nodes with
 during 2003-2012 shown in Table 2 can confirm this. By small degree and less nodes with large degree. As shown
 2012, the average degree of the network was 21.553, in Figure 5, the range of degree is between 1 ~ 141, and
 which means that each project is directly related to more there are only 9 nodes with degree more than 100; the
 than 21 projects on average. People can say that the number of nodes with degree between 1 ~ 25 is more than
 connections between NQAPC projects are close. 70% of the total number of nodes, which indicates that the
 In the field of complex networks, "network degree distribution of NQAPC network follows the
 heterogeneity" is regarded as an abstract concept, power-law distribution, and the network has obvious
 reflecting a tendency and disorder of the whole network scale-free characteristics.
 structure, caused by the uneven distribution of nodes. Fig.
 4b shows that as the scale of the NQAPC network
 increases, the heterogeneity of the network highlights two
 distinct time periods: a first term (2004–2008) during
 which increases sharply from about 0.5 (2004) to 0.9
 (2008), and a second term (2009–2012), during which the
 growth slows down from 0.9 in 2009 to close to 1 in 2012.
 It indicates that the degree of difference in the
 characteristics of the network is increasing, and the
 characteristics of the projects are more scattered. For
 example, with the continuous improvement of the
 country's economic, scientific and technological level, the Figure 5. Evolution of the cumulative degree distribution of the
 investment in the field of engineering has increased largest component up to the given year.
 substantially, and the scope gradually covers ten types of
 engineering majors, including housing construction,
 municipal engineering, railways, highways, electric power, 3.2.4 The clustering coefficient increases while
 chemical engineering, smelting, ports, water conservancy average path length decreases
 and communications. Moreover, different contractors in
 The global clustering coefficient of the NQAPC network
 the NQAPC network have differences in professionalism,
 also shows a steady rising trend, and the value is generally
 qualifications, influence, etc., making the network
 large (> 0.7), as is shown in Fig. 6a. This indicates that the
 structure dependent on the bridging of some important
 larger the scale of the network, the greater the degree of
 nodes. The activity capacity and the level of related
 clustering among projects and the more intensive the
 projects of the project vary greatly in the network.
 connection, showing a trend of network collectivization.
 However, after 2009, the clustering coefficient of the
 cumulative network decreases slightly, from 0.789 (2008)

 4
E3S Web of Conferences 253, 01067 (2021) https://doi.org/10.1051/e3sconf/202125301067 EEM 2021 to 0.779 (2012). The possible reason is that most of the statistics of the project-project correlation network up to newly added projects are relatively small in scale and 2012: simple in technology, requiring fewer types and numbers With the development of China's construction of contractors. These projects share few contractors with industry, the network structure of NQAPC has very few projects in the network, eventually forming a undergone a structural shift from an unconnected situation of edge embedding. Moreover, the clustering small network to a larger network. In our case, coefficient in the NQAPC network tells us the extent to the scale of mega component in 2012 was 1073 which contractors are willing to cooperate with each other. award-winning projects, accounting for 82.1% of For the project interdependent network after 2006, there is the total project network. This means that 82.1% a very strong cluster C> 0.77. According to the definition of the projects in the NQAPC network belong to of clustering, a new project continued to be undertaken by the same community, and each project in the a contractor who has participated in at least two projects community is linked to each other through some will be added to the network with a clustering coefficient direct and indirect connections. of 1, this is also the reason why the network can maintain Statistics show that as the scale of the project a high clustering coefficient. program becomes larger, the density of the Fig. 6b shows the evolution of the average path length NQAPC network gradually decreases. The of the NQAPC network. It increases sharply to 4.578 in average number of direct connections per project 2007, during the first term; then it continues to decline increases year by year, as of 2012, the average during the second term, and finally stays at 3.456 in 2012. degree has increased to 21.553. It shows that the This indicates that the domestic engineering contractor NQAPC network is still growing, the relationship market has experienced a stage, from rapid filling in between contractors is getting closer, and the quantity to continuous development and growth in Chinese construction market is currently not in qualifications. Some core contractors have gradually danger of splitting. contracted diversified and complex engineering projects, According to complex network theory, the which has greatly shortened the distance between projects. NQAPC network exhibits short average path Overall, the average path length of the project lengths and high clustering coefficients, such as interdependent network is around 3.5, demonstrating that the average path length finally stabilizes at 3.456 a pair of two projects requires up to four intermediate in 2012, and the clustering coefficients is points to be connected, which will have a profound impact generally higher than 0.77 after 2006, which has on the operation of the construction community. The small obvious small-world characteristics, indicating "average path length" between projects allows for the that within giant component, projects become rapid diffusion of new ideas, technologies, and resources closely linked through organizational among members, in the process of participating in the cooperation. At the same time, the degree construction of large-scale projects, which is conducive to distribution of the NQAPC network follows the contractors to learn from the experience of successful same rule, showing obvious scale-free. projects, and to improve project performance. Network analysis method provides a new perspective to deeply understand the evolution characteristics of the construction industry. This research emphasizes the importance of the global network view by analyzing actual connection cases in the construction field. By selecting seven network-level global measurement parameters, this study analyzed the macro-scale structure of the NQAPC network. These interesting findings can help managers to establish the universality of the cognition and social mechanism behind the construction process, and help Figure 6. Evolution of the clustering coefficient and average contractors to better formulate more reasonable path length of the cumulative largest component up to the given cooperation strategies. Our research must take into year. account some limitations. First of all, due to the limited data samples in China, these findings are not entirely 4 Conclusion suitable for every country. Secondly, due to data collection channels and huge amount of data, the data has gaps for By means of the network analysis method, we abstract the several years, and it is difficult to reflect the latest situation NQAPC project interdependent network from 2003 to in a timely manner. In addition, this study only focuses on 2012. We mainly focuses on the global structure of the the evolution of the network topology at the macro-scale. network, and the constructed network is large, containing Future research can build a multi-scale analysis about 1100 projects, so it is possible to provide reliable framework of project network from motif, module to statistical descriptions of the structural properties. Some global level, using the latest time window data to further meaningful global network metrics are used to empirically explore the characteristics and evolution of the project study the structural evolution of these networks. The interdependent network in the field of construction based following are the findings of the survey and their impact on organizational cooperation. on the construction industry by summarizing most of the 5
E3S Web of Conferences 253, 01067 (2021) https://doi.org/10.1051/e3sconf/202125301067
EEM 2021

 Acknowledgment
 This work is supported by the Natural Science Foundation
 of China (Nos. 71602107 and 71874123), the China
 Scholarship Council (No. 201806895024), and the
 Shanghai Leading Academic Discipline Project (No.
 B310).

 References
 1. P. M. Institute, “A Guide to the project management
 body of knowledge,” Proj. Manag. J. vol. 40(2), pp.
 104-104, June 2009.
 2. J. H. Payne, “Management of multiple simultaneous
 projects: a state-of-the-art review,” Int. J. Proj. Manag.
 vol. 13(3), 1995, pp. 163-168.
 3. M. Martinsuo and P. Hoverfalt, “Change program
 management: toward a capability for managing value-
 oriented, integrated multi-project change in its
 context,” Int. J. Proj. Manag. vol. 36(1), 2018, pp.
 134-146.
 4. Z. Shehu and A. Akintoye, “Major challenges to the
 successful implementation and practice of
 programme management in the construction
 environment: A critical analysis,” Int. J. Proj. Manag.
 vol. 28(1), 2010, pp. 26-39.
 5. M. Lycett, A. Rassau and J. Danson, “Programme
 management: a critical review” Int. J. Proj. Manag.
 vol. 22(4), 2004, pp. 289-299.
 6. D. Partington, S. Pellegrinelli, M. Young, “Attributes
 and levels of programme management competence:
 an interpretive study,” Int. J. Proj. Manag. vol. 23(2),
 2005, pp. 87-95.
 7. J. Geraldi, H, Maylor and T. Williams, “Now, let's
 make it really complex (complicated): a systematic
 review of the complexities of projects,” Int. J. Oper.
 Prod. Manage. vol. 31(9), 2015, pp. 966 - 990.
 8. S. Boccaletti, V. Latora, Y. Moreno, M. Chavez and D.
 U. Hwang, “Complex networks: structure and
 dynamics” Complex Systems and Complexity
 Science. vol. 424(4-5), 2006, pp. 175–308.
 9. H. A. Zaabi and H. Bashir, “Analyzing
 interdependencies in a project portfolio using social
 network analysis metrics,” International Conference
 on Industrial Engineering and Applications (ICIEA),
 Singapore, 2018, pp. 490-494.
 10. P. B. Pardis, R. B. Austin and J. M. de la Garza,
 “Network Analysis of Flash-Track Practices” J.
 Manage. Eng, vol. 33(1), 2016, pp. 04016024.
 11. R. Albert and A. L. Barabasi, “Statistical mechanics
 of complex networks,” Rev. Mod. Phys. vol. 74(1), pp.
 47-97, June 2001.
 12. M. E. J. Newman, “The structure and function of
 complex networks” SIAM Rev. vol. 45, pp. 167–256,
 March 2003.

 6
You can also read