Distribution, Fidelity, and Abundance of Rio Grande Wild Turkey Roosts in the Texas Coastal Sand Plains
←
→
Page content transcription
If your browser does not render page correctly, please read the page content below
Distribution, Fidelity, and Abundance of Rio Grande Wild Turkey Roosts in the Texas Coastal
Sand Plains
Robert J. Caveny1, Department of Wildlife and Fisheries Sciences, Texas A&M University, College Station, TX 77843
Stephen J. Voelkel, Department of Animal, Rangeland and Wildlife Management, Texas A&M University-Kingsville, Kingsville, TX 78363
William T. Brademan, Department of Ecosystem Science and Management, Texas A&M University, College Station, TX 77843
Jason B. Hardin, Texas Parks and Wildlife Department, Palestine, TX 75803
Markus J. Peterson, Department of Wildlife and Fisheries Sciences, Texas A&M University, College Station, TX 77843
Bret A. Collier, Institute of Renewable Natural Resources, Texas A&M University, College Station, TX 77843

Abstract: Sustainable management of wild turkeys (Meleagris gallopavo) requires information on distribution and abundance across the range. Tech-
niques for surveying wild turkey populations in Texas are constrained by land access issues, requiring integration of landowners and managers into
monitoring activities. We evaluated the use of 1) aerial surveys for estimating the distribution of Rio Grande wild turkeys (M. g. intermedia) relative to
roosting habitat, and 2) multiple-observer roost counts for estimating local turkey abundance and roost-site fidelity within the Texas coastal sand plain.
Double observer surveys indicated that detection probabilities varied little between observers, with detection rates typically exceeding 0.80. Estimated
roost-site fidelity was 0.84 with roost-level detection ranging between 0.69 and 0.79. Based on these data, aerial distributional surveys conducted at the
physiographic region scale combined with abundance monitoring using multiple-observer roost counts on a random sample of private lands within
the region should provide a framework for long-term monitoring of Rio Grande wild turkeys in Texas and other semiarid regions of the United States.

Key words: abundance, aerial surveys, distribution, occupancy, Rio Grande wild turkey, roost surveys
                                                                                                   Proc. Annu. Conf. Southeast. Assoc. Fish and Wildl. Agencies: 65:45–50

   Long term data on the distribution and abundance of wildlife                 tive regulatory and conservation efforts began in the early 1900s;
provides baseline data required to drive conservation and man-                  and in the 1930s Rio Grand wild turkeys were translocated from
agement actions. However, wildlife biologists are continually chal-             populations in Texas strongholds to other areas that appeared suit-
lenged by a variety of constraints when developing monitoring                   able.
strategies (Pollock et al. 2002). In addition to logistical and mon-                Rio Grande wild turkeys exhibit annual aggregations during
etary restrictions, property access restrictions complicate moni-               fall and winter where both sexes concentrate into large groups
toring (Thompson et al. 1998). Thus monitoring programs must                    that often exceed 100 individuals (Thomas et al. 1966, Cook 1973).
accommodate restrictions in sample allocation.                                  Typically, these phonologically-driven concentrations occur in the
   Before European-American settlement of the western United                    same general areas with birds returning to roost sites annually for
States, Rio Grande wild turkeys (Meleagris gallopavo intermedia)                many years (Thomas et al. 1966, Cook 1973). Thus, winter roost
were distributed throughout the south-central United States (Kan-               locations represent important habitat components for Rio Grande
sas, Oklahoma, Texas, New Mexico) and northern Mexico, and                      wild turkeys as large flocks forage and rest within relatively close
numbers probably exceeded 1.8 million individuals (Glazener                     proximity of these roosts (Crockett 1973, Guthrie et al. 2011).
1967). A combination of overhunting, heavy livestock grazing, and               Roost-use phenology has been useful for collecting garnering
habitat conversion to cropland during the 1800s led to a precipi-               data on Rio Grande turkey populations at the local scale, typically
tous decline in Rio Grande wild turkey numbers, with strongholds                via roost surveys conducted by wildlife biologists or landowners
remaining in the Edwards Plateau and South Texas Plains ecore-                  (Cook 1973, Butler et al. 2006).
gions of Texas;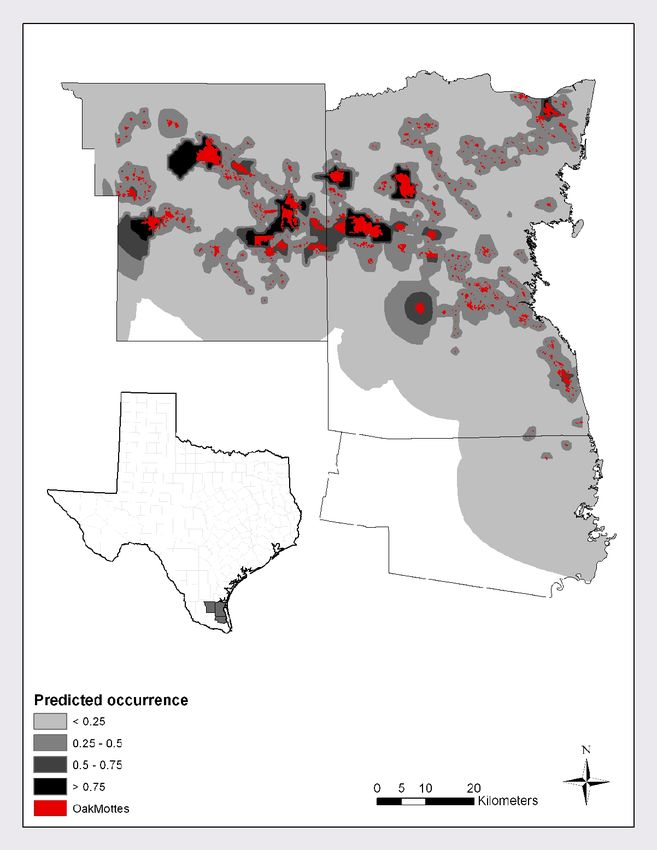
Roost Distribution and Abundance   Caveny et al.  46

al. 2006), little effort has focused on identifying or evaluating the   habitat and accurately classified oak mottes >95% of the time. For
relationship between general roost characteristics and local turkey     each transect, we created a set of spatial covariates including size
distribution, roost fidelity, or abundance. Data on these relation-     of nearest oak motte, distance to nearest oak motte, and oak motte
ships are required to identify the most applicable sampling frame       density in each sampling unit for use in predicting turkey distribu-
for monitoring wild turkey populations in Texas. The purpose of         tion relative to roosting habitat.
our study was to evaluate aerial surveys for use in monitoring Rio          During December–February, we conducted roost counts for
Grande wild turkey distribution and abundance in the south Texas        roosts identified from our aerial surveys, historical roost sites
coastal sand plains. Hence, we estimated turkey distribution using      identified by wildlife biologists, and roosts identified during a con-
an aerial survey and occupancy modeling and estimated local abun-       cordant radiotelemetry study on Rio Grande wild turkeys on our
dance and roost sight fidelity using double observer roost surveys.     study site. Once a roost was identified via radio-telemetry and/
                                                                        or visual observation >3 times, to ensure that the roost site was
Study Area                                                              not an artifact of bird location (Chamberlain et al. 2000), we con-
    We conducted our research in the coastal sand plains of Texas       ducted double observer roost surveys (Cook and Jacobson 1979,
(Diamond et al. 1987) in Brooks and Kenedy counties. Our study          Nichols et al. 2000) using two camouflaged observers concealed
site was privately owned and managed for native and exotic wild-        in vegetation within 75 m of the roost and separated by at least
life, hunting, and rotational cattle grazing through a combination      10m to ensure sampling independence. During each roost survey,
of burning (~4 yr rotation), mechanical, and chemical treatments        each observer independently counted the number of unique indi-
which led to more woody vegetation than was present historically        viduals seen approaching or leaving each roost site. We conducted
(Lehmann 1969), primarily in the form of live oak (Quercus fusifor-     morning roost surveys beginning at sunrise and continuing until
mis) mottes (clumps of live oak ranging from 0.5 to 300 ha in size)     all birds had departed the roost, and evening surveys beginning
interspersed in mesquite (Prosopis glandulosa) savannah and mixed       0.5 hr before sunset until dark.
brush scrubland (Scifres 1980). Live oak mottes provide nearly all          We evaluated roost-level fidelity by conducting occupancy sur-
turkey roost habitat in this portion of the coastal sand plains (Cook   veys at six randomly selected roosts using three replicated surveys
1973, Litton and Harwell 1995). Grass species included big blue-        on four consecutive days within a week. Because roosts were locat-
stem (Adropogon gerardii), little bluestem (Sorghastrum nutans),        ed within close proximity we were able to survey multiple roosts
eastern gammagrass (Tripsacum dactyloides), bufflegrass (Pennis-        for occupancy within a given night. We used morning and evening
etum cilare), and King Ranch bluestem (Bothriochloa ischaemum).         surveys, but did not conduct morning surveys on the same roosts
                                                                        where evening surveys were conducted the previous night because
Methods                                                                 presence/absence already was known. However, we conducted
Data Collection                                                         morning surveys followed by evening surveys regardless of occu-
   During 2007 and 2008, we conducted three replicated aerial sur-      pancy during the morning survey.
veys (three surveys conducted three times) on a randomly sampled
set of fixed-width transects (n = 24; 3 km x 1 km in 2007 along a       Analysis
north-south axis, 1 km x 1 km in 2008) to estimate Rio Grande wild         We predicted Rio Grande wild turkey distribution using single
turkey distribution. Transect width was based on a pilot survey         season occupancy models implemented in MARK (White and
conducted in our study region during 2007 and from sightability         Burnham 1999). We developed a set of predictive models for tran-
estimates for Rio Grande wild turkeys from aerial surveys con-          sect occupancy and used Akaike’s Information Criterion (AIC) to
ducted by Beasom (1970) in this same Texas physiographic region.        select the best fitting models given the data using the R (R De-
We flew transects in a Cessna 172 fixed-wing aircraft (USA Flights,     velopment Core Team 2011) package RMark (Laake and Rexstad
Kingsville, Texas) at 75 to 100 m above the ground at approximately     2009) to interface MARK (White and Burnham 1999). Our model
200 km per hour using one observer on each side of the aircraft.        set incorporated spatial and temporal parameters for the occur-
We collected data on presence/absence, total number of flocks seen,     rence process, and observer-level variation in detection rates. We
number of birds per flock, and flock location in Universal Trans-       treated our 2007 surveys as a pilot study to ensure our sampling
verse Mercator coordinates (UTM). Using ArcMap 10 and 2008              methodology was appropriate, and although we provide detection
NAIP imagery we hand-delineated oak mottes and removed all ar-          parameter estimates from the 2007 and 2008 surveys, we based our
eas
Roost Distribution and Abundance Caveny et al. 47
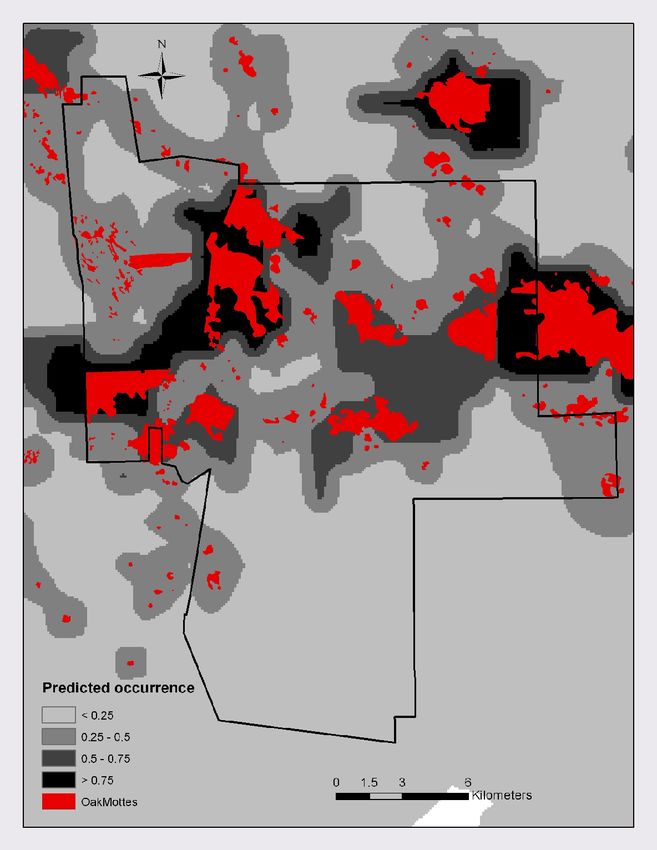
probabilities with DOBSERV (Nichols et al. 2000, Hines 2000), us- effect, including the size and distance to the nearest oak motte,
ing AIC to determine which models that differentiated between lo- we predicted potential turkey distribution at the local study site
cations (roosts) and observer’s best fit the data. We estimated roost scale (Figure 1) and across the range of similar coastal sand plains
fidelity using occupancy modeling in MARK (White and Burn- habitat (Figure 2).
ham 1999). We used a single-species, single season (standard) oc- We used seven different observers during our abundance and
cupancy modeling approach, and constrained our modeling to a fidelity surveys, three in 2007, and four in 2008, with two observ-
simple constant model for occupancy and detection rates because ers overlapping both years. We conducted 100 double observer
1) sites surveyed were at known roosts, so there was no sampling roost surveys with counts ranging from 0 to 183 individuals on 14
uncertainty regarding whether or not sites were used, 2) there were confirmed Rio Grande wild turkey roosts in live oak mottes con-
no biologically relevant factors we believed would adequately rep- centrated in the northern and central portions of our study area.
resent the inherent factors driving roost occupancy over the short Detection probabilities varied little among roosts (Table 3), with
time frame of our study, and 3) we had no expectation that detec- detection rates of the primary observer exceeding 0.80 (Table 4).
tion rates would vary by roost location. Observers overlapping both years of the study had similar detec-
tion probabilities (0.90 and 0.87, respectively). A naïve fidelity esti-
Results mate for our study was 0.72 (presence at 72 of 100 roost surveyed)
Observers made 355 observations of Rio Grande wild turkey with estimated roost site fidelity of ≈0.84 and estimated detection
flocks during aerial surveys across both years of the study. Detec- ranging between 0.69 (SE = 0.11) and 0.79 (SE = 0.09)
tion probabilities for individual surveys ranged between 0.24 and
0.30 across years (Table 1). The best fitting model for the occur-
rence probability (ψ) given the 2008 data was an additive model
including the size of nearest oak motte and the distance to that
motte (Table 2); however, models that incorporated distance to
the nearest oak motte as interactive effects, or not at all, also were
plausible (Table 2). Using the model that incorporated an additive
Table 1. Detection probabilities of replicated (three replicates) Rio Grande
wild turkeys aerial grid occupancy surveys in south Texas during January–
February, 2007 and 2008.
Detection
probability SE 95% CI
Survey 1 – 2007 0.28 0.058 0.18–0.41
Survey 2 – 2007 0.27 0.036 0.21–0.34
Survey 3 – 2007 0.24 0.031 0.18–0.31
Survey 1 – 2008a – – –
Survey 2 – 2008 0.30 0.072 0.18–0.45
Survey 3 – 2008 0.30 0.083 0.16–0.48
a. The initial survey of 2008 had too few detections to independently estimate a
survey-specific detection estimate.
Table 2. Model selection criteria for Rio Grande wild turkey aerial survey conducted in the Texas
coastal sand plain during 2008 used to predict potential distribution relative to roosting habitats.
Model parameters for the underlying detection model (p) and occurrence model (ψ) include a
constant detection (.) as well as effects of distance from nearest motte (Dist) and size of nearest
motte (Size).
Model k AICc ΔAICc wi
p(.), ψ(Dist + Size) 4 394.73 0 0.425
p(.), ψ(Dist + Size + Dist * Size) 5 395.39 0.664 0.305
p(.), ψ(Size) 3 395.64 0.909 0.269 Figure 1. Predicted occurrence probabilities for Rio Grande wild turkeys relative to roosting habitat
p(.), ψ(Dist) 3 406.58 11.85 0.001 within our study area based on aerial surveys conducting during 2007 and 2008 in the coastal sand
p(.), ψ(Dist*Size) 3 417.92 23.18 0 plains region of Texas.
2011 Proc. Annu. Conf. SEAFWARoost Distribution and Abundance Caveny et al. 48
Table 3. Estimated detection probability (P (SE)), total count (number counted), and estimated
roost-level abundance for Rio Grande wild turkey roost surveys during 2007–2008 in the Texas
coastal sand plain.
Detection Probability Abundance
Mean
n Estimated Upper n birds /
Roost Year Counted P SE abundance SE Lower CL CL Counts Count
1 2007 104 0.938 0.0000 110.91 2.71 107.29 118.51 3 36.97
2008 172 1.000 – 172.00 – – – 4 43.00
2 2007 – – – – – – – 3
2008 134 0.991 – 135.25 – – – 3 45.08
3 2007 270 0.991 0.0040 272.61 1.97 270.70 279.71 5 54.52
2008 61 0.987 0.0076 61.83 1.04 61.13 66.54 4 15.46
4 2007 – – – – – – – 3
2008 25 1.000 – 25.00 – – – 5 5.00
5 2007 – – – – – – – 0
2008 29 0.998 0.0018 29.04 0.20 29.00 30.38 3 9.68
6 2007 253 0.991 0.0030 255.32 1.71 253.64 261.44 5 51.06
2008 426 0.998 0.0007 426.91 1.00 426.16 431.23 6 71.15
7 2007 160 0.994 0.0033 160.99 1.13 160.17 165.93 5 32.20
2008 125 0.995 0.0026 125.67 0.88 125.09 129.78 5 25.13
8 2007 513 0.998 0.0010 514.16 1.19 513.22 519.09 6 85.69
2008 12 0.998 0.0010 12.03 0.17 12.00 13.14 3 4.01
9 2007 360 0.579 0.0000 621.09 21.22 582.70 666.11 3 207.03
2008 300 0.996 0.0014 301.19 1.18 300.24 306.01 3 100.40
10 2007 – – – – – – – 1
2008 49 1.000 – 49.00 – – – 3 16.33
11 2007 74 0.955 0.0174 77.52 2.39 75.06 85.74 3 25.84
2008 23 0.999 0.0010 23.01 0.11 23.00 23.74 3 7.67
12 2007 120 0.981 0.0100 122.36 1.99 120.56 129.91 4 30.59
2008 26 0.980 0.0164 26.53 0.86 26.06 30.90 3 8.84
13 2007 – – – – – – – 0
Figure 2. Regional prediction of occurrence probabilities for Rio Grande wild turkeys relative to
2008 54 1.000 – 54.00 – – – 4 13.50
roosting habitats across the coastal sand plains region of Texas.
14 2007 – – – – – – – 0
2008 66 0.997 0.0024 66.21 0.05 66.01 69.00 3 22.07
Table 4. Mean observer detection probability of Rio Grande
Discussion wild turkeys during independent double-observer roost count
Based on our aerial survey data, Rio Grande wild turkeys exhib- surveys in the Texas coastal sand plain, 2007–2008.
ited a predictable occurrence relative to availability of roosting hab- Detection
Observer n of Counts Probability SE
itats within our study site in the coastal sand plains of south Texas,
1 28 0.904 0.006
so these data can appropriately be used to better inform sampling 2 14 0.875 0.009
structures for monitoring wild turkey populations (Thompson et 3 8 0.799 0.021
al. 1998, Morrison et al. 2008). Because Rio Grande wild turkeys 4 9 0.938 0.011
5 2 0.981 0.006
were closely tied to the distribution of roosting habitats, strati-
6 7 0.906` 0.013
fied random sampling that emphasizes potential roost sites (i.e., 7 2 0.952 0.047
oak mottes) would greatly reduce the spatial area to be surveyed.
For example, the total area of the south Texas coastal plains evalu-
ated during this study was ~750,000 ha (Figure 2). If we focused reducing the required survey area by >95% (to 40,000 ha), thus
survey efforts on areas within1 km of a potential roost sites (i.e., ensuring substantive reductions in survey cost (Butler et al. 2007).
oak mottes) during morning hours when turkeys were near the This reduction in survey area is likely to hold for Rio Grande wild
roosts, we would reduce the area surveyed by 80%, leaving only turkeys in other semiarid regions, because riparian corridors ac-
150,000 ha to be surveyed. Moreover, based on the predictions of count for nearly all roosting cover used during the winter in these
our distribution models, we could preferentially survey areas with physiographic regions (Crockett 1973, Haucke 1975, Erxleben et
≥0.50 probability of occurrence (Figure 2) during winter months, al. 2010).
2011 Proc. Annu. Conf. SEAFWARoost Distribution and Abundance Caveny et al. 49
Our multiple-observer roost surveys determined that few Rio A&M University System provided funding for our research. We
Grande wild turkeys were missed on our south Texas study area gratefully thank landowners and managers for allowing us prop-
(detection rates 0.79–0.98). When we considered the observation- erty access for roost surveys. We greatly appreciate assistance from
al data collected by both observers, detection probabilities for Rio J. Z. Dreibelbis, J. D. Guthrie, K. B. Melton, C. Phillips, and K. W.
Grande wild turkeys during roost surveys was >0.90. In one case Calhoun. Special thanks go to D. Smith, D. Krueger, D. Kahl, and
an observer had a restricted view of the survey area, but overall C. Crow for their work on this project.
our results indicate that detection rates of turkeys was high during
roost surveys. Thus, repeated multiple-observer roost count data, Literature Cited
even when uncorrected for detection probability, would likely rep- Beasom, S. L. 1970. Turkey productivity in two vegetative communities in
south Texas. Journal of Wildlife Management 34:166–175.
resent an accurate estimate of the number of turkeys using that Butler, M. J., W. B. Ballard, M. C. Wallace, S. J. DeMaso, and R. D. Applegate.
roost (Johnson 2008). Because roost counts are efficient for survey- 2006. Comparing techniques for counting Rio Grande wild turkeys at
ing Rio Grande wild turkeys (Cook 1973, Butler et al. 2006, 2007), winger roosts. Managing Wildlife in the Southwest 2006:112–117.
and detection probabilities are high for roost surveys, adequately ———, ———, ———, ———, and B. K. McGee. 2007. Aerial surveys for
estimating wild turkey abundance in the Texas Rolling plains. Journal of
trained private land managers could provide high quality multiple- Wildlife Management 71:1639–1645.
observer roost count data (Locke et al. 2011). Moreover, because Chamberlain, M. J., B. D. Leopold, and L. W. Burger. 2000. Characteristics of
Rio Grande wild turkeys exhibit consistent seasonal aggregations roost sites of adult wild turkey females. Journal of Wildlife Management
64:1025–1032.
at historic roost sites during the fall and winter, these aggregations
Cook, R. L. 1973. A census technique for the Rio Grande turkey. Pages 279–
represent the optimal time for conducting surveys (Cook 1973; 283 in G. C. Sanderson and H. C. Schultz, editors. Wild turkey manage-
Butler et al. 2006). As our results indicate that detection rates for ment: current problems and programs. University of Missouri Press, Co-
roost abundance surveys are high, survey data collected by citizen lumbia.
Cook, R. D. and J. O. Jacobson. 1979. A design for estimating visibility in aer-
scientists should result in information on roost occupancy, fidel- ial surveys. Biometrics 35:735–742.
ity, and abundance which, when collected under an appropriate Crockett, B. C. 1973. Quantitative evaluation of winter roost sites of the Rio
sampling design can be used to monitor local and regional trends Grande turkey in north-central Oklahoma. Pages 211–218 in G. C. Sand-
in Rio Grande wild turkey populations in Texas (Locke et al. 2011). erson and H. C. Schultz, editors. Wild turkey management: current prob-
lems and programs. University of Missouri Press, Columbia.
Monitoring wildlife populations is essential to management; Diamond, D. D., D. H. Riskind, and S. L. Orzell. 1987. A framework for plant
thus, application of techniques that are inexpensive yet provide community classification and conservation in Texas. Texas Journal of Sci-
precise and unbiased data are required by regulatory agencies ence 39:201–221.
Erxleben, D. R., M. J. Butler, W. B. Ballard, M. C. Wallace, J. B. Hardin, and
and private land owners. Because the majority of Texas (>95%) is
S. J. DeMaso. 2010. Encounter rates from road-based surveys of Rio Grande
privately owned, aerial surveys provide a viable methodology for wild turkeys in Texas. Journal of Wildlife Management 74:1134–1140.
estimating the distribution of Rio Grande wild turkeys over large Glazener, W. C. 1967. Management of the Rio Grande wild turkey. Pages 453–
spatial areas. Although species distribution typically does not need 493 in O. H. Hewitt, editor. The wild turkey and its management. The
Wildlife Society, Washington, D.C.
to be determined annually (Thompson et al.1998), the frequency Gore, H. G. 1969. Exploitation and restoration of turkey in Texas. Proceedings
of distribution surveys required depends upon the magnitude of of the Annual Conference of the Southeastern Association of Game and
change that regulatory agency personnel wish to detect (Butler et Fish Commissioners 23:37–45.
al. 2006, 2007). Further research should delineate this relationship Guthrie, J. D., M. E. Byrne, J. B. Hardin, C. O. Kochanny, K. L. Skow, R. T.
Snelgrove, M. J. Butler, M. J. Peterson, M. J. Chamberlain, and B. A. Col-
for Rio Grande wild turkeys in the Texas coaster sand plain. Re- lier. 2011. Evaluation of a global positioning system backpack transmitter
gardless, distributional surveys conducted at the physiographic re- for wild turkey research. Journal of Wildlife Management 75:539–547.
gion scale combined with abundance monitoring using multiple- Haucke, H. H. 1975. Winter roost characteristics of the Rio Grande wild tur-
key in South Texas. Proceedings of the National Wild Turkey Symposium
observer roost counts on a random sample of private lands within
3:164–169.
the region should provide a framework for long-term monitoring Hines, J. E. 2000. A double-observer approach for estimating detection prob-
of Rio Grande wild turkeys in Texas and other semiarid regions of ability and abundance from avian point counts as described in Nichols
the United States. et al. (2000). USGS-PWRC. http://www.mbr-pwrc.usgs.gov/software.html.
Johnson, D. H. 2008. In defense of indices: the case of bird surveys. Journal of
Wildlife Management 72:857–868.
Acknowledgments Laake, J. L. and E. Rexstad. 2009. RMark. R package version 1.9.5. http://www
The Texas Parks and Wildlife Upland Game Bird Stamp Fund, .phidot.org/software/mark/rmark/
the Texas State Chapter of the National Wild Turkey Federation, Lehmann, V. W. 1969. Forgotten legions: sheep in the Rio Grande Plain of
Texas. Texas Western Press, El Paso.
and the Institute of Renewable Natural Resources, and the Texas Litton, G. W. and F. Harwell. 1995. Rio Grande turkey habitat management.
2011 Proc. Annu. Conf. SEAFWARoost Distribution and Abundance Caveny et al. 50
Publication W7100-263. Texas Parks and Wildlife Department, Austin. Scifres, C. J. 1980. Brush management: principles and practices for Texas and
Locke, S. L., J. C. Cathey, B. A. Collier, and J. B. Hardin. 2011. Guide to abun- the southwest. Texas A&M University Press, College Station.
dance estimation techniques for Rio Grande wild turkeys. Texas AgriLife Texas Game, Fish, and Oyster Commission. 1929. Review of Texas wildlife
Extension Service Publication, College Station. and conservation. Texas Game, Fish, and Oyster Commission, Austin.
Morrison, M. L., M. D. Strickland, W. M. Block, B. A. Collier, and M. J. Peter- ———. 1945. Principal game birds and mammals of Texas. Texas Game, Fish,
son. 2008. Wildlife Study Design. Springer-Verlag, New York, New York. and Oyster Commission, Austin.
Nichols, J. D., J. E. Hines, J. R. Sauer, F. W. Fallon, J. E. Fallon, and P. J. He- Thomas, J. W., C. V. Hoozer, and R. G. Marburger. 1966. Wintering concentra-
glund. 2000. A double-observer approach for estimating detection prob- tions and seasonal shifts in range in the Rio Grande wild turkey. Journal
ability and abundance from point counts. Auk 117:393–408. of Wildlife Management 30:34–49.
Pollock, K. H., J. D. Nichols, T. R. Simons, G. L. Farnsworth, L. L. Bailey, and Thompson, W. L., G. C. White, and C. Gowan. 1998. Monitoring vertebrate
J. R. Sauer. 2002. Large scale wildlife monitoring studies: statistical meth- populations. Academic Press, San Diego, California.
ods for design and analysis. Environmetrics 13:105–119. White, G. C. and K. P. Burnham. 1999. Program MARK: survival estima-
R Development Core Team. 2011. R: A language and environment for statisti- tion from populations of marked animals. Bird Study 46 (Supplement):
cal computing. R Foundation for Statistical Computing, Vienna, Austria. 120–139.
2011 Proc. Annu. Conf. SEAFWAYou can also read