SCIENCE BRIEF - Watershare
←
→
Page content transcription
If your browser does not render page correctly, please read the page content below
SCIENCE BRIEF
July 2021 - SCIENCE BRIEF NO. 6
The WRC operates in terms of the Water Research Act (Act 34 of 1971)
and its mandate is to support water research and development as well
as the building of a sustainable water research capacity in South Africa.
SA ESS
A longitudinal view and trends on the detection and sequencing
of SARS-CoV-2 at sentinel wastewater treatment sites by the
South African Collaborative COVID-19 Environmental Surveillance
System (SACCESS) network, 2020-2021
Authors: Kerrigan McCarthy1,2, Said Rachida1, Mukhlid Yousif1,3, Nkosenhle Ndlovu1, Wayne Howard1, Shelina Moonsamy1, Gina
Pocock4, Leanne Coetzee4, Janet Mans5, Lisa Schaefer6, Wouter J. le Roux6, Annancietar Gomba7, Don Jambo7, David Moriah de
Villiers8, Nadine Lee Lepart8, Rabia Johnson9, Christo Muller9,10,11, Natacha Berkowitz12, Jay Bhagwan13, Melinda Suchard1,14 for the
SACCESS network.
1
Centre for Vaccines and Immunology, National Institute for Communicable Diseases, a division of the National Health
Laboratory Service; 2School of Public Health, University of the Witwatersrand; 3Department of Virology, School of Pathology,
Faculty of Health Sciences, University of the Witwatersrand; 4 Waterlab; 5 University of Pretoria 6 Water Centre, Council for
Scientific and Industrial Research; 7 National Institute for Occupational Health, a division of the National Health Laboratory
Service; 8 Lumegen Laboratories; 9 Biomedical Research and Innovation Platform (BRIP), South African Medical Research Council;
10
Division of Medical Physiology, Faculty of Health Sciences, Stellenbosch University; 11 Department of Biochemistry and
Microbiology, University of Zululand; 12 City of Cape Town Health Department;13 Water Research Commission; 14Department of
Chemical Pathology, School of Pathology, University of the Witwatersrand.
Since the inception of the wastewater-based epidemiology (WBE) Surveillance Programme for SARS-COV-2 in March 2020,
seven laboratories tested 513 specimens from 38 wastewater treatment plants across 9 provinces, covering sentinel sites
where 760 731/1 973 972 (38,5%) of laboratory-confirmed COVID-19 cases were reported.
The geospatially allocated line list of laboratory-confirmed clinical cases from commencement of the South African
pandemic (4 March 2020) until the end of week 25 (26 June 2021) yielded 1 973 972 cases. Among these, 760 731 (38,5%)
were located in a metropolitan area or local municipality where wastewater-based surveillance for SARS-CoV-2 was being
conducted at the time.
SARS-CoV-2 was detected in 350 (68%) samples tested.
Detection of SARS-CoV-2 was more frequent during clinical ‘waves’ reported.
Viral load in wastewater tended to increase during the third wave in parallel with increasing clinical cases.
Detection of SARS-CoV-2 with quantitation of viral loads from wastewater may be a helpful additional data source to
support population level monitoring of SARS-CoV-2 epidemiology.
Results from sentinel sites across South African urban areas indicated correspondence at some sites with increased numbers
of clinical cases in Gauteng, KwaZulu-Natal, Free State and Northern Cape provinces and support the further exploration of
these data to monitor SARS-CoV-2 epidemiology using wastewater-based testing.
The results to date and the trends have demonstrated the significance and cost efficiency of WBE in complementing the
management of the pandemic offering early warning and identifying hotspots.
PAGE 1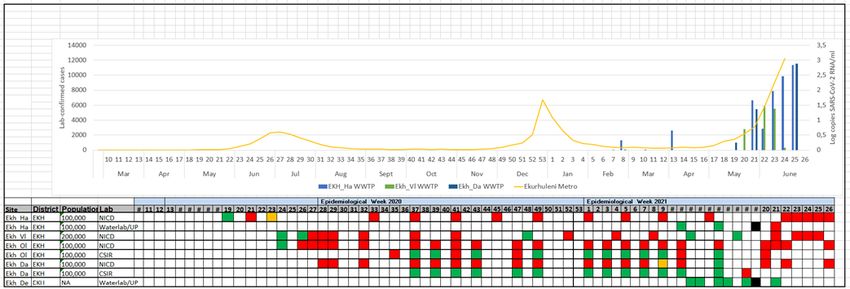
in wastewater commenced in early 2020. In November
                      Background                                    2020, a network of testing laboratories which became
                                                                    known as the South African Collaborative COVID-19
Globally, detection and monitoring of SARS-CoV-2                    Environmental Surveillance System (SACCESS) network, was
epidemiology through wastewater was proposed as                     established in order to support development of common
early as April 20201,2. First reports describing the feasibility    testing methodology, identify and address challenges,
and practical usefulness of this approach emerged                   and share best practices related to qualitative, quantitative
simultaneously from a number of countries around August             and RNA sequencing of SARS-CoV-2 in wastewater. In
20203,4. Recent evidence has shown that SARS-CoV-2 can              South Africa, treatment of wastewater is the responsibility
be detected in wastewater prior to the appearance of                of local government. Approximately 1 050 wastewater
clinical cases5. Longitudinal tracking of SARS-CoV-2 viral          treatment works (WWTPs) are administered by metropolitan
load in wastewater is shown to correlate with the burden of         councils and local government and treat both industrial
clinically diagnosed cases6. Sequencing of SARS-CoV-2 RNA           and domestic waste. SACCESS partners and the NICD
fragments in wastewater has identified variants of concern          have engaged with local government to support sample
as well as mutations not detected in clinical cases7.               collection, interpretation and utilisation of the results for
                                                                    public health purposes.
Wastewater-based epidemiology (WBE) is emerging as a
useful modality to monitor SARS-CoV-2 epidemiology and              As at the beginning of July 2021, South Africa has
support public health decision-making regarding COVID-              experienced two ‘waves’ of COVID-19, and is experiencing
19 response activities. Based on the global developments            a third ‘wave’. The initial rise in case numbers began in the
in the field and the opportunity WBE offers in terms of an          Northern Cape and Free State provinces in March and early
early warning and hotspot indicator of the viral infections         April of 2021. As of 6 July 2021, the rise in cases meets the
in communities, several south African institutions, such            criteria for a ‘third wave’ in all provinces. Presently, the case
the Water Research Commission (WRC), National Institute             incidence rate in Gauteng Province is currently highest at
for Communicable Diseases (NICD), South African Medical             45/100 000, with over 34% of daily tests reportedly positive.
Research Council (MRC), University of Pretoria, Durban
University of Technology (DUT) and private laboratories             We aimed to identify epidemiological trends of SARS-CoV-2
launched programmes in support of WBE surveillance of               in South African urban wastewater treatment plants and
the SARS-CoV2 virus. A further outcome was the formation            compared PCR detection and quantitation results from
of the South African Collaborative COVID-19 Environmental           influent sewage with trends in clinical epidemiology. We
Surveillance System (SACCESS) network of laboratories, to           also describe the establishment of the SACCESS network
report results of sentinel surveillance in urban centres and
metros using PCR-based detection and quantitation of SARS-
CoV-2 virus in wastewater samples, alongside corresponding
                                                                                             Methods
district or metro epidemic curves. NICD was nominated to
                                                                    Outbreak context and clinical case epidemiology
play the coordinating role and with funding the support
from the WRC the National Surveillance programme is
                                                                    Since the first case of SARS-CoV-2 was detected on 3 March
incrementally being scaled.
                                                                    2020, South African laboratories have conducted over 13
                                                                    million RT-PCR and antigen tests. Just over 2 million cases
Detection of SARS-CoV-2 with quantitation of viral load
                                                                    and 61 000 deaths have been recorded in South Africa as of
from wastewater can be a helpful additional data source
                                                                    6 July 2021. Three distinct ‘waves’ of SARS-CoV-2 infection
to support population level monitoring of SARS-CoV-2
                                                                    occurred, with the first two peaking in June and December
epidemiology. Additional geospatial and epidemiological
                                                                    2020 respectively, whilst the third is still unfolding as of 6
investigations should be done to support the use-cases of
                                                                    July 2021. The de-duplicated and geospatially allocated
wastewater-based epidemiology for COVID-19.
                                                                    national linelist of laboratory-confirmed cases of SARS-CoV-2
                                                                    (identified by RT-PCR or antigen test) were provided by the
In South Africa, SARS-CoV-2 epidemiology is monitored
                                                                    NICD for comparison with results from SARS-CoV-2 testing of
through laboratory testing of clinical cases (by reverse-
                                                                    wastewater.
transcriptase polymerase chain reaction (RT-PCR) tests and
rapid antigen tests), COVID-19 related hospital admissions
                                                                    Establishment of the laboratory testing network
and COVID-19–related deaths. Laboratory testing data is
relayed by testing laboratories to the National Institute
                                                                    Commencing in 2018, the NICD had been conducting
for Communicable Diseases (NICD). Hospital admissions
                                                                    testing of wastewater for poliovirus as part of the National
and death data is submitted by the DATCOV system to the
                                                                    Department of Health’s polio surveillance programme.
NICD. From these data sources, epidemiological indicators
                                                                    In 2020, the NICD, SAMRC, the Council for Scientific and
including incidence rates of testing and case detection,
                                                                    Industrial Research, the University of Pretoria, the Institute for
hospitalisation and death rates are made available to key
                                                                    Water and Wastewater Technology at the Durban University
stakeholders and the general public.
                                                                    of Technology, the National Institute for Occupational Health
                                                                    and a number of private laboratories (Waterlab, Greenhill
A number of independent initiatives to test for SARS-CoV-2
                                                                    and Lumegen Laboratories) commenced with independent

                                                               PAGE
                                                                PAGE22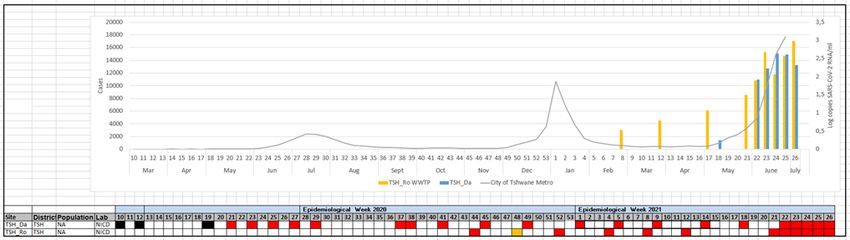
projects involving qualitative and quantitative detection              SARS-CoV-2 detection and quantitation methodology
of SARS-CoV-2 in local WWTPs. A proof of concept was
published by the SAMRC in 20218.                                       At identified wastewater treatment facilities, one litre grab
                                                                       samples of influent were collected and transported at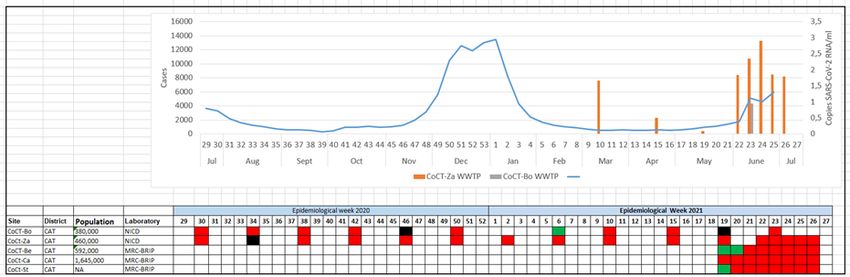
Name of Laboratory       Method for virus                     Method for nucleic acid           RT-PCR assay
 partner                  concentration                        extraction
 Waterlab/UP              Skim milk flocculation               QIAamp® Ultrasens® Virus kit      Allplex™ 2019-nCoV Assay
 SAMRC-TB                 Ultra centrifugation                 ZymoBIOMICS kit                   2019-nCoV CDC EUA Kit
 SAMRC-BRIP               Centrifugation                       RNeasy PowerSoil                  2019-nCoV CDC EUA Kit
 Lumegen                  Tangential Flow Filtration           Qiagen extraction Kit             Thermofisher (TaqPath kit)

                        Results                                     In Gauteng province (Figure 1A-C) all samples were negative
                                                                    up until week 21 of 2020, (commencing 17 May 2020), when
Overview of wastewater and clinical SARS-CoV-2 test results         samples from two plants (Ekurhuleni and City of Tshwane)
                                                                    tested positive, coinciding with the onset of the first wave.
In 2020, WWTW from 19 sites across five provinces                   All sites continued to test positive through the inter-wave
submitted samples for testing including nine in Gauteng,            period (August-December 2020) and through the second
two in the City of Cape Town, Western Cape Province, two in         wave (ending week 7, February 2021). A number of sites
Mangaung, Free State Province, two in eThekwini (KwaZulu-           in City of Tshwane, Johannesburg and Ekurhuleni tested
Natal Province) and four in Eastern Cape Province (two in           negative during weeks 11-16 (mid-March until end April
Buffalo City Metro and two in Nelson Mandela Metro).                2021). Since week 17 (mid-April) all nine WWTP across
                                                                    Gauteng that submitted samples have tested positive,
In 2021, additional sites in Gauteng (seven sites), Limpopo         signifying an increase in population burden of disease across
(two sites), Mpumalanga (three sites), North West (three            the province. Quantitative results from two plants in City of
sites), the Northern Cape (one site) and Western Cape (three        Johannesburg, a single plant in City of Tshwane and three
sites) provinces were added, to bring the total to 38 sites.        plants in Ekurhuleni were first tested in week 16 (end April
Two sites in Gauteng were duplicated, being tested by the           2021) and show consistently increasing concentrations of
NICD and another laboratory.                                        SARS-CoV-2 in log RNA copies/ml of influent wastewater,
                                                                    consistent with observed increases in reported cases in
The de-duplicated and geospatially allocated line list of           these districts.
laboratory-confirmed clinical cases from commencement of
the South African pandemic (4 March 2020) until the end of          In the Western Cape Province (Figure 2) samples from the
week 25 (26 June 2021) yielded 1 973 972 cases. Amongst             two WWTP have consistently tested positive. However,
these, 760 731 (38,5%) were located in a metropolitan area          quantitative results in wastewater have shown an increase
or local municipality where wastewater-based surveillance           in viral copies per millilitre in June, in parallel with the
for SARS-CoV-2 was being conducted at the time (15 940              increasing numbers of clinical cases.
in Buffalo City; 36 370 in Nelson Mandela Metro Bay; 30 133
in Mangaung, Free State; 135 701 in City of Johannesburg;           In the Eastern Cape Province (Figure 3), sample results are
110 148 in City of Tshwane; 75 934 in Ekurhuleni; 29 825            available from week 38 of 2020 (mid-September 2020),
in West Rand; 81 931 in eThekwini, 6 496 in Capricorn               and all tested positive until week 6 and/or week 10 of 2021
District Municipality (DM); 7 514 in Emalahleni DM, 5 166 in        (March-April 2021), coinciding with the end of the second
Mbombela DM; 4 762 in Matlosana DM, 2 931 in JB Marks               wave. Quantitative results from plants in Buffalo city have
Local Municipality (LM); 10 047 in Rustenburg LM; 7 533 in          increased but a recent sample from week 26 has a lower viral
Sol Plaatje LM, 200 310 in City of Cape Town Metro).                load. In Nelson Mandela Metro, samples from week 24 show
                                                                    high viral load, in keeping with climbing clinical cases. A
Provincial trends                                                   single positive sample with a high viral load was detected in
                                                                    week 15 and is of uncertain significance as few clinical cases
Over 2020, and 2021 to date, 142 and 371 wastewater                 were detected that week.
samples were submitted from 18 and 38 WWTW respectively
and were tested by or reported to the NICD by partner               In Free State province (Figure 4) testing commenced in week
laboratories. Of these 383 samples, SARS-CoV-2 was                  31 of 2020. SARS-CoV-2 RNA has been detected at both sites
identified in 105 samples in 2020 (74%) and 245 in 2021             continuously since then, in keeping with the high clinical
(66%), with each site submitting an average of 13.5 samples         case load (greater than 200 cases per week). Quantitative
over the two years sampling period (range 2-21). In 2020            results from week 17 have been consistently elevated, but
and 2021 respectively, 24 (17%) and 45 (12%) of samples             one plant appears to have a decreasing viral load in weeks
had invalid results. Of samples tested in 2021, 88 of 245           26 and 27.
(36%) positive samples had quantitative tests conducted.
The SARS-CoV-2 N-gene was found in 85/88. Detection and             All samples from KwaZulu-Natal Province (Figure 5)
quantitation results are displayed in Figures 1-6 together          (from week 36, 2020 to date) have tested positive since
with epidemiologic curves for clinical cases detected               commencement of testing in week 36 of 2020. Viral
2020-2021 for the districts or metros where each WWTW is            quantification has shown consistent increases from week 19
located.                                                            (mid May 2021) onwards, signifying an increase in cases.

                                                           PAGE 4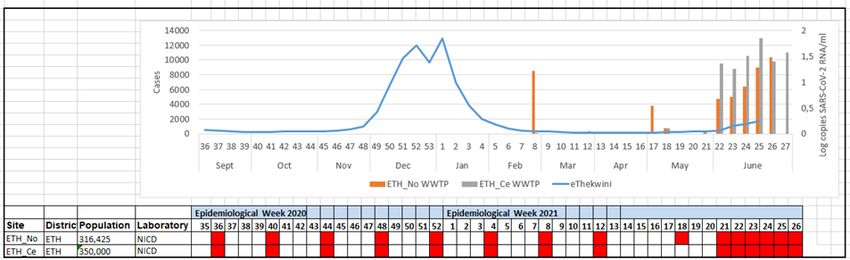
In Limpopo (Figure 6A), testing commenced in week 7 of               significance of these fluctuations is presently unclear.
2021 (February 2021) and all samples have tested negative
until week 15 (mid-April) at a single plant, and week 19 in          Presently, our results are helpful to retrospectively confirm
a second plant, in keeping with an increase in case load. In         the presence of SARS-CoV-2 in wastewater and hence in
Mpumalanga (Figure 6B), testing commenced in week 6                  metros of South Africa. However, our data challenge the
(February 2021). Positive results were reported consistently         network partners to exploit and build on the opportunity
from week 14 (early April 2021), in keeping with an increase         provided by this network to supply meaningful and timely
in local cases. In North West Province (Figure 6C) samples           data to public health decision makers at provincial and
from week 19 (mid May 2021) have consistently tested                 national level as has been done elsewhere6. These data
positive. In Kimberley in the Northern Cape Province                 include temporal and geographical changes in qualitative
(Figure 6D), positive samples were detected from week 13             and quantitative detection patterns within metros by
(early April) until week 22 (early June), with the most recent       determining population sizes and caseloads within sewage
sample (week 24, late June) having tested negative, possibly         drainage areas, mapping of sewage reticulation networks
matching the decline in clinical cases.                              by metropolitan officials with nodal sampling and testing of
                                                                     wastewater to identify localised areas of high SARS-CoV-2
                      Discussion                                     prevalence. These data may guide the implementation of
                                                                     public health measures to curb transmission and contain
In this description of results from detection of SARS-CoV-2          the economic and social impact of SARS-CoV-2. Work has
from wastewater at South African sentinel sites, we have             been done globally attempting to calculate population
demonstrated some concordance of qualitative and                     burdens of disease from quantitative PCR results10. This
quantitative results with clinical epidemiologic curves. We          requires knowledge of duration and quantity of SARS-
have demonstrated the potential of the network to provide            CoV-2 shedding from infected persons as well as the rate
descriptive epidemiological data pertaining to geographic            of decay of RNA in wastewater. With frequent sampling,
variation and burden of disease.                                     it is possible to determine the effective reproductive rate
                                                                     of SARS-CoV-2 using wastewater based epidemiology11.
Clinical epidemiology based on reporting of laboratory-              Genomic sequencing of SARS-CoV-2 viral fragments in
confirmed cases of SARS-CoV-2 has limitations. Household             wastewater also has potential to monitor population trends
transmission studies in South African urban and rural                in circulation of variants7. Trends in quantitation of viral RNA
settings have demonstrated that a large proportion of cases          may also allow inferences to be made regarding the success
are asymptomatic, and a high proportion of cases so mild as          of vaccine roll-out. Lastly, the network may prove useful to
not to elicit health seeking and that laboratory-confirmed           provide surveillance data for other waterborne or excreted
cases likely represent less than 10% of SARS-CoV-2 cases             communicable diseases including agents of gastroenteritis,
prevalent in a community at any given time point (personal           hepatitis and other respiratory illness such as influenza12 and
communication, PHIRST study, Cheryl Cohen, NICD).                    for monitoring of antimicrobial resistance13.
Secondly, there is increasing use of rapid antigen detection
tests in clinical settings. Results of these tests may not be        Limitations of wastewater-based epidemiology include
reported to surveillance networks. Consequently, laboratory-         restriction of the surveillance methodology to urban
diagnosis is increasingly less representative of the burden of       populations with functional sewage reticulation networks,
disease.                                                             inability to measure disease amongst non-sewered
                                                                     populations (e.g., in informal settlements or rural areas) and
Detection results from our network reflect that SARS-CoV-2 is        reliance on repeated measurements from the same plant
reliably present in wastewater during ‘waves’, and during the        tested with identical methodology to demonstrate temporal
third wave, quantitation results have reflected the current          trends. Further exploration of the relationship between
upward trend observed amongst clinical cases. However                quantitative SARS-CoV-2 results, local trends in clinical case
certain anomalies in our results require careful attention.          burden, environmental factors and test methodology will
Whilst SARS-CoV-2 cases were present in all metros and               support interpretation of observed fluctuations in RNA
areas under surveillance during the inter-wave period,               levels. The use-case scenarios SARS-CoV-2 wastewater-based
continued positive results even during times of apparent             epidemiology to support public health interventions at
low population burden may signify high sensitivity of                local, provincial and national level in South Africa need to be
detection mechanisms, higher than reported numbers of                established.
cases in sewage drainage areas or, less likely, false positive
laboratory test results. A single high concentration of SARS-        In conclusion, our detection results from sentinel sites
CoV-2 was detected in Nelson Mandela Metro Bay in week               across South African urban areas indicating correspondence
15, when only 60 clinical cases were reported. We consider           at some sites with increased numbers of clinical cases in
an error in the quantitative PCR result unlikely, therefore          Gauteng, KwaZulu-Natal, Free State and Northern Cape
this result may reflect a localised transmission event which         provinces support the further exploration of the use of
went undetected or high numbers of asymptomatic cases.               these data to monitor SARS-CoV-2 epidemiology using
In recent weeks (22-27, June-early July 2021) although               wastewate- based testing.
the general trend of SARS-CoV-2 concentration is upward,
fluctuations of quantitation results have been observed. The

                                                                 PAGE 5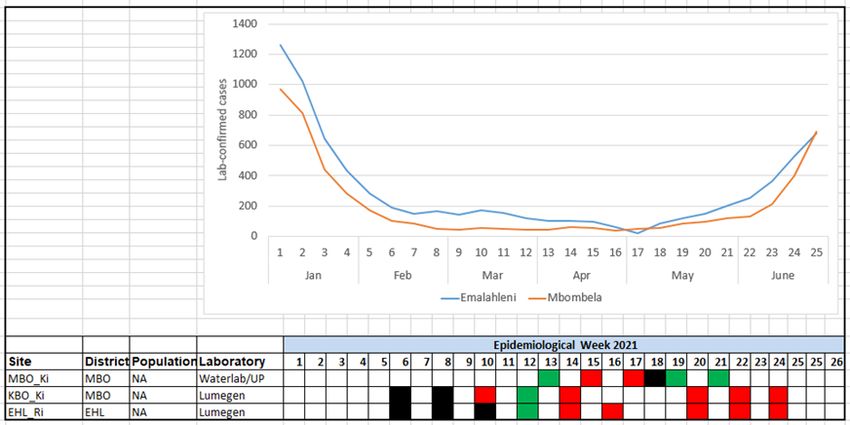
Acknowledgements                                       140621.
                                                               4.    La Rosa G, Iaconelli M, Mancini P, et al. First detection of
This WRC brief is adapted from an article published in               SARS-CoV-2 in untreated wastewaters in Italy. Sci Total
the NICD Bulletin – Volume 19, 20 July 2021.                         Environ 2020; 736: 139652.
                                                               5.    Randazzo W, Truchado P, Cuevas-Ferrando E, Simón P,
The contributions of local government and wastewater                 Allende A, Sánchez G. SARS-CoV-2 RNA in wastewater
treatment staff to sample collection and transport is                anticipated COVID-19 occurrence in a low prevalence
acknowledged and appreciated. The Water Research                     area. Water research 2020; 181: 115942.
Commission is thanked for their vision and support. The        6.    Wurtzer S, Marechal V, Mouchel JM, et al. Evaluation of
NICD SARS-CoV-2 epidemiology and IT team members are                 lockdown effect on SARS-CoV-2 dynamics through viral
thanked for sharing district and sub-district case burdens           genome quantification in waste water, Greater Paris,
in order to generate graphs. These team members include              France, 5 March to 23 April 2020. Euro Surveill 2020;
Andronica Moipone Shonhiwa, Genevie Ntshoe, Joy Ebonwu,              25(50).
Lactatia Motsuku, Liliwe Shuping, Mazvita Muchengeti,          7.    Izquierdo-Lara R, Elsinga G, Heijnen L, et al. Monitoring
Jackie Kleynhans, Gillian Hunt, Victor Odhiambo Olago,               SARS-CoV-2 Circulation and Diversity through
Husna Ismail, Nevashan Govender, Ann Mathews, Vivien                 Community Wastewater Sequencing, the Netherlands
Essel, Veerle Msimang, Tendesayi Kufa-Chakezha, Nkengafac            and Belgium. Emerg Infect Dis 2021; 27(5): 1405-15.
Villyen Motaze, Natalie Mayet, Tebogo Mmaborwa                 8.    Johnson R, Muller CJF, Ghoor S, et al. Qualitative and
Matjokotja, Mzimasi Neti, Tracy Arendse, Teresa Lamola,              quantitative detection of SARS-CoV-2 RNA in untreated
Itumeleng Matiea, Darren Muganhiri, Babongile Ndlovu,                wastewater in Western Cape Province, South Africa. S
Khuliso Ravhuhali, Emelda Ramutshila, Salaminah Mhlanga,             Afr Med J 2021; 111(3): 198-202.
Akhona Mzoneli, Nimesh Naran, Trisha Whitbread, Mpho           9.    Commission WR. A compendium of emerging South
Moeti, Chidozie Iwu, Eva Mathatha, Fhatuwani Gavhi,                  African testing methodologies for detecting of SARS-
Masingita Makamu, Matimba Makhubele, Simbulele                       CoV-2 RNA in wastewater surveillance. Pretoria: Water
Mdleleni, Tsumbedzo Mukange, Trevor Bell, Lincoln Darwin,            Research Commission, 2020.
Fazil McKenna, Ndivhuwo Munava, Muzammil Raza Bano,            10.   Bhattacharya P, Kumar M, Islam MT, et al. Prevalence
Themba Ngobeni                                                       of SARS-CoV-2 in Communities Through Wastewater
                                                                     Surveillance-a Potential Approach for Estimation of
                                                                     Disease Burden. Current pollution reports 2021: 1-7.
                     References                                11.   Huisman JS, Scire J, Caduff L, et al. Wastewater-based
                                                                     estimation of the effective reproductive number of
1.   Murakami M, Hata A, Honda R, Watanabe T. Letter to the
                                                                     SARS-CoV-2. medRxiv 2021: 2021.04.29.21255961.
     Editor: Wastewater-Based Epidemiology Can Overcome
                                                               12.   Hellmér M, Paxéus N, Magnius L, et al. Detection of
     Representativeness and Stigma Issues Related to
                                                                     pathogenic viruses in sewage provided early warnings
     COVID-19. Environ Sci Technol 2020; 54(9): 5311.
                                                                     of hepatitis A virus and norovirus outbreaks. Appl
2.   Mallapaty S. How sewage could reveal true scale of
                                                                     Environ Microbiol 2014; 80(21): 6771-81.
     coronavirus outbreak. Nature 2020; 580(7802): 176-7.
                                                               13.   Hendriksen RS, Munk P, Njage P, et al. Global monitoring
3.   Sherchan SP, Shahin S, Ward LM, et al. First detection
                                                                     of antimicrobial resistance based on metagenomics
     of SARS-CoV-2 RNA in wastewater in North America:
                                                                     analyses of urban sewage. Nature communications
     A study in Louisiana, USA. Sci Total Environ 2020; 743:
                                                                     2019; 10(1): 1124.

                                                          PAGE 6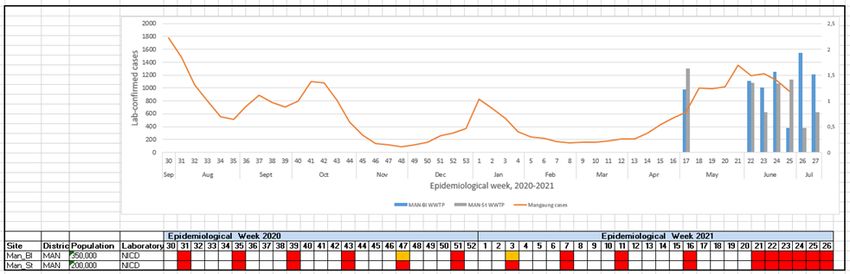
Figure 1. Epidemiological curves of laboratory-confirmed SARS-CoV-2 cases, SARS-CoV-2 viral loads in wastewater
and SARS-CoV-2 PCR detection results in wastewater by district, Gauteng Province, 2020-2021.

Districts shown in include City of Johannesburg (A), City of Tshwane (B) and Ekurhuleni Metropolitan area (C). Figure: Yellow
curve represents laboratory-confirmed COVID-19 cases (left axis) by epidemiological week 2020-2021 (horizontal axis). Blue
bars represent quantitative viral loads in copies per millilitre (right axis) in specimens collected in given epidemiological week
2020-2021 (horizontal axis). Table: Green squares represent negative PCR results, red squares represent positive results and
black squares represent invalid results. JHB=City of Johannesburg. TSH=City of Tshwane. EKH=Ekhuruleni. WWTP=wastewater
treatment plant. *Population is the approximate size of the population served by the wastewater treatment plant. Lab is the
name of the testing laboratory

Figure 2. Epidemiological curves of laboratory-confirmed SARS-CoV-2 cases, SARS-CoV-2 viral loads in wastewater
and SARS-CoV-2 PCR detection results in wastewater for the City of Cape Town, Western Cape province, 2020-2021.

Figure: Yellow curve represents laboratory-confirmed COVID-19 cases (left axis) by epidemiological week 2020-2021
(horizontal axis). Blue bars represent quantitative viral loads in copies per millilitre (right axis) in specimens collected in
given epidemiological week 2020-2021 (horizontal axis). Table: Green squares represent negative PCR results, red squares
represent positive results and black squares represent invalid results. CoCT=City of Cape Town. WWTP=wastewater treatment
plant.*Population is the approximate size of the population served by the wastewater treatment plant. *Lab is the name of the
testing laboratory

                                                              PAGE 7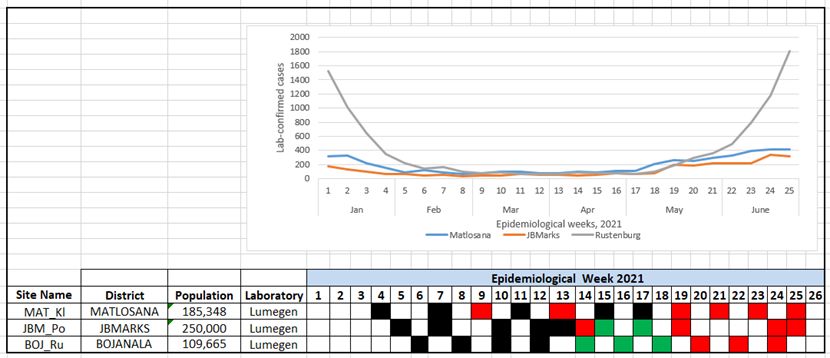
Figure 3. Epidemiological curves of laboratory-confirmed SARS-CoV-2 cases, SARS-CoV-2 viral loads in wastewater
and SARS-CoV-2 PCR detection results in wastewater for Nelson Mandela Metropolitan area (NMMB), and Buffalo City
Metropolitan area (BCM) in the Eastern Cape Province, 2020-2021.

Figure: Yellow curve represents laboratory-confirmed COVID-19 cases (left axis) by epidemiological week 2020-2021
(horizontal axis). Blue bars represent quantitative viral loads in copies per millilitre (right axis) in specimens collected in
given epidemiological week 2020-2021 (horizontal axis). Table: Green squares represent negative PCR results, red squares
represent positive results and black squares represent invalid results. NMB=Nelson Mandela Bay. BCM=Buffalo City Metro.
WWTP=wastewater treatment plant.*Population is the approximate size of the population served by the wastewater
treatment plant. *Lab is the name of the testing laboratory

Figure 4. Epidemiological curves of laboratory-confirmed SARS-CoV-2 cases, SARS-CoV-2 viral loads in wastewater
and SARS-CoV-2 PCR detection results in wastewater for Mangaung Metropolitan area in Free State Province,
2020-2021.

Figure: Yellow curve represents laboratory-confirmed COVID-19 cases (left axis) by epidemiological week 2020-2021
(horizontal axis). Blue bars represent quantitative viral loads in copies per millilitre (right axis) in specimens collected in given
epidemiological week 2020-2021 (horizontal axis). Table: Green squares represent negative PCR results, red squares represent
positive results and black squares represent invalid results. MAN=Mangaung Metro. WWTP=wastewater treatment plant.
*Population is the approximate size of the population served by the wastewater treatment plant. *Lab is the name of the
testing laboratory

                                                               PAGE 8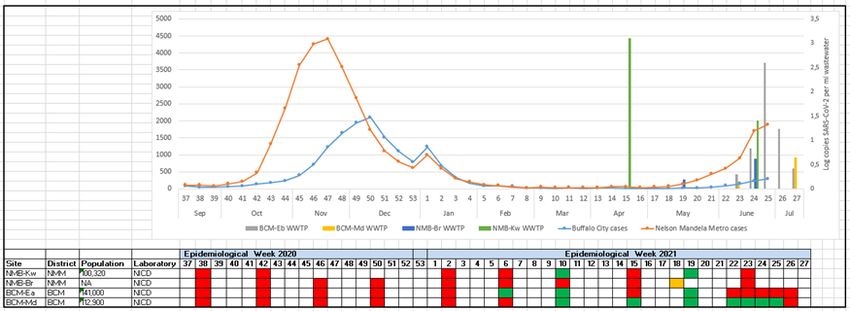
Figure 5. Epidemiological curves of laboratory-confirmed SARS-CoV-2 cases, SARS-CoV-2 viral loads in wastewater
and SARS-CoV-2 PCR detection results in wastewater for eThekwini Metropolitan area in KwaZulu-Natal Province,
2020-2021.

Figure: Yellow curve represents laboratory-confirmed COVID-19 cases (left axis) by epidemiological week 2020-2021
(horizontal axis). Blue bars represent quantitative viral loads in copies per millilitre (right axis) in specimens collected in given
epidemiological week 2020-2021 (horizontal axis). Table: Green squares represent negative PCR results, red squares represent
positive results and black squares represent invalid results. ETH=Ethekwini Metro. WWTP=wastewater treatment plant.
*Population is the approximate size of the population served by the wastewater treatment plant. *Lab is the name of the
testing laboratory

                                                                PAGE 9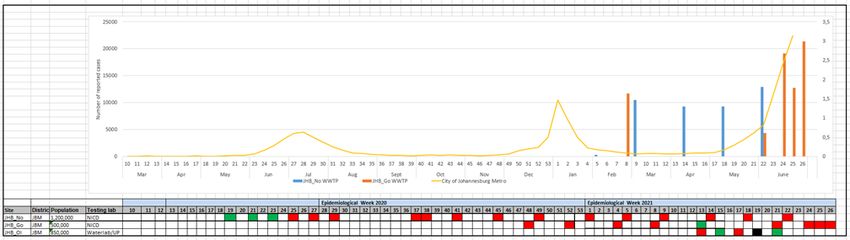
Figure 6 A-D. Epidemiological curves of laboratory-confirmed SARS-CoV-2 cases, SARS-CoV-2 viral loads in
wastewater and SARS-CoV-2 PCR detection results in wastewater for from Limpopo (A), Mpumalanga (B), North West
(C) and Northern Cape (D) provinces, 2020-2021.

Figure: Yellow curve represents laboratory-confirmed COVID-19 cases (left axis) by epidemiological week 2020-2021
(horizontal axis). Blue bars represent quantitative viral loads in copies per millilitre (right axis) in specimens collected in given
epidemiological week 2020-2021 (horizontal axis). Table: Green squares represent negative PCR results, red squares represent
positive results and black squares represent invalid results. ETH=Ethekwini Metro. WWTP=wastewater treatment plant.
*Population is the approximate size of the population served by the wastewater treatment plant. *Lab is the name of the
testing laboratory

                                                               PAGE 10
You can also read