Exploring the Impact of State and Federal Actions on Enrollment in the Individual Market: A Comparison of the Federal Marketplace and ...
←
→
Page content transcription
If your browser does not render page correctly, please read the page content below
Exploring the Impact of State and Federal Actions on
        Enrollment in the Individual Market:
     A Comparison of the Federal Marketplace
                        and
    California, Massachusetts and Washington
Exploring the Impact of State and Federal Actions on
Enrollment in the Individual Market
The sixth open-enrollment period under the Patient Protection and Affordable Care Act for plan year 2019 recently concluded. This open-
enrollment period was the first since the launch of the Affordable Care Act in which the individual coverage mandate penalty was set to zero
by federal action. The 2019 open-enrollment period also marked the third year in which the federal government continued a strategy of
dramatically reducing its support and efforts to encourage enrollment in the states served by the federally facilitated marketplace (FFM).

The analysis in this report reflects a joint effort on behalf of three state-based marketplaces (SBMs) — California, Massachusetts and
Washington — to better understand how their experiences differ from that of states served by the FFM and seeks to inform policy-makers
by conducting early analysis of their enrollment experience.

This analysis focuses on two key dimensions of the performance of the individual markets over the past five years:
• Change in premium: Premium increases are critical indicators of individual markets’ performance because of the direct relationship
  between premium increases and cost to the federal government, and more importantly, impacts on unsubsidized individuals who bear the
  full costs of these increases.
• Change in new enrollment: New enrollment (and not renewals or “total” enrollment) is the focus of this analysis because it is a better
  “leading” indicator of the impact of efforts to keep the individual market healthy and to lower costs, and because for 2019 the renewal
  figures do not reflect paid renewals, which may drop significantly with the removal of the penalty.

The analysis concludes with issues that warrant further investigation. The appendices include background information on states’ activities
and references.
                                                                                                                                               1
State Solutions to Promote Enrollment in the Individual Market

California, Massachusetts and Washington are all state-based marketplaces that have used state-specific
solutions to build health insurance exchanges that work. These strategies have included:

•   Active outreach and marketing.
•   State policies that ensure a stable and competitive individual marketplace.
•   To varying extents, playing active roles in the certification of qualified health plans (QHPs) to ensure quality
    and affordable products and having common patient-centered benefit designs and improved choice
    architecture to simplify the purchase experience and have consumers focus on price and quality.
•   Expanding their Medicaid programs through the Affordable Care Act and coordinating with state Medicaid
    agencies.

Examples of these activities and references to research on these states’ efforts are included in the appendices.

                                                                                                                       2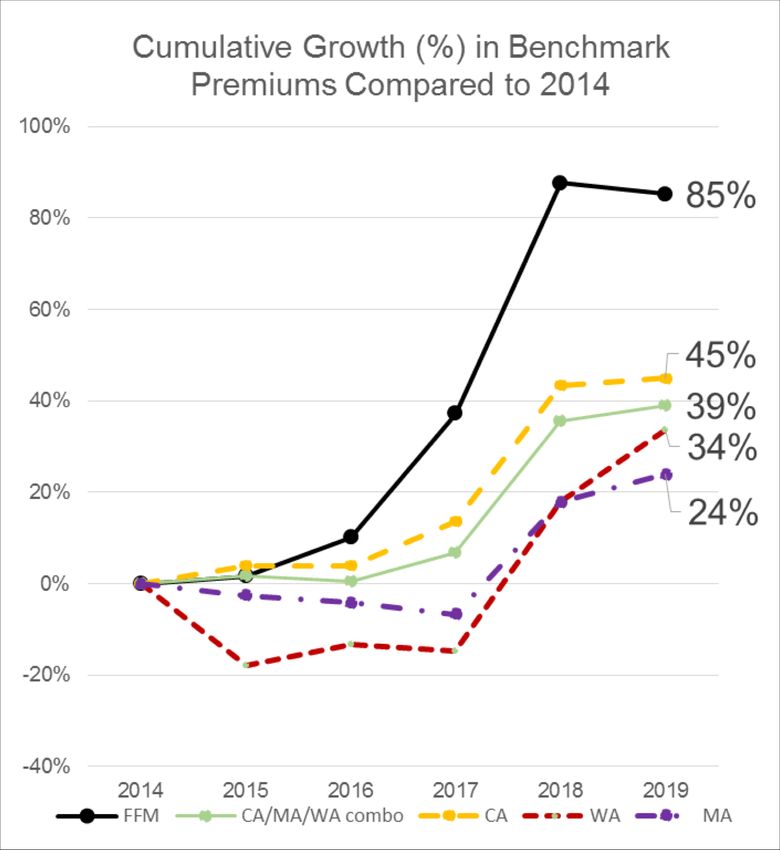
From 2014 to 2019, Premiums in the FFM Have Grown at a Much Higher
Rate Than Premiums in California, Massachusetts and Washington Have

Together, Massachusetts, Washington and
California have been very successful at restraining
growth in the average benchmark premium,
holding average annual increases to less than 7
percent since the marketplaces opened in 2014.

During the same period, FFM average benchmark
premiums have grown at an average rate of over
13 percent.

                                                      Analysis of enrollment weighted average benchmark premiums reported by Kaiser
                                                      Family Foundation (2014-19): https://www.kff.org/health-reform/state-
                                                                                                                                       3
                                                      indicator/marketplace-average-benchmark-premiums/. FFM includes SBM-FP states.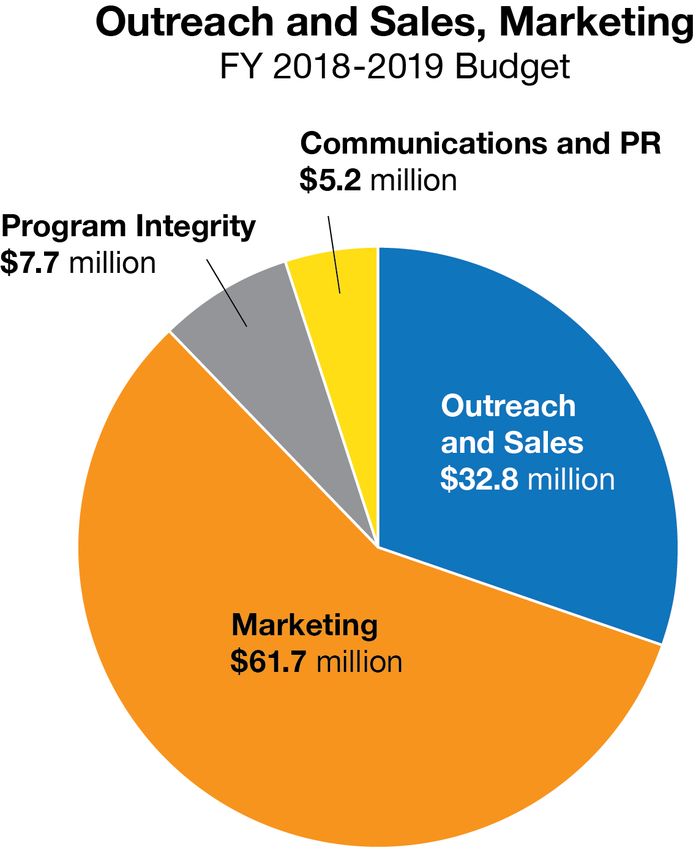
The Cumulative Premium Increase in FFM States Has Been More Than
Twice as Much as That of California, Massachusetts and Washington

As of 2019, average benchmark premiums in the FFM are now 85
percent higher than they were in 2014. The weighted average increase
of the three states was 39 percent.

Had the FFM experienced the lower growth seen in California,
Massachusetts and Washington, the estimated savings to the federal
government from lower premium payments for those receiving
Advanced Premium Tax Credits could have been as much as $14
billion in 2018, or a cumulative savings of roughly $35 billion. However,
it is likely that some federal costs would have risen with increased
enrollment.

More direct savings would have been realized by the millions of
Americans who do not receive subsidies: They would have both paid
far less in FFM states and would have been less likely to have been
priced out of coverage.
                                                                            Chart shows analysis of enrollment weighted average benchmark
                                                                            premiums reported by Kaiser Family Foundation (2014-2019):
                                                                            https://www.kff.org/health-reform/state-indicator/marketplace-average-
                                                                            benchmark-premiums/. Estimates of cost savings use benchmark             4
                                                                            premium data. FFM includes SBM-FP states.
New Sign-Ups During Open Enrollment for 2019:
Penalty and State Subsidies Appear to Drive Major Differences
                                                2016 to 2018                                                                                                                       FOR 2019

      • From 2016 to 2018, the FFM saw its level of new enrollments in open                                                         • For 2019, the 16 percent decline in the FFM was on top of a 40 percent
        enrollment drop considerably — from 4.0 million to 2.5 million, a drop of                                                     cumulative decline from 2016 to 2018.
        40 percent.                                                                                                                 • California and Washington — both states with very good risk mixes — saw their
                                                                                                                                      new sign-ups drop off significantly.
      • By contrast, California, Washington and Massachusetts had relatively                                                        • Washington saw lower enrollment, particularly among unsubsidized consumers,
        steady numbers of new sign-ups during open enrollment, from 547,000                                                           due to affordability concerns.
        to 516,000 in 2018, a drop of 6 percent.                                                                                    • Massachusetts, which still has a state mandate and adds additional state
                                                                                                                                      subsidies for enrollees, saw substantial increases in new enrollment.
Analysis of CMS/ASPE reported plan selections in public use files (https://www.cms.gov/Research-Statistics-Data-and-Systems/Statistics-Trends-and-Reports/Marketplace-Products/index.html) and using 2019 releases from CMS (https://www.cms.gov/newsroom/fact-sheets/final-   5
weekly-enrollment-snapshot-2019-enrollment-period), along with state data from CA, MA and WA. FFM includes SBM-FP states. Kentucky excluded due to shift from SBM to SBM-FP between 2016 and 2017 plan year.
Need for Additional Research: Outstanding Major Questions
These initial observations are not conclusory analysis. Many factors influence the outcomes on premiums and enrollment reviewed here,
including changes in regional market conditions for the cost of health care, labor market dynamics and other state-specific dynamics. As
discussed in the Covered California 2019 Open Enrollment Early Observations and Analysis, additional analysis is needed to better
understand why enrollment changes over time and between states. The following are some of the areas of investigation that are not within
the scope of this analysis (and most are areas for which data is not yet available):
1. Off-exchange Impacts: What has the enrollment change been in the off-exchange market, where no financial assistance is helping
consumers reduce their premiums?
2. Effectuated Enrollment: How have retention rates among renewing consumers (after payment of new year’s premium) been affected?
3. Risk Mix: Does a lower level of new enrollment translate into a worse risk mix, suggesting large premium increases are on the horizon?
4. Public Charge: What impact could the proposed shift in the federal application of the “public charge” have had on enrollment in
immigrant communities?
5. End Date for Open-Enrollment Period: How does shortening or altering the open-enrollment period affect enrollment? (The FFM closes
open enrollment on Dec.15. For the three states in this analysis, open enrollment closed on Dec. 28 (Washington), Jan. 15 (California),
and Jan. 23 (Massachusetts).
6. Other State-Specific Considerations: Expansion of Medicaid, marketing spend, availability and enrollment of alternative plans (short-
term and limited-duration plans).
6APPENDIX
Plan Selections From 2019 in Context
    SUMMARY OF ENROLLMENT TRENDS BY MARKETPLACE
    HIGHLIGHTING PLAN SELECTION CHANGES BETWEEN 2016->2018 and 2018->2019

                                                                                                                          Cumulative                                                Cumulative
                                                                        2016             2017              2018                                 2019           % Change
         Category                  Marketplace Type                                                                        % Change                                                  % Change
                                                                        Count            Count             Count                                Count         (2018->2019)
                                                                                                                         (2016 -> 2018)                                            (2016 -> 2019)

                                            FFM                       4,025,637         2,932,321        2,432,833                     -39.6%   2,051,270               -15.7%                -49.0%
        New Plan                      Massachusetts                       47,360            65,274           49,620                     4.8%      65,119                 31.2%                 37.5%
        Selections                      Washington                        74,545            91,494           78,475                     5.3%      39,237                -50.0%                -47.4%
                                         California                      425,484          368,368           388,344                     -8.7%    295,980                -23.8%                -30.4%
                                            FFM                       5,600,345         6,188,329        6,221,240                     11.1%    6,275,724                 0.9%                 12.1%
                                      Massachusetts                      166,523          201,390           217,640                    30.7%     236,760                  8.8%                 42.2%
         Renewals
                                        Washington                       126,146          134,100           164,752                    30.6%     183,399                 11.3%                 45.4%
                                    Covered California                1,149,856         1,188,308        1,133,180                      -1.5%   1,217,903                 7.5%                  5.9%
                                            FFM                       9,625,982         9,120,650        8,654,073                     -10.1%   8,326,994                -3.8%                -13.5%
                                      Massachusetts                      213,883          266,664           267,260                    25.0%     301,879                 13.0%                 41.1%
            Total
                                        Washington                       200,691          225,594           243,227                    21.2%     222,636                 -8.5%                 10.9%
                                    Covered California                1,575,340         1,556,676        1,521,524                      -3.4%   1,513,883                -0.5%                 -3.9%

    * FFM includes SBM-FP states. Kentucky excluded from analysis due to change from SBM to SBM-FP between 2016 and 2017 plan years.

Analysis of CMS/ASPE reported plan selections in public use files (https://www.cms.gov/Research-Statistics-Data-and-Systems/Statistics-Trends-and-Reports/Marketplace-Products/index.html) and using 2019 releases from
CMS (https://www.cms.gov/newsroom/fact-sheets/final-weekly-enrollment-snapshot-2019-enrollment-period), along with state data from CA, MA, and WA. FFM includes SBM-FP states. Kentucky excluded due to shift from
SBM to SBM-FP between 2016 and 2017 plan year.
                                                                                                                                                                                                                          8
Massachusetts’s Expanded Activities for 2019 Open Enrollment Appears to
Have Been a Key Driver in Growth in New Enrollment
§ Massachusetts Health Connector staff used state-level data to identify uninsured communities and populations. This analysis
helped to refresh and tailor open enrollment outreach to the current landscape of uninsurance and real-time needs in the market.
§ Open enrollment for 2019 (OE19) outreach included very clear, simple messaging through the enrollment period (unlike last year,
when new Silver-tier loading dynamics caused disruption).
§ There was an overall increase in community engagement activities, paid media and earned media:
Type of Outreach OE18 OE19 % Change
Pre-OE tour events 9 events 14 events 56%
Total earned medial placements and interviews 116 placements 154 placements 33%
Paid radio spots 2,096 radio spots 3,549 radio spots 69%
Paid TV spots 723 TV spots 1,164 TV spots 61%
§ This was the Health Connector’s third year working with a marketing and communications firm that was charged with “creating a
culture of coverage” in underinsured communities through tailored, data-driven outreach. New member gains in OE19 may be the
result of that long-term commitment and the resulting consistency in messaging.
§ Massachusetts also launched a comprehensive #StayCovered campaign to educate the state population about its continuing
individual mandate and about the importance of “shopping smart” for comprehensive health coverage that meets state standards.
9Driving Enrollment Through Targeted Outreach in Washington State
Washington Healthplanfinder has had success in partnering with community organizations to enroll
targeted groups.
• Community fairs, festivals, and events. • Project Homeless.
• Health fairs and immunization clinics. • English and foreign language radio and TV spots.
• Schools (K-12, higher ed., alternative). • Mobile medical outreach.
• WorkSource adult and youth programs. • Native navigators (Russian, Ethiopian, COFA
• Libraries. Islander).
• Jails and drug courts. • WorkSource youth programs.
• Low-income housing complexes. • Fiestas Patrias.
• Farms and orchards. • Kitsap Public Health Alerts.
• Shelters. • Methadone clinics.
• Food banks. • Hockey league.
• Farmers markets. • Stonewall Youth (LGBTQ).
• Faith-based organizations. • Back-to-school events.
• WIC and other social services offices. • Salvation Army.
• Small businesses. 10Outreach in California: Outreach and Marketing Matter in
California to Achieve a Healthier Risk Mix and Lower Premiums
Outreach and marketing efforts reflect a range of evidence-
based activities, including paid advertising and marketing, Covered California’s 2018-19
Outreach and Marketing Investments
funding a community navigator program, supporting certified $107M (out of total $340M budget)
agents and promotion through earned media.
The $107.4 million spend is about one-third of Covered
California’s budget and reflects about 1.1 percent of on-
exchange premium revenue.
11References
For examples of marketing, enrollment and other state-based strategies pursued by California, Massachusetts
and Washington, and an early analysis of 2019 open-enrollment results, see:
• Gasteier, et al. (2018). “Why Massachusetts Stands Out In Marketplace Premium Affordability.” Health Affairs Blog (Sept. 4, 2018):
https://www.healthaffairs.org/do/10.1377/hblog20180903.191590/full/.
• Washington Health Benefit Exchange (2019). “1 in 4 Washington: Benefits of the ACA in Washington State.” https://1in4wa.com.
• Covered California (2017). “Marketing Matters.” https://hbex.coveredca.com/data-research/library/coveredca_marketing_matters_9-17.pdf.
• Bingham, et al. (2018). “National vs. California Comparison: Detailed Data Help Explain The Risk Differences Which Drive Covered California's
Success.” Health Affairs Blog (July 11, 2018): https://www.healthaffairs.org/do/10.1377/hblog20180710.459445/full/.
• Covered California (2019). “Covered California 2019 Open Enrollment Early Observations and Analysis.” https://hbex.coveredca.com/data-
research/library/CoveredCA_2019_Open_Enrollment_Early_Analysis.pdf.
12Contact Information
Washington Health Benefit Exchange
Pam MacEwan
Chief Executive Officer
Pam.MacEwan@wahbexchange.org
Massachusetts Health Connector
Louis Gutierrez
Executive Director
Louis.Gutierrez@state.ma.us
Covered California
Peter V. Lee
Executive Director
Peter.Lee@covered.ca.gov
13You can also read