Extreme Solar Eruptions and their Space Weather Consequences - NASA/GSFC Nat Gopalswamy Solar Physics Laboratory - UNOOSA
←
→
Page content transcription
If your browser does not render page correctly, please read the page content below
Extreme Solar Eruptions and their
                      Space Weather Consequences
                                  Nat Gopalswamy
                              Solar Physics Laboratory
                                     NASA/GSFC

ISWI Workshop Nov 2-4, 2021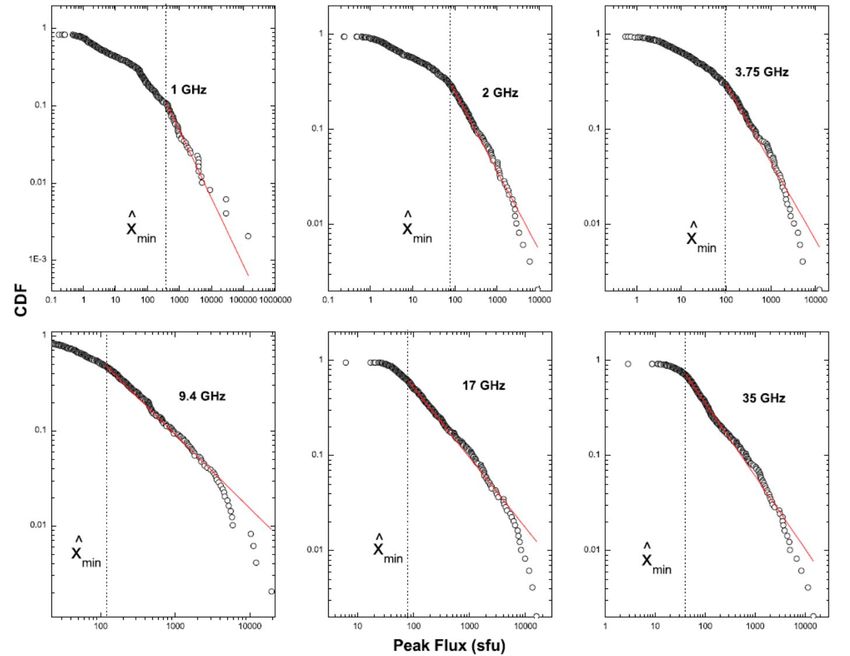
What is an Extreme Event?
    • Event on the tail of a distribution
    • An occurrence singularly unique either in the occurrence itself or
      in terms of its consequences
    • Occurrence: CME, flare (active region size, magnetic content)
    • Consequences: SEP events, Magnetic storms
    • Tail: The mechanism does not change; consider 100- and 1000-
      year events
    • Black Swans (outlier, extreme impact, hindsight bias) & Dragon
      Kings (outlier, extreme impact, different mechanism in tail)
Familiar extreme events: earthquakes, volcanic eruptions, wildfires, landslides, floods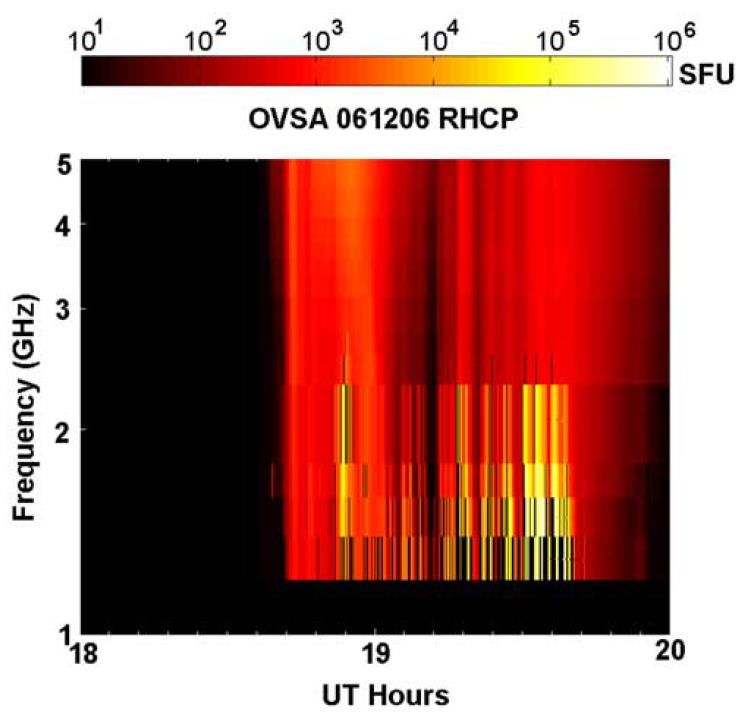
Magnetic Crochet: Solar Flare Effect on
Earth’s Magnetic Field
                                    • Flares: increased ionization in
   X2 Flare (GOES)   Nov 4 1997       the D and E layers
                                    • Enhanced conductivity →
                                      enhanced current resulting in
                                      the new magnetic field
                                    • Only observed during large
                                      flares, especially when the rise
                                      time is short

                       Canberra             Flares can be also be detected by
                                            - GNSS receivers (Curto et al. 2020)
                                            - VLF receivers (Raulin et al. 2010)

                                  R. Thompson, IPS
Carrington Flare intensity inferred
       from magnetic crochet                    Carrington Event
       Flare size: X45.7 ± 2.2; Peak 11:15 UT   Magnetic Crochet: Kew
                                                September 1, 1859
                                                Peak 11:17 UT
               V = 2700 km/s
               a = 2700/7/60 = 6.4 km s-2

Rise time = 7 min

                                                Curto et al. 2016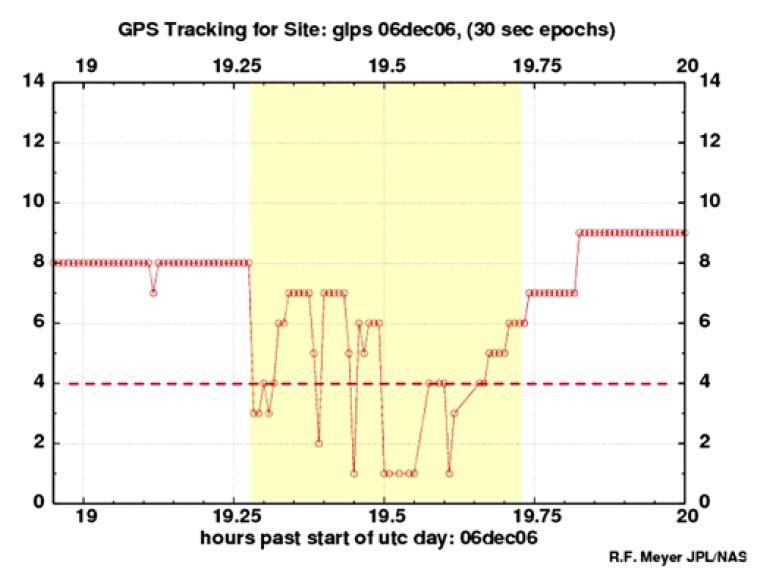
Flare Intensity in X-rays (1 – 8 Å)
           C      M      X       X10   X100

                                                            • SOLRAD, GOES Data since 1969
                                                            • The corrected size of the 2003/11/04 Flare:
                                                              X34–X48, average ~ X40 (Brodrick et al. 2005)
                                                            • Carrington flare size: X42 – X48, nominal value
                                                              of X45 (Cliver and Dietrich 2013)
                                                            • Weibull distribution: X43.9 (100-year); X101
                                                              (1000-year)
                                                            • Power law distribution: similar flare sizes: X42
                                                              and X115
                                                            • X100 → 1033 erg (super-flare threshold)
                                                            • A 1034 erg flare can occur once in 125,000 yr

The 4 November 2003 flare at 19:29 UT has the highest intensity of
                                                                                   Gopalswamy 2017
2.8x10⁻³ W m-2 (X28); corrected intensity ~ X40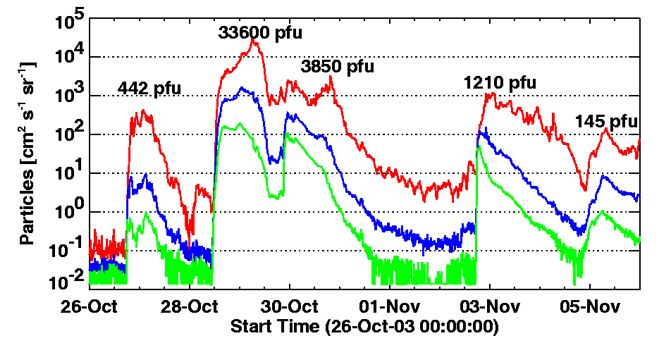
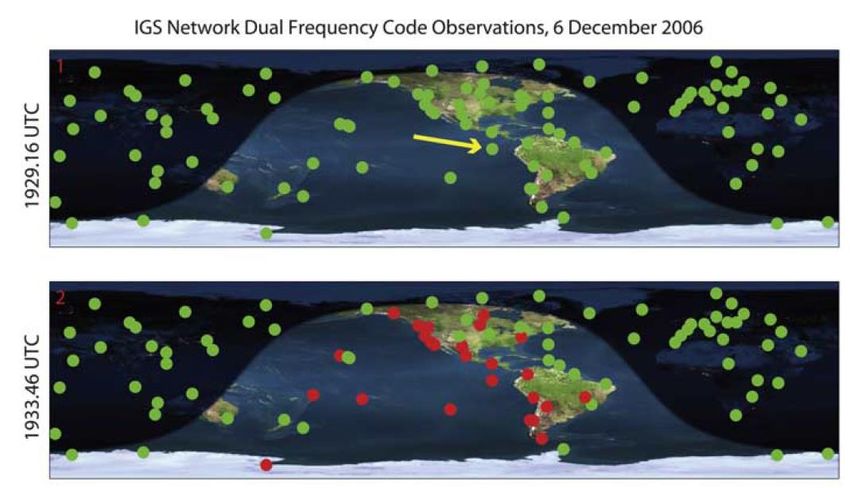
Solar Radio Burst Affecting GPS
  Microwave bursts are due to electrons accelerated in flaring regions

                                                                                                      Galapagos Islands Site

                                                                          # Satellites Tracked
• Solar Radio Bursts affect the entire sunlit hemisphere
• Different from the frequent but localized ionospheric irregularities                           Corrections require ≥4 satellites tracked
• Civilian dual frequency GPS receivers were the most severely affected
                                                                                                        Cerruti et al. 2008 SpaWea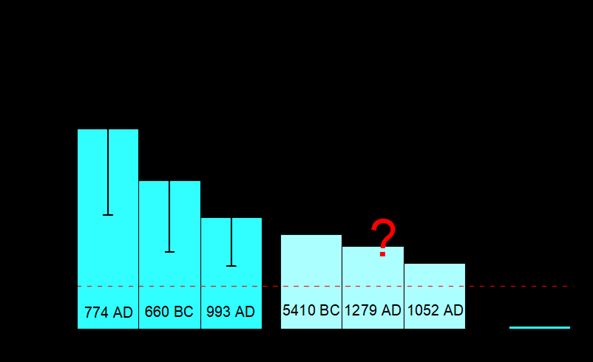
• Cliver (2021) points to the 1 GHz
                       spectrum different from others

                     • There seems to be an additional
                       mechanism different from the one
                       that produces spectra at other
                       frequencies (dragon king events)

                     • One possibility is that appropriate
                       flare conditions (B, n) exits for
                       electron cyclotron maser
                       frequencies around 1 GHz

Song et al. (2012)
Extreme Event Examples: Halloween Storms
Two halo CMEs: 10/28 and 10/29 2003
• Fast transit
• Double whammy
• Intensity of historical
proportions
NORMAL
STORM
http://wdc.kugi.kyoto-u.ac.jp/dstdir/ Movie from https://cdaw.gsfc.nasa.gov/CME_list SOHO/LASCOSignificant CMEs & their Consequences Cycle 23 – 24 CMEs from SOHO/LASCO Gopalswamy, 2006; 2010 (updated) m2 – Metric type II MC – Magnetic Cloud EJ – Non-cloud Ejecta S – Interplanetary shock GM – Geomagnetic storm Halo – Halo CMEs DH – Type II at λ 10-100 meters SEP – Solar Energetic Particles SGRE GLE – Ground Level Enhancement SGRE – Sustained γ-Ray Emission Plasma impact Energetic particles
CME Speed and Kinetic Energy

        100-year: 3800 km/s    100-year: 4.4×1033 erg
        1000-year: 4700 km/s   1000-year: 9.8×1033 erg
CME Source Regions
Photospheric Magnetogram Chromosphere (H-alpha)
A B A B
A: active region Both regions have filaments along the
B: Filament region (also bipolar, but no sunspots) polarity inversion lineSunspot Group Area
• A 100-year AR has an area of ~7000 msh (power law)
and ~5900 msh (Weibull function)
• The area of April 1947 AR (6132 msh) is similar to a
100-year event
• Max field strength ~6100 G (Livingston et al. 2006)
• Max Potential energy ~ (B2/8π)A1.5 = 3.8 ×1036 erg
• AR Flux = 1.2 ×1024 Mx
• Free energy ~0.3 MPE ~ 1.2×1036 erg
Maximum observed area was 6132 msh (SC 18) in 143 yr
1 msh = 3.077x 1016 cm2AR Flux vs. Reconnected Flux
• B = 6100 G, A = 6132 msh (6132x3.07×1016 cm2).
• AR flux ΦAR is ~1.2×1024 Mx.
• ΦRC = 0.79ΦAR0.98 gives (plot)
• ΦRC ~3.0×10²³ Mx,
• CME KE = 0.19(ΦRC)1.87 (Gopalswamy et al. 2017);
ΦRC in 1021 Mx; KE in 1031 erg
• KE = 8.2×1034 erg (not the maximum)
• An order of magnitude larger than a 1000-year
eventPeak SEP Intensity
The 23 March 1991 SEP event has the highest peak
intensity of 4.3×104 cm-2 s-1 sr-1.
The 100-year event is 5 times larger than this event
2003/10/28
100-year: 2.04×10⁵ pfu; 1000-year: 1.02×10⁶ pfuFluence
>30 MeV >10 MeV
100-year: 1.6×10¹⁰ p cm-2; 1000-year: 5.9×10¹⁰ p cm-2 100-year: 5.1×10¹⁰ p cm-2; 1000-year: 1.4×10¹¹ p cm-2Integral Fluences for Different Model Fits
10
(in units of 10 p cm )-2
100-year 1000-year
Model >10 MeV >30 MeV >10 MeV >30 MeV
Weibull 5.11 1.58 14.3 5.09
Power-law 7.08 2.12 43.7 16.3
Ellison-Ramaty 2.43 0.63 3.83 1.02
Band 2.48 0.67 4.94 1.52Fluence Spectra of Miyake Particle Events
Scaled from 2005 January 20 GLE event
• Large SEP events were identified from CEDAR tree rings that
occurred in AD 774/5 and AD 992/3 (Miyake et al. 2013)
• 1000-year fluences in the >10 MeV and >30 MeV ranges from
Weibull distribution cover the AD774/5 and AD 992/3 events
• Two-point slopes are consistent with the spectra pf known SEP
events
• AD774/5 and AD 992/3 events are consequences of SEP
events
• The 2012 July 23 Backside Event at STEREO-A shows that
1956/2/23
extreme events can occur in weak sunspot cycles
GLE#5
1972/8/4
Miyake et al. 2013; Mekhaldi et al. 2015; Usoskin 2017;
Gopalswamy et al. 2016SEP peak flux (>10 MeV) can be much higher
Fluence relative to 1956 GLE
Scaled from 2005 January 20 GLE event Identified from C14 in tree
rings; confirmed by
cosmogenic radionuclides in
polar ice core (Be10, Cl36)
1956/2/23
SEP event hypothesis bolstered by recent identification of five
GLE#5
new candidate historical events, including two 774-class events
(5259 BC, 7176 BC; Brehm et al., 2021)
1972/8/4
Cliver 2021
Miyake et al. 2012
Mekhaldi et al. 2015Geomagnetic Storm and CME parameters
Gopalswamy 2008
Dst = – 0.01VBz – 32 nT
Dst [nT]
The high correlation suggests
That V and Bz are the most
Important parameters
( - Bz is absolutely necessary)
V and Bz in the IP medium are
related to the CME speed and
V MC B z [104 nT•km/s]
magnetic content
Carrington Event: VBz = 1.6 105 nT•km/s
V = 2000 km/s, Dst = -1650 nT → Bz = -81 nT
19Satellite Anomalies Following Storm Sudden
Commencement
HL + HH
• Anomalies of High-altitude (low & high inclination)
satellites peak in 2-4 days after the SSC
• Anomalies of Low-altitude (low & high inclination)
satellites peak in 5 days after the SSC LL + LH
Iucci et al. 2005Origin of V and B
Dst = – 0.01VBz – 32 nT
Solar Wind speed
CIR Speed Alfven waves
CME speed CIR: Amplified Alfven waves
ICME: Sheath & Flux rope
Active Region
Free energy Heliospheric Active Region
Mag Field Mag Field
21
Gopalswamy 2010Magnetic Storms
• The Weibull distribution fits all the data points.
• A 100-year event has a size of -603 nT, consistent with the
March 1989 event
• A 1000-year event has a size of -845 nT, consistent with
some estimates of the Carrington storm:
• -1600 nT (Tsurutani et al. 2003)
• -850 nT (Siscoe 2006)
• -1160 nT (Gonzalez et al. 2011)
• -900 nT (Cliver and Dietrich 2013)
The empirical relation,
Dst = -0.01VBz – 32 nT
can explain –1160 nT if V = 2000 km/s and Bz = -78 nT
Using
Bt = 0.06 VICME - 13.58 nT (Gopalswamy et al. 2017)
And
|Bz| = 0.74 Bt , it is possible to get Bt =106 nT and Bz = -78 nT
100-year: -603 nT; 1000-year: -845 nTSix 100-yr storms (Dst ≤ -600 nT) in ~450 years (1582,
1730, 1770, 1859S, 1872, 1921)
Geomagnetic Storms Three 1000-yr storms (Dst ≤ -845 nT) in ~450 years
(1859S, 1872, 1921)
Potential storms of -1200 nT (July 2012; Li et al., 2013)
and -1400 nT (August 1972; Gonzales et al., 2011)
Yokoyama
1968
Gopalswamy 2018 Cliver 2021Summary
• Assuming extreme events to be events on the tails of cumulative
distributions, we estimated one-in-100 and one-in-1000 yr sizes
• Weibull function is used as the baseline in extrapolating the distributions of
AR size, flares, CMEs, SEP events, and geomagnetic storms.
• Power-law distributions appear to yield overestimates
• This approach is consistent with the historical extreme event such as the
Carrington event, the AD 774/75 event, the AD 994/95 event, and the
recent 2012 July 23 backside event
• The simple relation Dst = – 0.01VBz – 32 nT is adequate to estimate
extreme storms including the Carrington storm
• While most extreme events can be characterized as black swans, some
events fall into the category of dragon kings
https://ui.adsabs.harvard.edu/link_gateway/2017arXiv170903165G/EPRINT_PDF
Chapter 2 in https://www.sciencedirect.com/book/9780128127001/extreme-events-in-geospaceYou can also read