Factors determining speed management during distracted driving (WhatsApp messaging) - Nature
←
→
Page content transcription
If your browser does not render page correctly, please read the page content below
www.nature.com/scientificreports
OPEN Factors determining speed
management during distracted
driving (WhatsApp messaging)
Sonia Ortiz‑Peregrina1, Oscar Oviedo‑Trespalacios2, Carolina Ortiz1*, Miriam Casares‑López1,
Carlos Salas1 & Rosario G. Anera1
The objective of this work was to investigate self-regulation behaviours, particularly speed
management, under distracted conditions due to WhatsApp use. We also studied the influence of
different environments and driver characteristics, introducing visual status (i.e., visual acuity and
contrast sensitivity) as one of them. Seventy-five drivers were evaluated in a simulator study involving
two test sessions under baseline and texting conditions. A cluster analysis was used to identify two
groups with different visual capacity. Lastly, possible predictors of speed management were studied
developing a generalised linear mixed model. Our results show that drivers reduced their speeds
in the presence of more demanding driving conditions; while replying to a WhatsApp message, on
curved road segments and when parked cars are present. Driving speed also correlated with driver
characteristics such as age or dual task experience and human factors such as self-perceived risk of
texting while driving. Finally, although there were significant differences in visual capacity between
the two groups identified, the model did not identify visual capacity membership as a significant
predictor of speed management. This study could provide a better understanding of the mechanisms
drivers use when WhatsApp messaging and which environments and driver conditions influence how
speed is managed.
Driving is a highly demanding task; drivers must manage their cognitive, physical and visual skills continuously
in order to operate the vehicle. Distractions easily interrupt this task while drivers must manage the distribution
of their resources to ensure safe driving. There are different sources of distraction, from the vehicle itself1 to
the driving e nvironment1,2. In Spain, driver distraction was the cause of 32% of all accidents recorded in 2018,
with mobile phone use standing out as the main source of d istraction3. Over 40% of Spanish drivers admit to
sending text messages while driving4. High percentages have also been reported in other countries such as the
United States (~ 60%)5 or Australia (33.5%)6. Although texting while driving is banned, this trend is expected
to continue or even increase in the coming years This is due to the emergence of smartphones and instant mes-
saging applications such as WhatsApp, which have assumed a major role in our daily communications, offering
users much greater dynamism compared to SMS messages (Short Message Service)7.
Research has repeatedly highlighted the negative effects of texting on driving p erformance8-10. Naturalistic
driving studies have shown that, whereas primarily cognitive secondary tasks do not seem to increase crash
risk50, manual interactions with a mobile phone significantly increase the risk of an accident, largely due to
visual distraction51. This result is also supported by a simulator-based study where texting doubled the risk of
an accident11, despite the fact that drivers typically self-regulate their driving when distracted. Self-regulation
is a dynamic strategy that drivers use to manage the demands on the resources they require to control the vehi-
cle and perform the secondary task, prioritising the former to minimise the safety risk as much as p ossible12.
Self-regulation while distracted includes operations such as paying less attention to the secondary t ask12, over
correcting the vehicle’s position9,13, and overcorrecting or reducing speed10,12,13. Speed reduction is a behav-
iour commonly observed in all distraction t ypes8,10,14,15 because of the difficulties drivers experience in their
performance16. Furthermore, when drivers are distracted by texting messages, their behaviours are different
depending on whether they are reading or composing the message. Reading seems to have a greater influence
on speed and reaction times, while composing messages affects speed and lane departures, indicating different
levels of demand on mental awareness52.
1
Laboratory of Vision Sciences and Applications, Department of Optics, University of Granada, Edificio Mecenas,
Av. Fuentenueva s/n, 18071 Granada, Spain. 2Centre for Accident Research and Road Safety‑Queensland
(CARRS‑Q), Queensland University of Technology (QUT), Brisbane 4059, Australia. *email: ortizh@ugr.es
Scientific Reports | (2020) 10:13263 | https://doi.org/10.1038/s41598-020-70288-4 1
Vol.:(0123456789)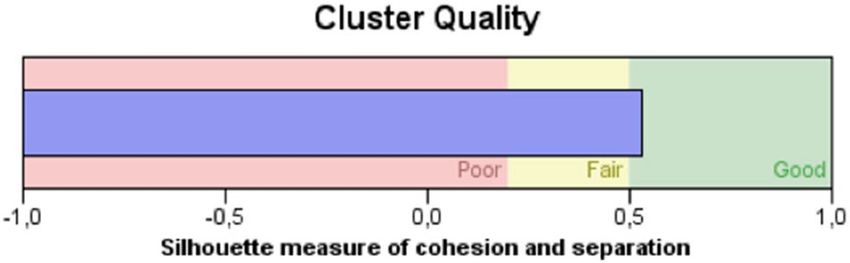
www.nature.com/scientificreports/
Sociodemographic characteristics Mean (± SD)/N (%)
Age (years) 38.7 (± 15.0)
Gender
Male 53 (70.7)
Female 22 (29.3)
Experience texting while driving
0 Never 45 (60)
1 1–2 times a year 6 (8)
2 1–2 times a month 10 (13.3)
3 1–2 times a week 8 (10.7)
4 Daily 6 (8)
Self-perceived increase in risk while texting
0 None 0 (0)
1 Slight 0 (0)
2 Somewhat 1 (1.3)
3 Quite a lot 13 (17.3)
4 A lot 61 (81.4)
Table 1. Sociodemographic characteristics of the sample (continuous variable age is shown as mean ± SD).
However, the management of resources while distracted and the consequent behaviours seem to be influenced
by other factors. The task–capability interface model developed by Fuller et al. (2008)17 indicated that speed
management is the result of combining influences related to the vehicle, the environment and the driver. With
respect to the environment, some studies have shown that people reduce their speeds in function of certain road
characteristics6,18,19, in heavy t raffic20,21, and in situations with more visual information such as urban r oads10,19.
Similarly, some evidence has suggested that driver characteristics such as age, sex or other personal traits have
an impact on speed m anagement1,19.
While driving, we have to carry out precise searches in environments cluttered with visual information in
order to produce a rapid and effective response, which may be vital for safety reasons. We also self-regulate vehicle
speed according to visual information from the environment; for example, reducing speed to comply with road
signs, in anticipation of a potential hazard or to adapt to current traffic conditions. Drivers with a deteriorated
visual capacity may find it even harder to detect visual information in complex scenarios, e.g., with considerable
amounts of visual clutter22. Ageing promotes a natural decrease in visual function23-25 and this is significant even
when visual acuity is much higher than the minimum required for driving. In fact, different studies have shown
that among older drivers, visual impairment is one of the leading causes of driver behaviour modification, limit-
ing their exposure to situations perceived as more challenging, such as adverse meteorological conditions, heavy
traffic or high s peeds26,27. A worse visual status could imply longer periods of distraction from the road when
texting, leading to a greater speed reduction as a compensatory mechanism. Both driving and typing WhatsApp
messages are strongly dependent visual tasks, so worse vision can be expected to have an influence on speed
adaptation mechanisms, but this issue has not yet been investigated in previous studies.
Thus, the aim of this study was to investigate self-regulation behaviours, and more specifically speed man-
agement, when distracted due to WhatsApp use. Using WhatsApp while operating a moving vehicle involves
visual–manual interactions, which is now a major concern in terms of road safety. Therefore, we examined the
influence of different environments and driver characteristics by introducing visual status as one of the factors
that could affect how distraction is managed while at the wheel.
Data collection
Participants. Ninety-eight drivers were recruited from the general population via a special online campaign
on our website. All were in good general health and did not have any eye diseases. Participants were required
to have a binocular visual acuity of 20/40 or better, the legal level for driving in Spain. They must have had a
valid driving license for at least one year and driven at least 1000 km in the last year. Likewise, participants were
required to be experienced WhatsApp users (≥ 30 WhatsApp messages per day). Of these participants, 16 were
excluded due to simulator sickness and seven for not meeting other inclusion criteria (colour vision deficiencies
(2), binocular problems (3) and lack of driving experience (2)). Table 1 shows the demographic characteristics
of the seventy-five drivers (19–68 years) that were eventually enrolled in the study.
The study was approved by the University of Granada Human Research Ethics Committee (180/CEIH/2016).
Prior to the testing sessions, all subjects signed the informed consent form in accordance with the Declaration
of Helsinki.
Visual assessment. Visual acuity. Visual acuity (VA), or the ability to resolve detail, is a standardised
visual test used by licensing authorities worldwide in driver screening procedures. In our study, VA was meas-
ured with the POLA VistaVision Visual Acuity Chart at 5.5 m (logMAR scale) employing Snellen letters.
Scientific Reports | (2020) 10:13263 | https://doi.org/10.1038/s41598-020-70288-4 2
Vol:.(1234567890)www.nature.com/scientificreports/
Road geometry and traffic complexity
Road geometry
Scenario Road type Speed limit (kph) Other traffic Road layout Slope Parked cars around
1 Dual carriageway 120 Same direction Straight No No
2 Dual carriageway 120 Same direction Slight bend No No
Oncoming Same
3 Mountain road 90 Straight Gentle/ascending No
direction
Oncoming Same
4 Mountain road 90 Sharp bend Gentle/ascending No
direction
Oncoming Same
5 Mountain road 40 Straight Gentle/ascending No
direction
Oncoming Same
6 Mountain road 40 Sharp bend Gentle/ascending No
direction
Oncoming Same
7 Mountain road 90 Straight Steep/ascending No
direction
Oncoming Same
8 Mountain road 90 Straight Steep/ descending No
direction
9 City 50 Same direction Straight No Yes
10 City 50 Same direction Straight No No
Table 2. Characteristics of the different driving scenarios selected for the analysis.
Contrast sensitivity. Contrast sensitivity is a visual test used to study the eye’s ability to distinguish between
an object and the background, and not only size. Contrast sensitivity function (CSF) was obtained experimen-
tally by measuring the contrast threshold (i.e., the contrast required to reliably perceive a visual target on a
uniform background). Thus, CSF was calculated from the inverse of the contrast threshold as a function of
spatial frequency. We used the CSV-1000 test (VectorVision, Ohio, USA) at the recommended viewing distance
(2.5 m) and expressed in log units to measure this clinical parameter. More details of this visual test are provided
elsewhere28.
The two visual tests were performed binocularly, with participants wearing their normal optical correction
used when driving.
Driving simulator: road scenarios. The virtual driving environment used in this study was generated on three
high-definition 27″ screens, with a resolution of 1920 × 1080 pixels and a 180° field of view.
It was employed a fixed-base driving simulator (Logitech G27 Racing Wheel, Logitech International S.A.,
Lausanne, Switzerland) and all driving routes were generated with SIMAX DRIVING SIMULATOR v4.0.8 BETA
(SimaxVirt S.L., Pamplona, Spain) software.
The route was approximately 12.5 km long and took about 15 min to complete. It included three different
main road types, similar to those which can be found on the Spanish road network: dual carriageway, mountain
road and an inner-city circuit. From these three road types we choose 10 different scenarios for analysis with
varying combinations of road geometry and traffic complexity (Table 2, Fig. 1). Road types involved different
speed limits. Traffic complexity included the presence of oncoming cars or other vehicles in the same direc-
tion. Road geometry refers to the road layout (straight, slight bend or sharp bend) and the presence and type
of slope (no slope, gentle, steep, ascending or descending slope). The inner-city road type also featured parked
cars around the driver.
For driving performance data analysis, we selected a representative length of 100 m along each driving sce-
nario that contained certain characteristics in terms of road geometry, speed limit and traffic complexity. This
type of analysis has been used p reviously19, as it means both traffic conditions and road geometry are as uniform
as possible throughout the section being analysed, thus guaranteeing that driving performance is studied under
specific conditions. Furthermore, there must be sufficient separation between the various sections with different
characteristics that are used in the analysis. This ensured the sections did not have an influence on each other
because drivers were still in the process of adapting their driving to each new scenario.
Experimental procedure. All participants received at least two training sessions before the experiment so they
could familiarise themselves with the driving simulator. The training sessions lasted about 15 minutes and were
conducted using similar routes to those used in experimental sessions, but without any traffic or pedestrians.
After completing the training, they were tested in two different sessions to measure driving under baseline and
texting conditions. To avoid any possible learning effects, there was a 1 week interval between the training and
experimental sessions, and the order of administration of the experimental sessions was also random. If any
symptoms of simulator sickness were noted at any stage during the study, the session was interrupted and the
participant excluded from the study.
Visual tests were administered at the beginning of experimental sessions, one in each session and in a ran-
dom order. Participants took a 10-minute break between the visual test and the experimental drive. Thus, each
experimental session lasted about 40 minutes.
Scientific Reports | (2020) 10:13263 | https://doi.org/10.1038/s41598-020-70288-4 3
Vol.:(0123456789)www.nature.com/scientificreports/
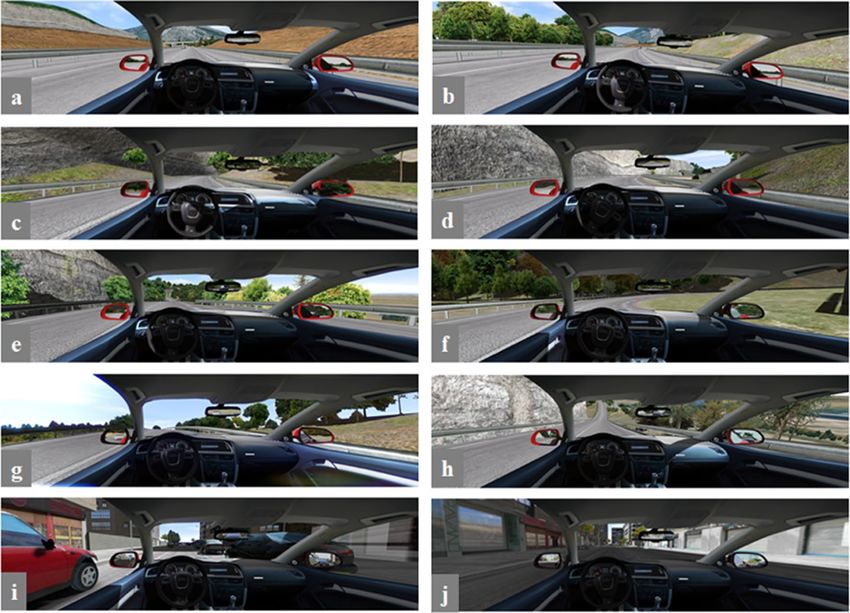
Figure 1. Screenshot of the different driving scenarios selected for the analysis (a-j correspond to scenarios
1–10).
In the texting condition, participants received six WhatsApp messages, with five short general knowledge
questions and one simple mathematical problem (e.g., “What is the last day of the week?”, “What are the colours
of the French flag?”, or “If the bill is €12.50 and I pay with a €50 note, how much change should I receive?”). They
were instructed to answer these questions in a similar manner as occurs in actual driving, that is, prioritising the
driving task. All messages were of a similar length (30–55 characters) and sent at specific points along the route
that were strategically selected so drivers could be observed performing the dual task in the 10 scenarios selected
for data analysis. Replies required typing between 2 and 16 characters, as this length is considered realistic from
the perspective that a driver could do this in a real driving scenario. During the texting session, we recorded the
time and point along the route where drivers started and finished interacting with the mobile phone. This guar-
anteed that the data analysed in the scenarios corresponded with the moment that participants were engaged in
the secondary task. Participants drove with the smartphone in a cradle located to the right of the steering wheel
when they were not interacting with it. However, when reading or writing WhatsApp messages, they were free
to do so as they would normally, i.e., holding the phone in their hands. This is important to increase the external
validity of the experiment, as we wanted to simulate realistic phone use while driving. Participants also used
their own smartphones to ensure they were familiar with its operation.
Method. Speed management. Speed management was analysed for all the scenarios and both driving con-
ditions (baseline and texting). To this end, we calculated how much the participants’ speed deviated from the
displayed limit (driving speed—speed limit). Therefore, negative values of deviation from the speed limit means
the driver went slower than the limit, which suggests an increase in safety29.
Data analysis and statistical procedures. Data analysis involved two main phases. Firstly, a two-step cluster
analysis method was chosen to classify participants into different categories of visual status. This technique
assigns participants to a cluster by minimising within-cluster variance and maximising between-cluster vari-
ance. The number of clusters is selected using the Akaike information criterion (AIC). The second phase of the
study analysed the drivers’ behaviour on different road geometries and of different traffic complexities using a
generalised linear mixed model (GLMM) with repeated measures (road scenarios during baseline and texting
conditions). We used this model to address the lack of normal distribution of the dependent variable data, i.e.,
the distribution of the variable “speed management” (Kolmogorov–Smirnov test). Driving conditions (baseline
and texting), road scenario/complexity, gender, visual quality group, experience in texting while driving and
self-perceived increase in risk in texting while driving were included as factors, and driver age as a covariate.
Scientific Reports | (2020) 10:13263 | https://doi.org/10.1038/s41598-020-70288-4 4
Vol:.(1234567890)www.nature.com/scientificreports/
Figure 2. Silhouette measure of cluster quality in terms of visual status.
Cluster results T-test
Visual variables Low visual capacity group High visual capacity group t df p
Visual acuity − 0.01 ± 0.04 − 0.10 ± 0.02 − 13.473 73 < 0.001
Contrast sensitivity 1.80 ± 0.14 1.91 ± 0.09 4.179 65.46 < 0.001
Group size 39 (52%) 36 (48%) – – –
Table 3. Results of a cluster analysis and t-test comparing the two groups identified.
Baseline conditions (kph) Texting conditions (kph) Mean difference (baseline—distraction) t df p value
Scenario 1: Dual carriageway, straight, 120 kph
− 1.05 ± 11.87 − 17.09 ± 17.46 16.04 8.256 74 < 0.001**
SL
Scenario 2: Dual carriageway, slight bend, 120
− 10.70 ± 13.95 − 17.46 ± 15.05 6.76 3.462 74 0.001*
kph SL
Scenario 3: Mountain, straight, 90 kph SL − 29.66 ± 13.78 − 38.77 ± 11.52 9.11 4.484 74 < 0.001**
Scenario 4: Mountain, sharp bend, 90 kph SL − 23.62 ± 9.65 − 31.94 ± 11.18 8.32 5.512 74 < 0.001**
Scenario 5: Mountain, straight, 40 kph SL 2.19 ± 9.26 2.57 ± 9.83 − 0.38 − 0.241 74 0.810
Scenario 6: Mountain, sharp bend, 40 kph SL − 0.99 ± 6.49 − 2.89 ± 5.65 1.90 2.011 74 0.048*
Scenario 7: Mountain, straight, ascending, 90
− 17.41 ± 6.49 − 24.53 ± 12.01 9.02 5.202 74 < 0.001**
kph SL
Scenario 8: Mountain, straight, descending, 90
− 0.98 ± 12.07 − 8.36 ± 15.29 7.38 3.824 74 < 0.001**
kph SL
Scenario 9: City, straight, parked cars, 50 kph SL − 17.37 ± 8.28 − 24.66 ± 8.77 7.29 5.980 73 < 0.001**
Scenario 10: City, straight, no parked cars, 50
− 8.45 ± 13.58 − 7.30 ± 12.56 − 1.15 − 0.689 73 0.493
kph SL
Table 4. Mean ± SD and associated t-test comparing speed management across the different road scenarios
under baseline and texting driving conditions. SL speed limit. *p < 0.05; **p < 0.001.
The use of this model as an approximation for driver performance has been verified previously19,53. The above
model accounts for correlations resulting from multiple observations from the same driver, as is the case for
experimental data in this study.
Results
Visual status: cluster analysis. The two-step cluster analysis identified two groups according to visual
status (high and low visual capacity). The silhouette value of cohesion and separation indicated good cluster
quality (Fig. 2). Table 3 shows the results in which the entire sample was classified into two similar sized groups
based on visual acuity and contrast sensitivity: the low and high visual capacity groups. An independent t-test
revealed significant differences for visual acuity and contrast sensitivity.
Speed management across the different driving conditions and road scenarios. Firstly, we con-
ducted a descriptive analysis to compare speed management for the different driving conditions (baseline or
texting) and road scenarios. The results are summarised in Table 4.
Participants’ speed was the furthest below the speed limit along the mountain road sections corresponding
to scenarios 3 and 4 where the limit was 90 kph, which indicates that the drivers did not feel as safe driving close
to the limit. However, the only time drivers exceeded the speed limit was also on the mountain road (scenario
5), in a straight segment with a 40 kph limit.
On the dual carriageway, they drove more slowly through the slight bend segment (scenario 2) compared to
the straight segment (scenario 1), although while distracted they drove at a similar speed for both road geom-
etries (scenarios 1 and 2).
Scientific Reports | (2020) 10:13263 | https://doi.org/10.1038/s41598-020-70288-4 5
Vol.:(0123456789)www.nature.com/scientificreports/
Parameter Coefficient SE t-statistic p value 95% CI
Condition
Baseline – – – – –
Texting − 5.08 0.53 − 9.56 < 0.001** [− 4.04, − 6.12]
Road scenario/complexity
Scenario 1: Dual carriageway, straight, 120 kph SL 0.73 1.59 0.46 0.647 [− 2.41, 3.86]
Scenario 2: Dual carriageway, slight bend, 120 kph SL − 6.40 1.58 − 4.06 < 0.001** [− 9.50, − 3.29]
Scenario 3: Mountain, straight, 90 kph SL − 26.99 1.46 − 18.43 < 0.001** [− 29.87, − 24.10]
Scenario 4: Mountain, sharp bend, 90 kph SL − 19.94 1.35 − 14.78 < 0.001** [− 22,60, − 17.28]
Scenario 5: Mountain, straight, 40 kph SL 10.06 1.34 7.50 < 0.001** [7.42, 12.70]
Scenario 6: Mountain, sharp bend, 40 kph SL 5.98 1.18 5.07 < 0.001** [3.65, 8.31]
Scenario 7: Mountain, straight, ascending, 90 kph SL − 12.82 1.26 − 10.18 < 0.001** [− 15.30, − 10.34]
Scenario 8: Mountain, straight, descending, 90 kph SL 3.20 1.52 2.11 0.036* [0.21, 6.19]
Scenario 9: City, straight, parked cars, 50 kph SL − 13.56 1.28 − 10.56 < 0.001** [− 16.09, − 11.03]
Scenario 10: City, straight, no parked cars, 50 kph SL – – – – –
Driver characteristics
Age − 0.09 0.02 − 3.98 < 0.001** [− 0.13, − 0.04]
Gender
Male 1.35 0.66 2.05 0.041* [0.056, 2.65]
Female – – – – –
Visual quality
Better – – – – –
Worse 0.19 0.55 0.35 0.727 [− 0.89, 1.28]
Experience texting while drivinga
0-Never − 1.68 1.04 − 1.61 0.108 [− 3.73, 0.35]
1-1–2 times a year − 2.43 1.33 − 1.82 0.069 [− 5.05, 0.19]
2-1–2 times a month − 0.09 1.18 − 0.08 0.937 [− 2.40, 2.22]
3-1–2 times a week − 3.38 1.24 − 2.71 0.007* [− 5.82, − 0.93]
4-Daily – – – – –
Self-perceived increase in risk while textingb
2-Somewhat 9.51 2.32 4.10 < 0.001** [4.96, 14.08]
3-Quite a lot 1.74 0.78 2.22 0.026* [0.20, 3.28]
4-A lot – – – – –
Intercept − 6.50 1.58 − 4.12 < 0.001** [− 9.60, − 3.40]
Number of observations 1500
AIC 11,343.84
BIC 11,449.72
Table 5. Generalised linear mixed model (GLMM). Estimates of speed management. –, Reference category;
*p < 0.05; **p < 0.001. a Scale: (0) Never–(4) Daily. b Scale: (0) None–(4) A lot.
In scenarios 7 and 8, the results showed that drivers reduced their speeds for ascending segments to a greater
extent than for descending segments. Likewise, scenarios 9 and 10 evidenced drivers adopted speeds below the
limit in urban areas, driving slowest in the segment featuring parked cars (scenario 9).
Differences between the conditions (baseline and texting) were examined using a paired samples t-test. The
results, shown in Table 4, indicate drivers generally adapted their speed more under distracted conditions, driving
more slowly than the baseline and, therefore, even further below the speed limit. The only scenarios in which
drivers did not significantly reduce their speed, and even increased it while texting, were scenarios 5 (mountain
road, straight, 40 kph SL) and 10 (city, straight, no parked cars), which could be considered the two simplest
segments along the route. On the other hand, mean differences indicated that the driving scenario which elicited
the greatest reduction in velocity when driving under texting conditions compared to baseline conditions was
scenario 1 (motorway, straight, 120 kph SL).
Influence of driving conditions, traffic complexity and driver characteristics: generalised lin‑
ear mixed model (GLMM) results. The GLMM was used to identify possible predictors of speed man-
agement. The dependent variable included in the model was speed management and possible predictors were:
driving conditions (baseline/texting), road scenario (1–10) and driver characteristics (age, gender, visual status,
experience texting while driving and self-perceived increase in risk while texting). To identify whether visual
Scientific Reports | (2020) 10:13263 | https://doi.org/10.1038/s41598-020-70288-4 6
Vol:.(1234567890)www.nature.com/scientificreports/
status could predict speed management, visual capacity was introduced as a categorical variable with subjects
classified according to the cluster analysis.
The results of the estimates and t-test are shown in Table 5. With respect to driving condition, the model
showed that texting while driving was a significant predictor of speed management, as participants drove − 5.08
kph slower while texting WhatsApp messages compared to baseline condition.
Of the different road environments and traffic complexity scenarios, the GLMM results indicated that all the
scenarios, except scenario 1, had characteristics that were significant predictors of speed management. Compared
to the reference category (scenario 10), the scenario where drivers exhibited the greatest speed management was
scenario 3 (mountain, straight road, 90 kph SL), wherein participants drove approximately − 26.99 kph slower.
Similarly, the second largest speed reduction (about − 19.94 kph) was effected for scenario 4, which had the same
characteristics as scenario 3 but with a curved layout. Although the other two scenarios conducted on mountain
roads (5 and 6) were also significant predictors of speed management, the results show that for these segments
participants drove at higher speeds than for the reference category (about 10.06 and 5.98 kph respectively).
Regarding the scenarios that included a slope (scenarios 7 and 8), they also proved to be significant predictors
of speed management. In this case, the ascending slope was associated with speeds considerably slower than the
reference category (− 12.82 kph) but drivers tended to descend at higher speeds than the reference category (3.20
kph). Finally, parked cars in the vicinity when driving in the city was a significant predictor of speed manage-
ment, with speeds − 13.56 kph slower compared to the reference category.
Driver characteristics were also found to be significant predictors of speed management across the different
driving conditions. Participants drove at increasingly lower speeds under the limit (about − 0.09 kph) for every
year they increased in age. On the other hand, women drove more slowly than men, with a difference of − 1.35
kph. The results also revealed that experience texting while driving significantly predicted speed management,
with drivers who texted daily in their own cars being the fastest group. Self-perceived increase in risk due to
texting while driving also predicted speed management. In this case, drivers who felt texting was risky drove at
slower speeds. Finally, visual capacity group did not significantly predict speed management.
Discussion
This study investigated the impact of texting while driving on speed management across different road scenarios
with a wide range of features. It also compared driver characteristics, including the influence of visual status,
since vision is the main sensory mechanism involved in both driving and the use of smartphone instant mes-
saging applications such as WhatsApp.
Effect of phone interaction. Our findings show that interacting with the smartphone application What-
sApp while driving had an effect on participants’ speed management. The scenario that caused drivers to reduce
their speed the most under texting conditions compared to baseline condition was scenario 1 (motorway,
straight, 120 kph SL). This result could be due to the fact that participants received and responded to their first
message of the session during this scenario, so they may have acted more cautiously than for the rest of the mes-
sages.
According to the GLMM, messaging while driving implies a speed reduction of approximately 5 kph with
respect to the baseline session.
Self-regulation behaviours, such as speed reduction, are known to depend on the modality of the phone
interaction1,15,19,30. Hands-free conversations are the less demanding phone-based distractor, implying only cogni-
tive distraction. However, hands-held conversations add manual distraction and texting combines three types:
visual, manual and cognitive distraction. Yet recent meta-analyses and systematic reviews show that hands-free
or hand-held mobile phone conversations have a minor effect on crash risk31-33, while texting and browsing
seem to have a greater effect on driving speed behaviour, leading to reduced speeds8. Visual distraction is a key
factor in speed reduction, given that drivers must stop looking at the road for considerable periods, leaving
them blind to the driving scenario. Along this line, Yannis et al., (2014)10 demonstrated mean speed reductions
of around 10 and 14 kph when drivers read and wrote SMS, respectively. As in the present case, these speed
reductions were greater than those reported in other studies focusing on phone conversations, which illustrates
that visual–manual tasks impose a greater d emand34,35. In our study, the drivers reduced their speed to a lesser
degree, maybe because the WhatsApp environment is more familiar considering the revolution this application
has brought about in messaging as a means of communication. All our participants were regular WhatsApp users
and reported sending at least 30 messages a day. This could give them a greater sense of security while driving
compared to writing a text message with other interfaces.
Effect of driving environment. Driving complexity impacts on the workload required to safely complete
the driving task36,37, causing self-regulation (or risk compensatory) behaviours among drivers. In our study,
participants showed the greatest degree of speed self-regulation (i.e., speed reduction compared to baseline driv-
ing conditions) on the mountain road, where the speed limit was 90 kph, which indicates they felt the driving
geometry was too complex to drive close to the posted speed limit. This section of the route (mountain road) is
considered a relatively complicated one due to its layout and the presence of oncoming traffic.
An analysis of speed management across scenarios showed that, as expected, curved roads require greater
adaptation compared to straight roads. Thus, under distracted conditions, they drove through curved segments
slower on the motorway (scenarios 1 and 2) and mountain roads (scenarios 5 and 6), by 0.37 and 5.46 kph
respectively, compared to the straight segments (Table 4). Previous research has found similar r esults13, suggest-
ing that drivers consider bends to be risky features18. Surprisingly, we observed the contrary when comparing
scenarios 3 and 4 (mountain road, 90 kph SL), although this could be because the straight section was situated
Scientific Reports | (2020) 10:13263 | https://doi.org/10.1038/s41598-020-70288-4 7
Vol.:(0123456789)www.nature.com/scientificreports/
between two sharp curves, hence the configuration may have influenced the result. Additionally, these two
scenarios correspond to those with the highest deviation from the speed limit and this may be explained by
the fact that the participants were interacting with the message that required the greatest cognitive attention, a
simple maths p roblem38.
On the other hand, an ascending slope made drivers reduce their speed in both the baseline and texting ses-
sions. However, when the slope was descending, they practically only drove below the posted speed limit during
the texting session. This observation could be because distraction means drivers monitor their speed less and
the descending slope causes them to drive more q uickly34. Finally, our results revealed that participants drove
considerably below the posted speed limit when in urban scenarios (9 and 10). Moreover, under distracted con-
ditions, the influence of parked cars in an urban setting resulted in considerable speed adaptations compared
to the scenario with no parked cars. Urban scenarios are considered to require the highest workloads given that
they are the more visually cluttered. The large amount of information in an urban environment (traffic flow,
traffic signals, roundabouts, advertising boards, commercial areas, pedestrians, etc.) means drivers perceive a
high load of visual stimuli which they must manage while driving their vehicle. Previous research has also found
higher self-regulation of driving speeds while texting in urban s cenarios10,19,39. The presence of parked cars in
the vicinity may also trigger speed adaptations, as there is a sense of greater visual clutter. Parked cars necessitate
more interaction with traffic and an increased sense of danger. Indeed, most studies into mobile phone driver
distraction have observed changes in speed management when other vehicles were p resent20,21.
Effect of driver characteristics. Driver age is another significant predictor of speed adaptation, with
older drivers reducing their speeds more than younger ones. This result agrees with those published previously
in other s tudies39, with older drivers deviating more from the posted speed limit1,29. Furthermore, these works
highlight that both phone interaction and environment complexity have more pronounced effects on older driv-
ers’ speed behaviour. Research has found that older drivers are better risk estimators40,41, possibly because they
are aware of a decline in their motor, visual and cognitive capacities, so they try to compensate in more demand-
ing situations. A less widespread result in the literature contrasts with our findings regarding driver age, this is
probably due to samples composed uniquely of young drivers (< 30 years old)—in this age range greater experi-
ence could lead to drivers adopting faster speeds19.
Driver gender was a significant predictor of speed management in our sample. As such, males reduced their
speed less than females (they drove 1.35 kph faster). A number of studies have reported that males are more
prone to engage in risky behaviours and attitudes during driving such as speeding42-44. Women may have less
self-confidence regarding their abilities or greater awareness of their limitations, so they perceive risk differently.
For example, a study that analysed driving self-regulation in visually impaired older drivers discovered women
self-regulated their driving to a greater extent than m en45. However, despite demonstrating greater caution, the
study conducted by Li et al., (2019)46 reported that female driving performance during distracted tasks involved
more collision risk.
The cluster analysis successfully identified two groups with different visual status (high and low visual capac-
ity). Be that as it may, the GLMM did not identify visual capacity membership to be a significant predictor
of driver speed even though both driving and texting WhatsApp messages are strongly dependent on vision.
Although, to the best of our knowledge, this is the first time visual status has been included as a possible pre-
dictor of speed management under distracted conditions, the influence of vision on driver self-regulation has
been explored previously, especially in older drivers. Thus, some studies have found that visually impaired older
drivers commonly self-regulate their driving, avoiding challenging situations such as bad weather conditions
with poor visibility, rush hour or high-speed roads26,47. Our hypothesis was that visual difficulties would increase
the workload for both texting and driving tasks, which could make drivers adopt compensatory mechanisms
to reduce the risk associated with the increase in visual demand. We expected this behavioural adaptation to be
more marked in settings with greater visual clutter such as the urban scenarios included along the route. However,
we did not observe this trend, possibly because all the participants had normal vision and a visual acuity above
the legal minimum required for driving. Maybe the difference between the two cluster groups is not enough for
the participants in the low visual capacity group to perceive themselves as having visual difficulties, so it does
not bear an influence on their risk management while driving. There is also the possibility that the simulated
environment provides a less complex visual environment than real driving conditions. Although the fidelity of
driving simulator environments is becoming more and more realistic, it is still not as varied as in the real world,
where we can find a very broad and diverse range of visual information and stimuli. For instance, the simulator
used in this study did not include road signs, obstacles and pedestrians with reduced contrast levels, which are
common in real driving conditions. Road signs can deteriorate over time and pedestrian clothing can have low
levels of saliency. Future studies should include stimuli with different contrast levels in their routes to determine
whether visual capacity influences driver behaviour in distracted driving conditions.
Texting while driving is banned in Spain; nevertheless, a large proportion of the participants admitted they
did it quite often (Table 1). In our study, this factor presented a significant association with the drivers’ speed
management, as such those who never normally engaged in texting while driving self-regulated their speed
more than the rest. What is more, higher scores for self-perceived risk in relation to the dual task correlated
significantly with lower speeds. It is expected that dual-task experience should be influenced by safe attitudes
towards mobile phone use or self-efficacy29. Drivers who confess to daily contact with the application and their
mobile phone perceive a higher self-efficacy in the secondary task, as they find typing a quick, straightforward
task. These could be the youngest drivers, who sometimes channel a large part of their communication through
this type of a pplication7. Consequently, drivers who perceive less risk during the dual task exhibit faster s peeds19.
Scientific Reports | (2020) 10:13263 | https://doi.org/10.1038/s41598-020-70288-4 8
Vol:.(1234567890)www.nature.com/scientificreports/
Limitations of the study
The findings of this study should be interpreted cautiously due to the limitations of the methods employed. First
of all, the use of a driving simulator supposes an important limitation because it cannot provide a truly repre-
sentative driving environment. Nevertheless, this simulator has been used successfully in a previous s tudy9 and
riving48,49. Also, the
there is evidence to support the relative validity of driving simulators with respect to actual d
order of presentation of the different scenarios during the simulated route was the same in both experimental
drives, and this could influence the results in some way. For instance, it is likely that the lower speeds observed
in scenario 1 compared to scenario 2 are due to the fact that scenario 1 was the first scenario presented. Scenario
1 could have served as a warn-up period until the participants adapted to the simulator and mobile phone task.
Future research and replication are needed in light of potential leaning effects. Nonetheless, it is important to
remember that drivers typically experience the same routes in their day-to-day driving. Therefore, this experi-
ment has some level of external validity.
On the other hand, messages sent during the trajectory were designed to generate a certain degree of cog-
nitive, manual and visual complexity, but while also maintaining realism insofar as drivers could reply to the
message in a real-world situation. However, the differences in the questions sent and the artificial nature of the
content could affect the results, so this must be considered when interpreting said results. In addition, partici-
pants used their own smartphone to ensure that they were familiar with the device. Thus, it is likely that some
characteristics of the phone could have differed between participants, e.g., screen size, font size or brightness.
Although we cannot control for such small differences, not using their own phone or preferred settings would
present potential confounders. A lack of familiarity with the phone could increase the complexity of the phone
task, which could trigger self-regulation54.
Finally, even though our study included a relatively broad sample over a large age range, there are certain
aspects that must be taken into account. One is the different distribution in genders and another is the range of
WhatsApp usage habits among the p articipants7.
Conclusions
In our study, we found that speed management is associated with the secondary task, driving environment and
driver characteristics. In general, drivers reduce their speeds when faced with more demanding driving situa-
tions; while replying to a WhatsApp message and in more complicated situations such as curved roads or with
more traffic interactions). Driving speed was also modulated according to driver characteristics such as age or
dual task experience and human factors such as self-perceived risk. Nevertheless, our study did not evidence
any speed differences between groups with a different visual status, maybe because all the participants had a
visual acuity within the legal limit for driving. Future studies should explore speed management in different
conditions of visual impairment.
Data availability
The datasets generated during the current study are available from the corresponding author on reasonable
request.
Received: 11 February 2020; Accepted: 27 July 2020
References
1. Horberry, T., Anderson, J., Regan, M. A., Triggs, T. J. & Brown, J. Driver distraction: the effects of concurrent in-vehicle tasks, road
environment complexity and age on driving performance. Accid. Anal. Prev. 38, 185–191 (2006).
2. Edquist, J., Horberry, T., Hosking, S. & Johnston, I. Effects of advertising billboards during simulated driving. Appl. Ergon. 42,
619–626 (2011).
3. Dirección General de Tráfico. Las principales cifras de la siniestralidad en 2018. Madrid (2019).
4. Prat, F., Gras, M. E., Planes, M., Font-Mayolas, S. & Sullman, M. J. M. Driving distractions: An insight gained from roadside
interviews on their prevalence and factors associated with driver distraction. Transp. Res. Part F Traffic Psychol. Behav. 45, 194–207
(2017).
5. Gliklich, E., Guo, R. & Bergmark, R. W. Texting while driving: a study of 1211 U.S. adults with the Distracted Driving Survey. Prev.
Med. Rep. 4, 486–489 (2016).
6. Oviedo-Trespalacios, O. Getting away with texting: Behavioural adaptation of drivers engaging in visual-manual tasks while driv-
ing. Transp. Res. Part A Policy Pract. 116, 112–121 (2018).
7. Montag, C. et al. Smartphone usage in the 21st century: who is active on WhatsApp?. BMC Res. Notes 8, 331 (2015).
8. Caird, J. K., Johnston, K. A., Willness, C. R., Asbridge, M. & Steel, P. A meta-analysis of the effects of texting on driving. Accid.
Anal. Prev. 71, 311–318 (2014).
9. Ortiz, C., Ortiz-Peregrina, S., Castro, J. J., Casares-López, M. & Salas, C. Driver distraction by smartphone use (WhatsApp) in
different age groups. Accid. Anal. Prev. 117, 239–249 (2018).
10. Yannis, G., Laiou, A., Papantoniou, P. & Christoforou, C. Impact of texting on young drivers’ behavior and safety on urban and
rural roads through a simulation experiment. J. Saf. Res. 49(25), e1-31 (2014).
11. Yannis, G., Laiou, A., Papantoniou, P. & Gkartzonikas, C. Simulation of texting impact on young drivers ’ behavior and safety on
motorways. Transp. Res. Part F Psychol. Behav. 41, 10–18 (2016).
12. Becic, E. et al. Driving impairs talking. Psychon. Bull. Rev. 17, 15–21 (2010).
13. Oviedo-Trespalacios, O., Haque, M. M., King, M. & Demmel, S. Driving behaviour while self-regulating mobile phone interactions:
A human-machine system approach. Accid. Anal. Prev. 118, 253–262 (2018).
14. Choudhary, P. & Velaga, N. R. Mobile phone use during driving: Effects on speed and effectiveness of driver compensatory behav-
iour. Accid. Anal. Prev. 106, 370–378 (2017).
15. Törnros, J. E. B. & Bolling, A. K. Mobile phone use—effects of handheld and handsfree phones on driving performance. Accid.
Anal. Prev. 37, 902–909 (2005).
Scientific Reports | (2020) 10:13263 | https://doi.org/10.1038/s41598-020-70288-4 9
Vol.:(0123456789)www.nature.com/scientificreports/
16. Lewis-Evans, B. & Rothengatter, T. Task difficulty, risk, effort and comfort in a simulated driving task—Implications for Risk
Allostasis Theory. Accid. Anal. Prev. 41, 1053–1063 (2009).
17. Fuller, R., McHugh, C. & Pender, S. Task difficulty and risk in the determination of driver behaviour. Rev. Eur. Psychol. Appliquée/
European Rev. Appl. Psychol. 58, 13–21 (2008).
18. Charlton, S. G., Starkey, N. J., Perrone, J. A. & Isler, R. B. What’s the risk? A comparison of actual and perceived driving risk. Transp.
Res. Part F Traffic Psychol. Behav. 25, 50–64 (2014).
19. Oviedo-Trespalacios, O., Haque, M., King, M. & Washington, S. Effects of road infrastructure and traffic complexity in speed
adaptation behaviour of distracted drivers. Accid. Anal. Prev. 101, 67–77 (2017).
20. Fitch, G. M., Hanowski, R. J. & Guo, F. The risk of a safety-critical event associated with mobile device use in specific driving
contexts. Traffic Inj. Prev. 16, 124–132 (2015).
21. Fitch, G., Toole, L., Grove, K., Soccolich, S. & Hanowski, R. J. Investigating Drivers’ Compensatory Behavior when Using a Mobile
Device (National Surface Transportation Safety Center for Excellence (NSTSCE, VTTI), Washington, DC, 2017).
22. Ho, G., Scialfa, C. T., Caird, J. K. & Graw, T. Visual search for traffic signs: the effects of clutter, luminance, and aging. Hum. Factors
J. Hum. Factors Ergon. Soc. 43, 194–207 (2006).
23. Ortiz, C., Castro, J. J., Alarcón, A., Soler, M. & Anera, R. G. Quantifying age-related differences in visual-discrimination capacity:
drivers with and without visual impairment. Appl. Ergon. 44, 523–531 (2013).
24. Owsley, C., Sekuler, R. & Siemsen, D. Contrast sensitivity throughout adulthood. Vision Res. 23, 689–699 (1983).
25. Artal, P., Ferro, M., Miranda, I. & Navarro, R. Effects of aging in retinal image quality. J. Opt. Soc. Am. A. 10, 1656–1662 (1993).
26. Ball, K. et al. Driving avoidance and functional impairment in older drivers. Accid. Anal. Prev. 30, 313–322 (1998).
27. Fraser, M. L., Meuleners, L. B., Ng, J. Q. & Morlet, N. Driver self-regulation and depressive symptoms in cataract patients awaiting
surgery: a cross-sectional study. BMC Ophthalmol. 13, 45 (2013).
28. Pomerance, G. N. & Evans, D. W. Test-retest reliability of the CSV-1000 contrast test and its relationship to glaucoma therapy.
Investig. Ophthalmol. Vis. Sci. 35, 3357–3361 (1994).
29. Oviedo-Trespalacios, O., Haque, M., King, M. & Washington, S. Self-regulation of driving speed among distracted drivers: An
application of driver behavioral adaptation theory. Traffic Inj. Prev. 18, 599–605 (2017).
30. Huth, V., Sanchez, Y. & Brusque, C. Drivers ’ phone use at red traf fi c lights: a roadside observation study comparing calls and
visual—manual interactions. Accid. Anal. Prev. 74, 42–48 (2015).
31. Oviedo-Trespalacios, O., Haque, M. M., King, M. & Washington, S. Understanding the impacts of mobile phone distraction on
driving performance: a systematic review. Transp. Res. Part C Emerg. Technol. 72, 360–380 (2016).
32. Simmons, S. M., Hicks, A. & Caird, J. K. Safety-critical event risk associated with cell phone tasks as measured in naturalistic
driving studies: A systematic review and meta-analysis. Accid. Anal. Prev. 87, 161–169 (2016).
33. Young, R. Removing biases from crash odds ratio estimates of secondary tasks: a new analysis of the SHRP2 naturalistic driving
study data (No. 2017-01-1380). SAE Technical Paper (2017).
34. Young, K. L., Rudin-Brown, C. M., Patten, C., Ceci, R. & Lenné, M. G. Effects of phone type on driving and eye glance behaviour
while text-messaging. Saf. Sci. 68, 47–54 (2014).
35. Hosking, S. G., Young, K. L. & Regan, M. A. The effects of text messaging on young drivers. Hum. Factors 51, 582–592 (2009).
36. Stinchcombe, A., Gagnon, S., Zhang, J. J., Montembeault, P. & Bedard, M. Fluctuating attentional demand in a simulated driving
assessment: the roles of age and driving complexity. Traffic Inj. Prev. 12, 576–587 (2011).
37. Paxion, J., Galy, E. & Berthelon, C. Mental workload and driving. Front. Psychol. 5, 1344 (2014).
38. Cnossen, F., Rothengatter, T. & Meijman, T. Strategic changes in task performance in simulated car driving as an adaptive response
to task demands. Transp. Res. Part F Traffic Psychol. Behav. 3, 123–140 (2000).
39. Michaels, J. et al. Driving simulator scenarios and measures to faithfully evaluate risky driving behavior: A comparative study of
different driver age groups. PLoS ONE 12, 1–24 (2017).
40. Scott-Parker, B., Hyde, M. K., Watson, B. & King, M. J. Speeding by young novice drivers: What can personal characteristics and
psychosocial theory add to our understanding?. Accid. Anal. Prev. 50, 242–250 (2013).
41. Tractinsky, N., Ram, E. S. & Shinar, D. To call or not to call—That is the question (while driving). Accid. Anal. Prev. 56, 59–70
(2013).
42. Rhodes, N. & Pivik, K. Age and gender differences in risky driving: The roles of positive affect and risk perception. Accid. Anal.
Prev. 43, 923–931 (2011).
43. Varet, F., Granié, M.-A. & Apostolidis, T. The role of individualism, gender and situational factors on probabilities of committing
offences in a French drivers sample. Transp. Res. Part F Traffic Psychol. Behav. 56, 293–305 (2018).
44. Factor, R. An empirical analysis of the characteristics of drivers who are ticketed for traffic offences. Transp. Res. Part F Traffic
Psychol. Behav. 53, 1–13 (2018).
45. Agramunt, S. et al. Do older drivers with bilateral cataract self-regulate their driving while waiting for first eye cataract surgery?.
Clin. Interv. Aging 12, 1911–1920 (2017).
46. Li, X., Oviedo-Trespalacios, O., Rakotonirainy, A. & Yan, X. Collision risk management of cognitively distracted drivers in a car-
following situation. Transp. Res. Part F Traffic Psychol. Behav. 68, 288–298 (2019).
47. Owsley, C., Stalvey, B., Wells, J. & Sloane, M. E. Older drivers and cataract: driving habits and crash risk. J. Gerontol. Ser. A Biol.
Sci. Med. Sci. 54, M203–M211 (1999).
48. Bédard, M., Parkkari, M., Weaver, B., Riendeau, J. & Dahlquist, M. Assessment of driving performance using a simulator protocol:
Validity and reproducibility. Am. J. Occup. Ther. 64, 336–340 (2010).
49. Meuleners, L. & Fraser, M. A validation study of driving errors using a driving simulator. Transp. Res. Part F Traffic Psychol. Behav.
29, 14–21 (2015).
50. Dingus, T. A. et al. The prevalence of and crash risk associated with primarily cognitive secondary tasks. Saf. Sci. 119, 98–105
(2019).
51. Gershon, P. et al. Distracted driving, visual inattention, and crash risk among teenage drivers. Am. J. Prev. Med. 56, 494–500 (2019).
52. Dimitriou, L., Stylianou, K. & Yannis, G. Capturing the effects of texting on young drivers behaviour based on copula and Gaussian
Mixture Models. Transp. Res. Part F Traffic Psychol. Behav. 58, 930–943 (2018).
53. Choudhary, P. & Velaga, N. Performance degradation during sudden hazardous events: a comparative analysis of use of a phone
and a music player during driving. IEEE Trans. Intell. Transp. Syst. 20, 4055–4065 (2018).
54. Oviedo-Trespalacios, O., Haque, M. M., King, M. & Washington, S. “Mate! I’m running 10 min late”: an investigation into the
self-regulation of mobile phone tasks while driving. Accid. Anal. Prev. 122, 134–142 (2019).
Acknowledgements
This work was supported by the Ministry of Economy and Competitiveness (Spain) and the European Regional
Development Fund (ERDF) [FIS2017-85058-R], as well as by the Ministry of Science, Innovation and Universities
(Spain) [Grant FPU15/05571]. We also thank to Trágora SCA for translating the text into English.
Scientific Reports | (2020) 10:13263 | https://doi.org/10.1038/s41598-020-70288-4 10
Vol:.(1234567890)www.nature.com/scientificreports/
Author contributions
Conceptualization: S.O.P., O.O.T., C.O. and R.G.A.; Methology: S.O.P., O.O.T., C.O. and C.S.; Formal Analyis:
S.O.P, O.O.T., M.C.L. and C.S.; Investigation: S.O.P; C.O. and R.G.A.; Writing-Original Draft: S.O.P., O.O.T.,
M.C.L. and C.S.; Writing-Review & Editing: S.O.P., C.O. and R.G.A.; Supervision: C.O. and R.G.A.; Project
administration: R.G.A.; Funding acquisition: R.G.A.
Competing interests
The authors declare no competing interests.
Additional information
Correspondence and requests for materials should be addressed to C.O.
Reprints and permissions information is available at www.nature.com/reprints.
Publisher’s note Springer Nature remains neutral with regard to jurisdictional claims in published maps and
institutional affiliations.
Open Access This article is licensed under a Creative Commons Attribution 4.0 International
License, which permits use, sharing, adaptation, distribution and reproduction in any medium or
format, as long as you give appropriate credit to the original author(s) and the source, provide a link to the
Creative Commons license, and indicate if changes were made. The images or other third party material in this
article are included in the article’s Creative Commons license, unless indicated otherwise in a credit line to the
material. If material is not included in the article’s Creative Commons license and your intended use is not
permitted by statutory regulation or exceeds the permitted use, you will need to obtain permission directly from
the copyright holder. To view a copy of this license, visit http://creativecommons.org/licenses/by/4.0/.
© The Author(s) 2020
Scientific Reports | (2020) 10:13263 | https://doi.org/10.1038/s41598-020-70288-4 11
Vol.:(0123456789)You can also read