Field demonstration of the efficacy of cover crops to reduce nitrate leaching : 2019-20 - CPES Interreg
←
→
Page content transcription
If your browser does not render page correctly, please read the page content below
Field demonstration of the
efficacy of cover crops to
reduce nitrate leaching :
2019-20
Date/Version: November 2020
Redactor: Dr Anne Bhogal (ADAS)
Contact: anne.bhogal@adas.co.uk
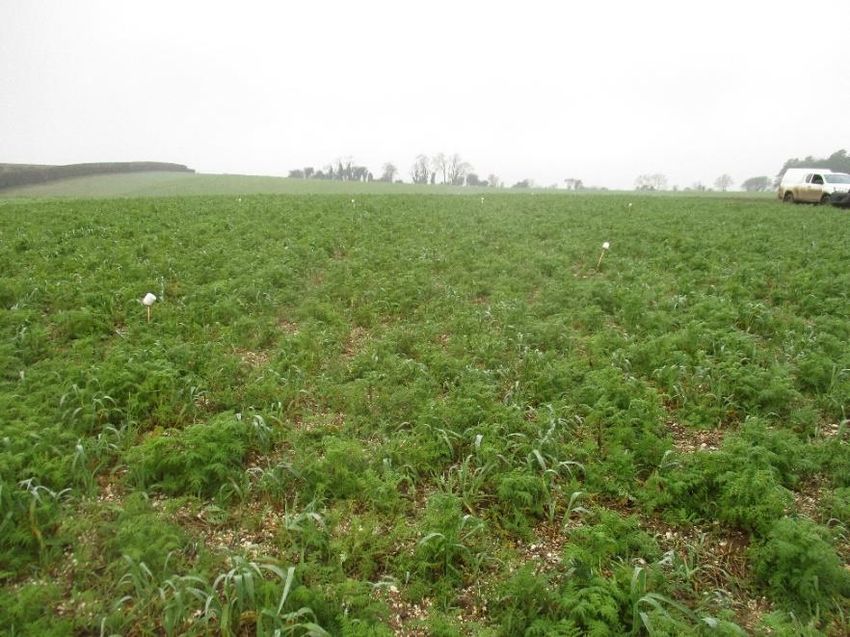
Phacelia & oat cover crop mix; December 2019
Phacelia cover crop
The INTERREG VA France (Channel) England programme is financed through
the European Regional Development Fund (ERDF).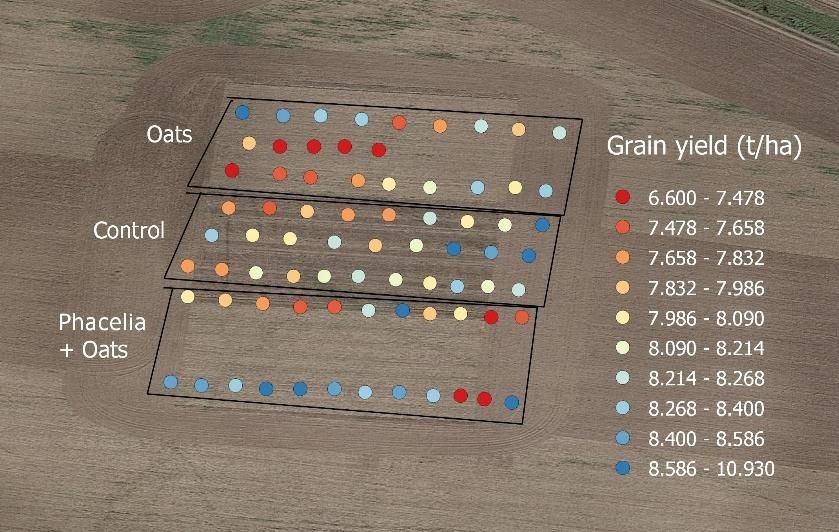
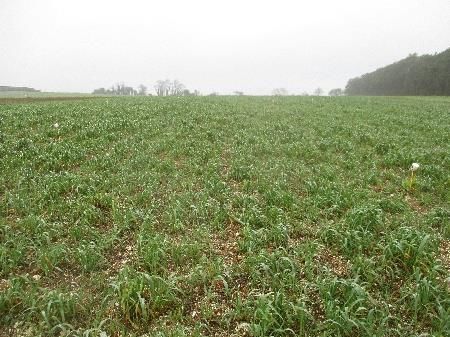
Overview
This study aims to demonstrate the feasibility of growing cover crops ahead of spring cropping as a
means of reducing over-winter nitrate leaching losses from the shallow chalk soils found across much
of Portsmouth Water’s catchment area. As well as assessing the impact on water quality, the study will
also evaluate the effect of cover cropping on subsequent spring crop yields and gross margins in order
to demonstrate the impact for the whole farm business. The work is being undertaken on a commercial
farm in Hampshire over three cropping seasons (2018-2021), with a new field selected each season
according to the host farmer’s crop rotation (i.e. a field that is scheduled for spring barley).

Cover crop treatments and assessments
Three cover crop treatments (Table 1) were drilled in August 2019 along a 100m length of a single
‘tramline’ width (36m) on a shallow silty clay loam soil over chalk (depth to chalk: c. 40cm). The cover
crop species were selected to give a ‘simple’ low cost option (oats) compared to a mix that would qualify
for an Ecological Focus Area green cover (EFAGC) payment (oats & phacelia), with both options
compared to an untreated stubble (which became a weedy stubble during the course of the winter).
The cover crops were established using a single pass of the farm ‘Bio Drill’ mounted on a ‘Top Down’
cultivator. This comprised a combination of discs working to 30mm depth, followed by a set of tines
working to 120-140mm depth, followed by a set of levelling discs after which the seed was broadcast
and finally rolled.

Table 1. Cover crop treatments
 Treatment Description
 1              Conventional practice (bare/weedy stubble)
 2              Cereal (oats) cover crop (@40 kg/ha)
 3              EFA mix: cereal (oats) and phacelia (ratio 9:1 @ 40 kg/ha)

Soil samples were taken to 40cm depth in October 2019 to measure soil mineral nitrogen (ammonium-
N & nitrate-N: SMN) content and porous ceramic water samplers were installed to c.40cm depth (12
per tramline) to measure nitrate concentrations in drainage water (sampled every 2 weeks or after
25mm drainage). The measured concentrations were combined with drainage volumes estimated using
the IRRIGUIDE model to calculate over winter nitrate leaching losses. SMN was also measured in
January 2020 prior to cover crop destruction, and combined with measurements of cover crop nitrogen
(N) uptake to quantify the soil nitrogen supply (SNS) to the following spring barley crop.

Winter 2019-20 results
Both the oat and phacelia/oat cover crops established well and produced c.40% and c.70% cover,
respectively by January 2020, compared to the control treatment where weeds/volunteer cereals
produced a cover of c.30% (Plate 1). By January 2020, the phacelia/oat mix had produced c.1.6 t/ha
dry matter and taken up c.43 kg/ha nitrogen compared to 1.0 t/ha dry matter and 37 kg/ha uptake by
the oat cover crop, and
a)                                     b)                                     c)

Plate 1. Treatment tramlines in January 2020: a) Oats; b) Weedy stubble; c) Phacelia & oats

Nitrate leaching losses winter 2019-20
Winter 2019-20 was characterised by exceptionally high rainfall, with a total of 854 mm falling between
September and March (compared to 520 mm recorded over a similar period on farm over winter 2018-
19 and a 30 year average for this period taken from the Met office station at Thorney Island of 469mm).
This led to c.500 mm drainage (estimated using the Irriguide model), compared to c.300 mm over
winter 2018-19. The phacelia/oat cover crop was very effective at reducing nitrate leaching losses, with
just 3 kg/ha N lost by leaching and an average (flow-weighted) nitrate-nitrogen (NO3-N) concentration
in the drainage water of 0.6 mg NO3-N/l (Figures 1 & 2). Nitrate leaching losses from the oat cover
crop were c.12 kg/ha with an average concentration of 2.4 mg NO3-N/l, and the control (no/low ground
cover) c.25 kg NO3-N /ha, with an average concentration of 5.1 mg NO 3-N/l in the drainage waters.
There was some evidence of increased nitrate-N concentrations in the drainage after cover crop
destruction on 30/1/20 (Figure 2), but throughout the winter drainage season all nitrate-N
concentrations were below the EU limit of 11.3 mg NO 3-N/l.

Figure 1. Nitrate leaching losses October 2019-February 2020 (854 mm rainfall; 500 mm drainage).

                                The INTERREG VA France (Channel) England programme is
                                financed through the European Regional Development Fund (ERDF).    Page 3 | 6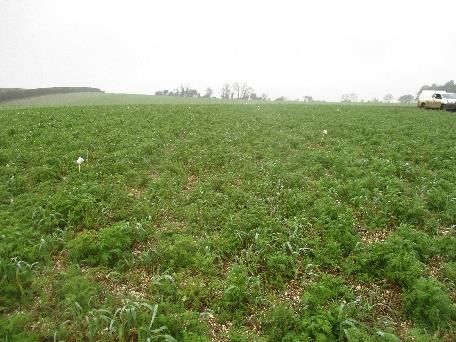
Figure 2. Nitrate concentration of the drainage waters and rainfall October 2019-March 2020 (cover crop
destroyed 30/1/20)

Retention of N by the cover crops resulted in more nitrogen potentially available for the following spring
barley crop (compared to the control). Soil N supply (SNS = cover crop N + soil mineral N) was c.55-
60kg/ha on the cover crop treatments, compared to c.35 kg/ha on the control (Figure 3). However,
these differences were not considered to be sufficient to warrant a change in N fertiliser policy for the
following spring barley crop. This is in contrast to the demonstration carried out in 2018-2019, where
SNS following the phacelia cover crop mix was 75 kg/ha and fertiliser applications following this cover
crop were reduced by 30 kg/ha.

Figure 3. Nitrogen present in the soil, crop and lost by spring 2020 (c. 25-30 kg/ha was present in the soil in
autumn 2019); SNS = soil nitrogen supply (potentially available for use by the following spring barley crop).

                                 The INTERREG VA France (Channel) England programme is
                                 financed through the European Regional Development Fund (ERDF).            Page 4 | 6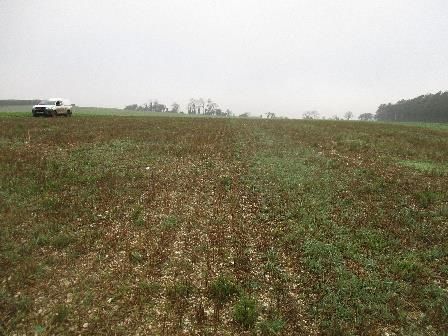
Spring barley grain yields and nitrogen content

The spring barley was harvested in early August (8/8/20) using a yield mapping combine (Figure 4).
There was no apparent difference in yield as a result of the cover crop treatments, with yields ranging
from 7.9 ± 0.2 t/ha following the oat cover crop to 8.2 ± 0.4 t/ha following the phacelia cover crop and
an overall average for the experimental area of 8.1 t/ha (Table 2). Grain nitrogen content and nitrogen
offtake were higher following the cover crops, although in the absence of replication it is not possible
to determine if these results are statistically significant.

Table 2. Spring barley yield and grain nitrogen content (2020); 95% confidence limits in brackets
 Treatment                                  Mean yield                Grain N (%)              Grain N offtake
                                       (t/ha @ 85% dm)                                            (kg/ha)
 1. Control (stubble)                     8.25 (± 0.11)                   1.70                       117
 2. Oats                                  7.91 (± 0.19)                   1.86                       125
 3. Phacelia/Oats mix                     8.16 (± 0.37)                   1.89                       131
Number of yield records = 29 on the control and 23 each on the cover crop treatments; single sample analysed for grain N.

Figure 4. Spring barley yield map, August 2020

Cost/Benefit analysis

A simple cost-benefit assessment was produced for each of the treatments, based on the various
operations and inputs performed by the host farmer and using costs/prices that the farmer incurred
(Table 3). As there was no apparent difference in grain yield, the experimental area average of 8.1 t/ha
was used in the analysis. In contrast to 2018-19 there was no saving in N fertiliser as a result of the
cover crop treatments, so gross margins were higher on the control treatment due to the absence of
costs associated with purchase of the cover crop seed. This together with the additional operational
costs associated with establishing the cover crop resulted in net margins £80-£90/ha lower for the cover
crop treatments. The phacelia and oat cover crop mix would, however, qualify for a ‘Greening Payment’
as an ‘Ecological Focus Area – EFA’ under the Basic Payment Scheme. To count as an EFA, farmers can
grow a cover crop mix comprising of at least one cereal (oats, rye or barley) and one non-cereal (vetch,
phacelia, mustard, Lucerne or oilseed radish), established by 1st October and retained until 15th January.
The value of the greening payment depends on the payment region and application year; in 2019 this
was €78.69/ha (c. £70/ha). Applying this would have reduced the loss in margin associated with
growing the phacelia/oat cover crop mix, to c.£20/ha. Greening payments will end in England next
year, as the agricultural transition commences and the country moves towards the new Environmental
Land Management Scheme - ELMS (expected to start in 2024). An alternative means of recuperating
the cost of establishing a cover crop could be to enter the land into Countryside Stewardship (option
SW6 'winter cover crops’ – which currently pays £114/ha).

                                   The INTERREG VA France (Channel) England programme is
                                   financed through the European Regional Development Fund (ERDF).               Page 5 | 6
Table 3 Cost/benefit of the different cover crop options
 Treatment                                Stubble           Oats                  Phacelia/Oats
 Yield (t/Ha)                            8.1                8.1                   8.1
 Price (£/t)                             142                142                   142
 OUTPUT (£/Ha)                           1150               1150                  1150
 Cover crop seed                                            8                     19
 Barley Seed                             8                  85                    85
 Fertiliser - N                          130                130                   130
 Sprays                                  128                128                   128
 Total variable costs                    343                351                   362
 GROSS MARGIN (£/Ha)                     807                799                   788
 FIELD OPERATIONAL COSTS (£/ha)
 Cultivate & drill covers                                   50                    50
 Rolls (x1)                                                 20                    20
 Barley cultivate & drill                50                 50                    50
 Fertiliser (x2)                         20                 20                    20
 Cover crop/weed sprayer (x1)            10                 10                    10
 Barley sprays (x4)                      40                 40                    40
 Combining                               90                 90                    90
 Total Operational Costs (£/ha)          210                280                   280
 NET MARGIN (£/Ha)                       597                519                   508

Conclusions – year 2
The residual soil mineral N levels were considerably lower post-harvest ahead of the winter 2019/20
drainage season (< 30kg/ha SMN to 40cm, compared to 80-110 kg/ha SMN to 60cm in 2018). Over-
winter nitrate leaching losses were consequently lower than measured the previous year (maximum
loss of 25 kg/ha, compared to 60 kg/ha in 2018/19), despite higher rainfall and drainage volumes.
However, in both seasons, the phacelia/oat cover crop mix was very effective at reducing nitrate
leaching losses to negligible levels (80-90% reduction in N losses across both seasons), with a clear
relationship becoming apparent between the percentage crop cover and nitrate loss.

There was also no detrimental effect of growing the cover crop on the yield of the spring barley, but
net margins were c. £80-90/ha lower compared to growing no cover crop. The reduced margin
reflected the cost of establishing the cover crop, with the differences in soil N supply not sufficient to
justify adjusting N fertiliser rates. Applying for the BPS EFA greening payment would have reduced
the costs of the phacelia treatment, but this payment will not be available from 2021 due to the
transition towards the new ELMS in England.

                                The INTERREG VA France (Channel) England programme is
                                financed through the European Regional Development Fund (ERDF).   Page 6 | 6
You can also read