FOOD WASTE DIGESTION Anaerobic Digestion of Food Waste for a Circular Economy - IEA Bioenergy Task 37
←
→
Page content transcription
If your browser does not render page correctly, please read the page content below
FOOD WASTE DIGESTION
                                    Anaerobic Digestion of Food Waste
                                    for a Circular Economy

IEA Bioenergy Task 37
IEA Bioenergy: Task 37: 2018 : 12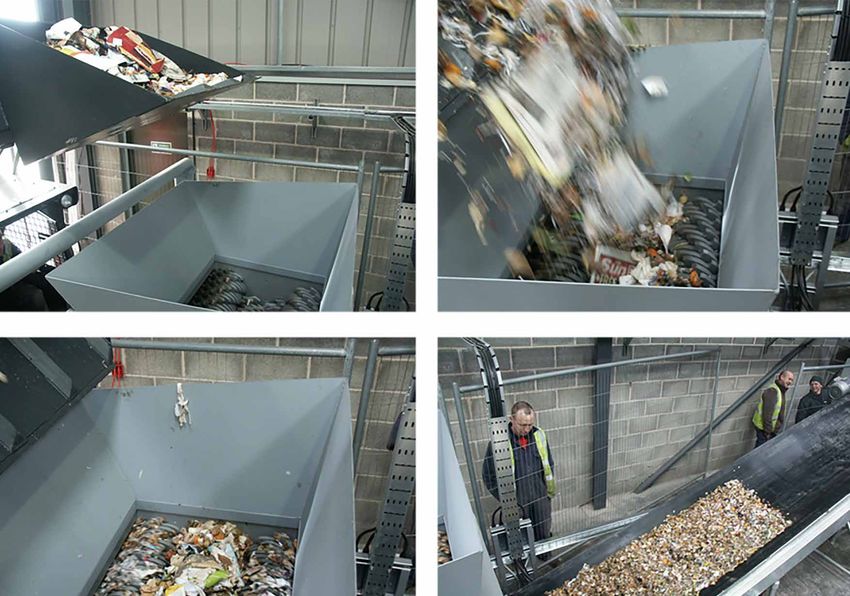
Food Waste Digestion                                Title page

Food Waste Digestion
Anaerobic Digestion of Food Waste for a Circular Economy

Charles Banks, Sonia Heaven, Yue Zhang (Faculty of Engineering and Physical Sciences, University of Southampton, UK)
Urs Baier (Life Sciences and Facility Management, Zurich University of Applied Sciences, Switzerland)

REVIEWED BY
Bernhard Drosg (Institute for Environmental Biotechnology, BOKU – University of Natural Resources and Life Science, Austria)

EDITED BY
Jerry D. Murphy (MaREI Centre, University College Cork, Ireland)

CITATION
Banks, C.J., Heaven, S., Zhang, Y., Baier, U. (2018). Food waste digestion: Anaerobic Digestion of Food Waste for a
Circular Economy. Murphy, J.D. (Ed.) IEA Bioenergy Task 37, 2018: 12
ISBN: 978-1-910154-58-8 (eBook electronic edition), 978-1-910154-57-1 (printed paper edition)

Copyright © 2018 IEA Bioenergy. All rights Reserved
ISBN: 978-1-910154-57-1 (printed paper edition)
ISBN: 978-1-910154-58-8 (eBook electronic edition)

Cover photo: © Urs Baier

                    Published by IEA Bioenergy
                    IEA Bioenergy, also known as the Technology Collaboration Programme (TCP) for a Programme of Research, Development and Demonstration on
                    Bioenergy, functions within a Framework created by the International Energy Agency (IEA). Views, findings and publications of IEA Bioenergy do
                    not necessarily represent the views or policies of the IEA Secretariat or of its individual Member countries.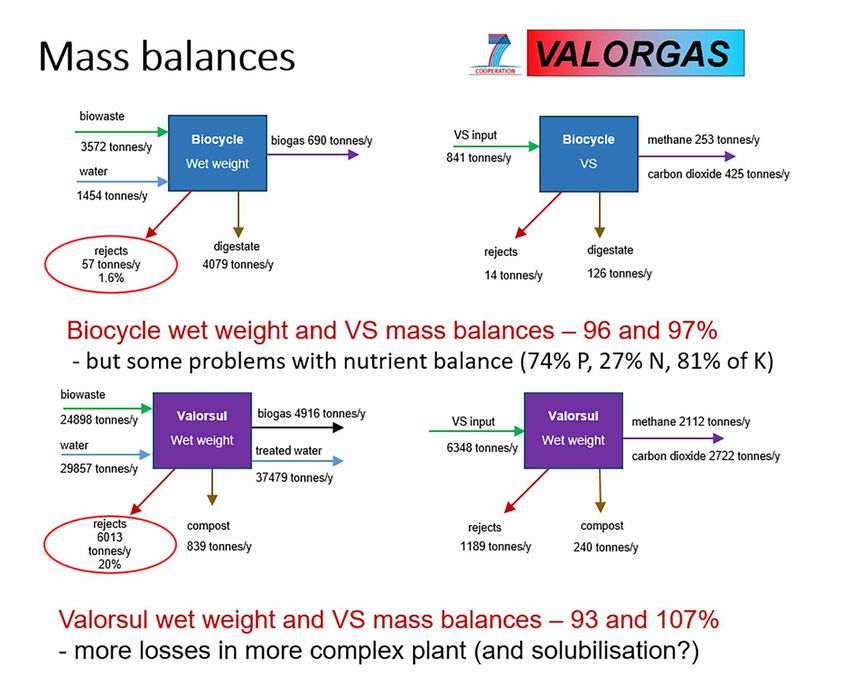
Table of contents                                              Food Waste Digestion

Table of contents
1. Food Waste as a Global Challenge                                  5
   1.1. Definition of Food Waste                                     5
   1.2. Food Waste Quantities                                        6
   1.3. Food Waste Hierarchy                                         7

2. Source Separated Municipal Food Waste                             8
   2.1. Economic Drivers & Sustainability of Collection Systems      8
   2.2. Characteristics & Composition                                9
   2.3. Handling & Preatreatment                                    13

3. Anaerobic Digestion Systems                                     16
   3.1. Historical Issues in Mono-Digestion of Food Waste           16
   3.2. Estimation the Energy Potential of Food Waste Digestion     17
   3.3. Co-Digestion                                                22
   3.4. Food Waste Digesition and the Circular Economy              23

4. Case Studies                                                    26
   4.1. Australia                                                   26
   4.2. Canada                                                      26
   4.3. China                                                       27
   4.4. Indonesia                                                   28
   4.5. Japan                                                       28
   4.6. Malaysia                                                    29
   4.7. Singapore                                                   29
   4.8. South Korea                                                 29
   4.9. Thailand                                                    30
   4.10. United Kingdom                                             30
   4.11. Vietnam                                                    31

5. Conclusions                                                     32
6. References                                                      33
4

     Food Waste Digestion                          Executive summary

    Executive summary
        There is increasing awareness of the quantities of food       made it possible to identify a solution; this was to promote
    that are lost every year across the globe; while the quality of   alternative metabolic pathways to methane production that
    available data varies, estimates suggest the total is around      are mediated by more ammonia-tolerant species. This pro-
    1.3 billion tonnes. These losses occur at all stages of produc-   cess requires some trace elements that are normally only
    tion, from pre-harvest on the farm through to post-harvest        present in low concentrations in human food and must
    losses during processing, distribution, retailing and con-        therefore be supplemented for stable food waste digestion.
    sumption. This report considers only those harvested food              Food waste digestion is now commonly undertaken
    materials that are never consumed, but ultimately find their      commercially at a large scale. It is most widespread in the
    way into the waste stream.                                        UK, where there are currently 94 digesters producing over
        By far the largest proportion of this material is generated   220 MWe of power from food processing residues, super-
    at the point of consumption, in the home or in cafeterias,        market wastes and kerbside collected source-separated
    canteens and restaurants. Some of this waste is avoidable,        domestic food waste. These processes are efficient, with as
    but a proportion is unavoidable as it consists of parts of the    much as 85% of the degradable material being turned into
    product that are not edible (such as shells, bones and peels).    biogas, and a similar percentage conversion of the calo-
    Better understanding of the origins and fates of unconsumed       rific value of the food waste into a usable energy product.
    food has led to the development of food waste hierarchies         A second benefit of the digestion process is that it allows
    where prevention is the first objective, and only material        the return of plant nutrients to farms, since the digestate
    that is unfit for human or animal consumption becomes             can be applied as a nitrogen-rich fertiliser product without
    waste. Where food wastes are generated, however, the first        risk to animal health or the environment when the produc-
    option to consider is anaerobic digestion or industrial use       tion process is properly controlled and regulated. Although
    in biorefineries as these offer the greatest opportunities for    the main policy aim should be to minimise avoidable food
    both resource and energy recovery.                                waste, the unavoidable fraction can now be successfully re-
        The proportion of food entering the waste stream re-          covered through the anaerobic digestion process as a single
    flects socio-economic and other factors. It is still only poor-   feedstock or can be used in co-digestion schemes to maxim-
    ly quantified, but where good quality data exist anything         ise the overall potential for recovery of energy and nutrients
    from 25 to 65 % of the municipal waste stream may be com-         from manures and wastewater bio-solids. Food waste diges-
    prised of food materials, depending on geographical region.       tion has only emerged relatively recently at a commercial
    In Europe this equates to approximately 173 kg per person         scale, but case histories for different countries show there is
    per year. Although the appearance of food waste may differ        now global interest in taking this technology forward. This
    depending on its origin, due to local food preferences and        report outlines case studies from eleven countries, namely;
    habits, in biochemical terms it is generally very similar. It     Australia, Canada, China, Indonesia, Japan, Malaysia, Sin-
    shows roughly the same distribution of proteins, fats, carbo-     gapore, South Korea, Thailand, the United Kingdom and
    hydrates and essential elements, is easily biodegradable and      Vietnam.
    has a high biochemical methane potential (BMP). Despite
    these apparently ideal properties, the first food waste diges-
    tion systems showed signs of severe inhibition after some
    months of operation. This was caused by the build-up of
    ammonia, which reached concentrations that are inhibitory
    to some groups of methane-producing microorganisms.
    Improvements in our understanding of the complex inter-
    actions between acid-producing bacteria and methanogens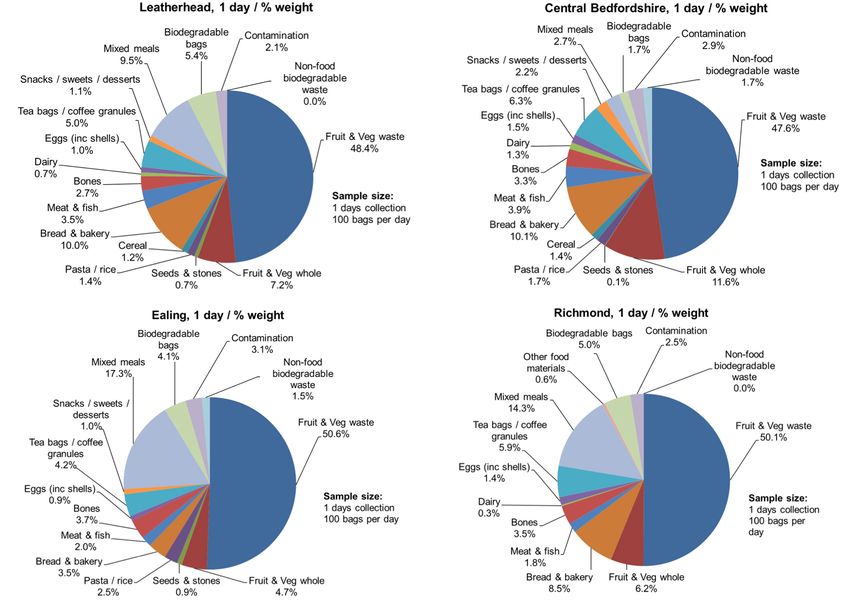
5
Food Waste as a Global Challenge Food Waste Digestion
1. Food Waste as a Global Challenge
1.1 Definition of Food Waste of primary production losses’ (EU Parliament, 2017). There
There is no universally accepted definition of ‘food is still, however, a lack of consensus on terminology and
waste’, although it is now becoming widely accepted that any definitions, and a critical appraisal of these is given in a JRC
definition should include food that is lost in the primary technical report (2017). It is therefore unsurprising that es-
production phase (including farming, fishing and aquacul- timates of the amount of FLW vary considerably depending
ture). This includes food crops that are: not harvested and both on how it is defined, and on the methodology used to
ploughed in; harvested and exported not for food use but quantify it.
to another market (e.g. sent for composting, digestion or In 2010 Parfitt et al. (2010) commented that there was a
ethanol production); harvested and then disposed of (e.g. lack of information on food waste composition worldwide.
incinerated, landfilled, sent to sewer or disposed of to sea). Based on a more recent publication by Xue et al. (2017), this
Food waste also includes all material that enters the food statement still stands: from the 202 publications examined,
supply chain but is not consumed, i.e. both edible and ined- which reported food losses and food waste data for 84
ible materials which may be generated in food processing, countries and 52 individual years from 1933 to 2014, the
marketing and preparation, and also post-preparation food authors found that most existing studies were conducted
that is not eaten. These categories are now reflected in the in a small number of industrialised countries mainly in
definition for food loss and waste (FLW) recommended by Europe and North America. Over half of the estimates
the European parliament to the Commission and Member were based only on secondary data, indicating high levels
States. This states: ‘food waste means food intended for hu- of uncertainty in the existing global FLW database. This
man consumption, either in edible or inedible status, removed led to the conclusion that more consistent, in-depth studies
from the production or supply chain to be discarded, including based on primary data, especially for emerging economies,
at primary production, processing, manufacturing, transpor- were urgently needed to better inform policy-making on
tation, storage, retail and consumer levels, with the exception reduction of FLW and mitigation of its environmental
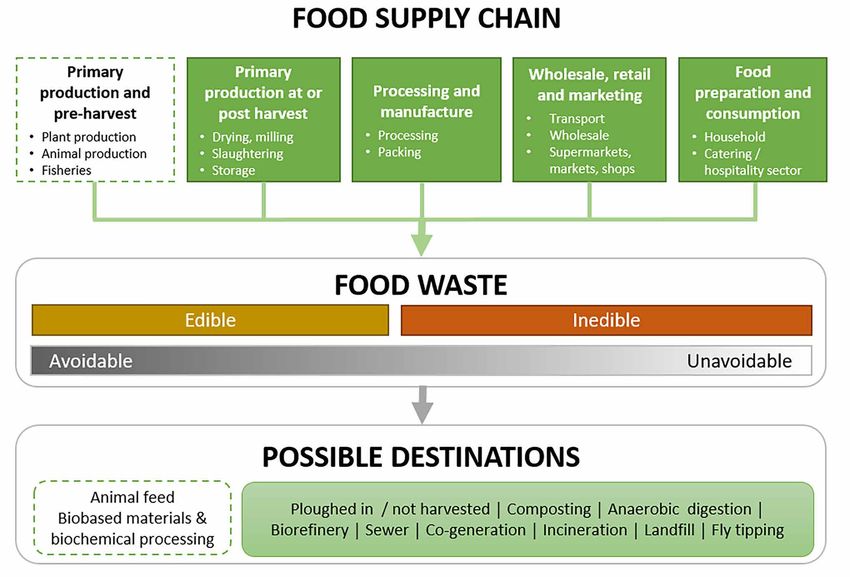
Figure 1: Framework defining the food supply chain and food waste destinations (based on JRC, 2017)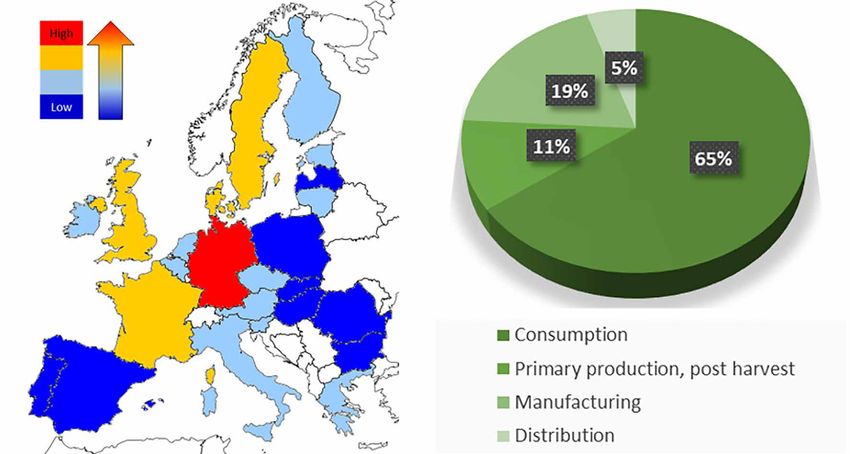
6

     Food Waste Digestion                               Food Waste as a Global Challenge

    impacts. To meet the requirement for better and more                    1.2 Food Waste Quantities
    uniform data, a multi-stakeholder partnership (WRI, FAO,                    Globally the Food and Agriculture Organisation of
    WRAP, UNEP, and WDCSD) developed the ‘Food Loss and                     the United Nations (FAO) has estimated that one-third of
    Waste Accounting and Reporting Standard’ (FLW Standard),                food produced for human consumption is lost or wasted,
    which was published in June 2016 (Hanson et al., 2016). The             equivalent to about 1.3 billion tonnes per year. Although
    standard is intended to enable countries, cities, companies             this number is widely quoted, there is insufficient data from
    and other entities to develop consistent inventories of FLW             many countries to allow accurate quantification.
    generated and its destination (Figure 1) (JRC, 2017).                       The proportion of municipal solid waste (MSW) that
        The adopted European definition for food waste used                 is made up of food waste varies quite widely: according to
    above is wider than the scope of this report, which excludes            the Intergovernmental Panel on Climate Change (IPCC)
    food losses on farms. This report is primarily concerned                regional classification, the range is from about 23% in
    with the post-farm food chain. This is the largest fraction,            southern Africa and northern Europe, to 67.5% in Oceania
    which represents around 90% of FLW and includes: waste                  excluding Australia and New Zealand (IPCC, 2006). The
    from food production, by-products or co-products; food                  original data used is from around 2000, however, and is
    in the food supply chain that no longer has value through               calculated from national composition data which as already
    spoilage or sell-by date expiry; trimmings, peelings and                noted is often incomplete or unreliable.
    scraps arising from the making of meals in food outlets and                 Even in Europe, where most work has been carried
    at home; uneaten leftovers; and spoiled food as a result of             out, there is still uncertainty about the accuracy of data re-
    over-buying.                                                            ported by many of the member states (Figure 2). The EU

    Figure 2: Left – Quality of available data on Food Loss and Waste (FLW) in EU (based on FUSIONS, 2016a). Right – Proportion of FLW in
    different categories (based on JRC, 2017)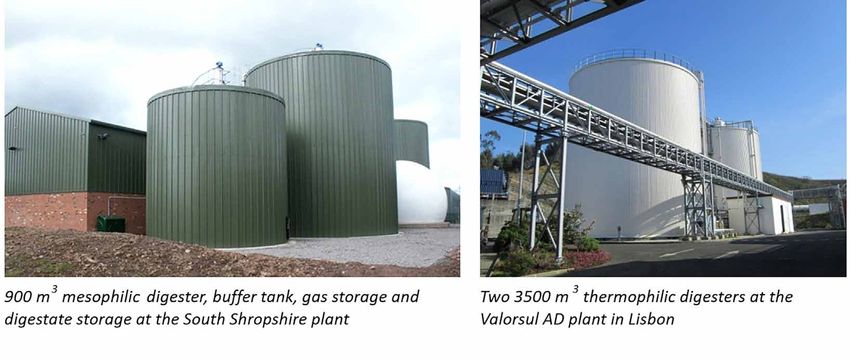
7

    Food Waste as a Global Challenge                                                          Food Waste Digestion

FUSIONS project (Food Use for Social Innovation by                         Interest in food waste prevention is reflected in the
Optimising Waste Prevention Strategies, www.eu-fusions.                growing number of studies since 2000, which highlight
org) which ran between 2012-2016 built upon earlier studies.           the economic significance of wastage. This is providing an
The outputs of this project together with the JRC report               impetus for change, which is reflected in the promotion of
(2017) provide the best interpretation of currently available          food waste hierarchies by a number of countries in Europe,
data across Europe, with food waste generation estimated at            North America and worldwide. Considerable effort is
173 kg person-1 year -1.                                               now going into the identification and quantification of
                                                                       food waste in relation to these emerging hierarchies,
1.3 Food Waste Hierarchy                                               with prevention and alternative use as animal feed as the
    By far the largest proportion of food waste is from                preferred options.
household consumption. It is now well recognised that                      Figure 3 shows schematics from the UK and USA; other
household food waste components can be categorised                     examples include Australia (Australian Government, 2017),
as unavoidable or avoidable, with an additional category               Ontario (Sustain Ontario, 2016) Hong Kong (Environment
of possibly or partly avoidable being used in some cases.              Bureau, 2014). While there is a degree of consensus between
The first category of unavoidable or inedible food waste               the many available versions, there are also differences, for
generally consists of residues and by-products from food               example in distinguishing between aerobic composting and
preparation, such as inedible peels or seeds. Avoidable food           anaerobic digestion (AD) at different scales of operation,
waste consists either of: unused food, often discarded due to          or in classifying AD as either a resource recovery technol-
excess purchasing and/or the passing of a ‘best before’ date;          ogy or a less preferred energy recovery option (Zero Waste
or of part-consumed items such as left-overs from meals.               Europe, 2016; Australian Government, 2017). Where there
The possibly or partly avoidable category has been defined as          are significant quantities of unavoidable and inedible food
“food and drink that some people eat and others do not (e.g.           wastes, then anaerobic digestion (AD), which offers both
bread crusts), or that can be eaten when a food is prepared in         material and energy recovery, should generally be the first
one way but not in another (e.g. potato skins)” (WRAP, 2009).          preference for this material within the hierarchy.

Figure 3: Examples of Food Waste Hierarchy. Left – based on WRAP (2017), Right – based on US EPA (ND)
8

     Food Waste Digestion                        Source Separated Municipal Food Waste

    2. Source Separated Municipal Food Waste
    2.1 Economic Drivers & Sustainability of Collection             may contribute to confusion and poor performance on the
    Systems                                                         part of participants.
         Major studies on food waste collection schemes have             From the viewpoint of renewable energy production
    been carried out by the UK’s Waste and Resources Ac-            through anaerobic digestion of food waste, with beneficial
    tion Programme (WRAP) and on behalf of the Australian           use of the digestate, the most important features of the
    Government, in both cases leading to best practice recom-       collection system appear to be what it accepts, and what
    mendations (Hyder Consulting, 2012; WRAP, 2016). IEA            type of container is used for collection (large or small). FW-
    Bioenergy Task 37 has also produced a Technical Brochure        only collections using small containers tend to have a very
    on source separation of the digestible fraction of municipal    low degree of contamination, which can minimise pre- and
    waste as a feedstock for AD, which covers collection sys-       post-processing requirements and their associated energy
    tems, set-up and economics and includes case studies of         demands. Collection systems that minimise contamination
    successful schemes in Korea, Sweden and the UK (Al Seadi        may allow even a simple AD plant to produce a high quality
    et al., 2013).                                                  digestate output (VALORGAS. 2012a).
         The FP7 VALORGAS project reviewed a number of food              Extensive work has also been carried out on what are
    waste collection schemes in Europe, including for Flintshire    often described as human factors in the performance of food
    (UK), Malmö (Sweden), Bilund (Denmark), Landshut                waste collection schemes. A study of a collection scheme in
    (Germany), Forssa (Finland), Vicenza (Italy) and Lisbon         high-density urban housing in Shanghai identified a number
    (Portugal). These locations were chosen to cover a range of     of key factors for success, including a 'personal' approach
    collection types, and to reflect the broad issues encountered   based on volunteers (Xu et al., 2016a). This contrasted with
    in the schemes investigated. The work considered fuel           information-only campaigns, which have shown relatively
    consumption and other factors as a basis for assessing the      limited success (Bernstad et al., 2013; Dai et al., 2016).
    energy footprint of the collection schemes and looked           One key requirement for a successful study is to combine
    at development of modelling and LCA tools specifically          qualitative information on participants' opinions with
    for assessment of waste collection systems (Gredmaier et        quantitative data from analysis of the waste collection itself.
    al., 2013). A web-based survey of source-separated food         This approach allows comparison of users' perceptions with
    waste collection schemes in 27 European countries was           the actual performance of a scheme. Without this, there are
    also conducted, assessing factors that might influence          potential issues of data reliability as self-reported behaviour
    yield, capture rates and efficiency (Heaven et al., 2012). It   and statements of preference are often influenced by a desire
    was concluded that food waste only (FW-only) collection         to 'say the right thing' or create favourable impressions (Xu
    schemes were not yet widespread in Europe, but their            et al., 2016; Bernstad et al., 2013).
    numbers were growing rapidly, especially in countries that           There has been continuing debate about disposal of
    had only recently introduced source-separated collection of     household food wastes in sink grinders for discharge to
    other recyclables. Schemes to collect household biowastes       the sewer system and processing at wastewater treatment
    (composed of food waste, garden wastes and some types           plants. A UK-based study by Iacouvidou et al. (2012) sug-
    of paper and card) were more common. In many cases,             gested there could be benefits if this approach is adopted at
    however, the operating conditions meant that these were         a large enough scale, but it could lead to increased costs if
    effectively the same as FW-only schemes; this was due to        uptake is limited. A study by Bernstad and la Cour Jansen
    the definition of acceptable materials, or to the fact that     (2012) compared four different systems based on collec-
    the schemes served urban areas where the majority of            tion of source-separated food waste in paper bags (with and
    inhabitants lived in apartments without gardens and thus        without pre-drying at 18-25 °C in a drying facility before
    did not generate garden wastes. The study found widespread      collection), vacuum transport from the kitchen sink to a
    inconsistencies between schemes with respect to which           central grinder before collection by tanker, and individual
    materials were accepted, however, and suggested that this       sink grinders with tanker collection of solids and disposal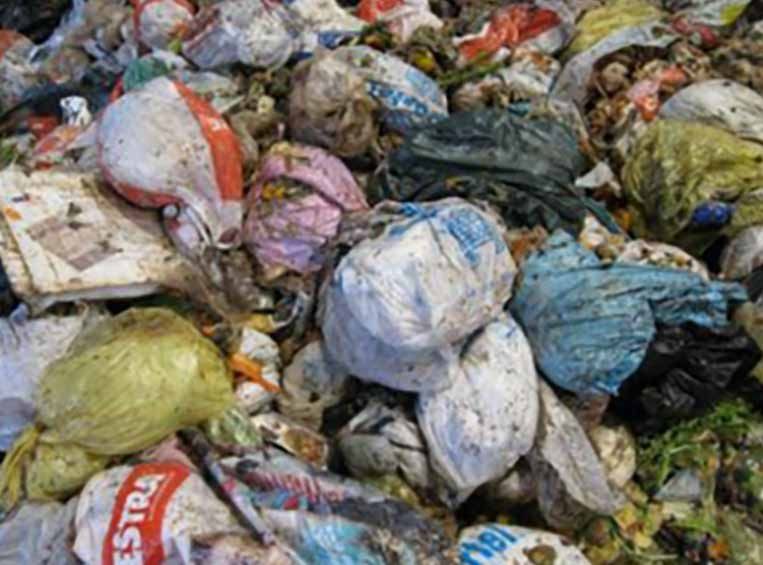
9

     Source Separated Municipal Food Waste                                                    Food Waste Digestion

of supernatant to sewer. Vacuum systems and collection of            freely available for download from http://www.bioenergy.
pre-dried waste appeared to have several advantages from             soton.ac.uk/WasteCAT_tool.htm.
the viewpoint of life cycle assessment but have not been tri-
alled at large scale.                                                2.2 Characteristics & Composition
    Work has also been carried out on modelling of the                    Food waste can differ significantly in visual appear-
energy footprint of food waste collection systems, both alone        ance, even for materials collected from similar sources in
and as an integrated part of the municipal waste collection.         close proximity. Taking source separated domestic food
Edwards et al. (2016) developed an energy and time model             wastes as an example, households may have differing age
for kerbside waste collection, which was verified and used           distributions, family sizes and cooking and eating habits, so
to model a set of scenarios for introduction of source-              it is not surprising their food waste differs. Coupling these
separated food waste collections. The results suggested an           variations with possible differences in attitudes towards
increase of up to 60% in fuel consumption depending on               how their wastes are managed and in purchasing habits, it
the collection system adopted. Chu et al. (2015) developed           is quite likely that even within a single street or a apartment
the WasteCAT scoping tool for assessment of energy and               block the composition and weight of waste collected from
resource use in source separated collection of municipal             each household will be very different. Visual differences in
waste as part of the FP7 VALORGAS project: the model is              food waste are even more apparent as geographical separa-

Figure 4: Food waste composition from four UK collection schemes based on a one-day sample (VALORGAS, 2011)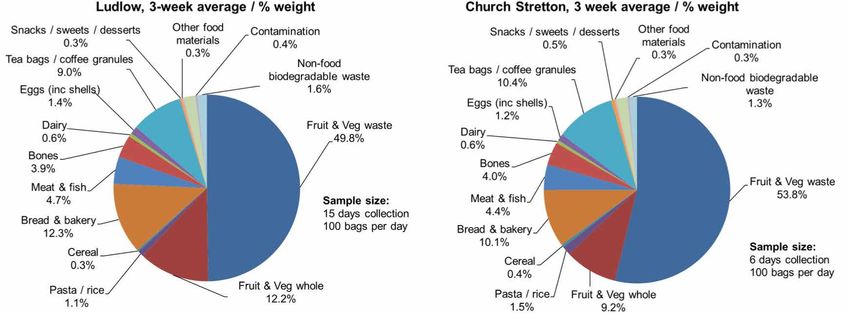
10

      Food Waste Digestion                            Source Separated Municipal Food Waste

     tion increases, and are strongly influenced by differences in        is needed. In the original work carried out in the UK by
     cuisine, local availability of produce, and economic wealth          the Waste and Resources Action Programme (WRAP, 2008;
     of the region. The latter also influences the quantity of waste      WRAP, 2009) household food waste was characterised into
     produced, with industrialised countries typically generating         174 specific types and grouped into 13 major categories.
     more waste per capita than those in economic development.            Results of extensive analyses carried out for the UK at a
         Collection of reliable data for a geographical region            national level are available from WRAP (2009). Guidance
     therefore requires a well-designed sampling programme                on waste compositional analysis and its scale-up into food
     to ensure that a representative part of the population is            waste reporting is also available in FUSIONS (2016b).
     included, that samples are taken over a period of time to                A study was undertaken to characterise UK food waste
     reflect any seasonal differences, and that the categorisation        collected from source-separated material destined for biogas
     of components used is functional, easily transferable and            production (VALORGAS, 2011). This evaluated a number
     helpful in developing a food waste management strategy. If           of schemes with weekly collections in which householders
     the FLW Standard (Hanson et al., 2016) is widely adopted,            were provided with biodegradable bags, a small kitchen
     future data should be more consistent and useful. Data               caddy and a larger bin to be left at the kerbside. The samples
     collected and presented prior to the development of this             in Figure 4 were collected on a single day, and showed some
     standard is still valuable, however, and forms the basis for         variability, while those across a 3-week period (Figure 5)
     much of the work currently presented.                                appeared slightly more consistent. Relatively little variation
                                                                          was observed in studies carried out in different seasons
     Compositional analysis                                               (VALORGAS, 2012a).
         Food waste characterisation is most frequently carried               Even the most rigorous methodologies may face com-
     out by compositional analysis, which involves sorting                plications as a result of the condition or state of the food
     and itemising items by type. A number of different                   waste sample: for example if the material has been stored
     methodologies and categorisation systems have been used,             for some time in warm conditions biodegradation will have
     including the well-established MODECOM (ADEME,                       begun, making separation of items and accurate weighing
     1997) which was developed for mixed residual waste streams           of the fractions more difficult. Similarly, a high proportion
     and contains a relatively broad set of categories. To support        of liquid or semi-liquid components will affect both sort-
     the food waste hierarchy, however, a more refined analysis           ing and weight (FUSIONS, 2016b); this may be a particular

     Figure 5: Food waste composition from two UK collection schemes based on average of 3 weeks' sampling (VALORGAS, 2011)
11
Source Separated Municipal Food Waste Food Waste Digestion
problem in regions such as south and south east Asia where the world is difficult since as noted above there are many
catering and household food wastes often have a much high- variables associated with collection, sample size, analytical
er water content than in Europe. methodologies used and reporting of data. This uncertainty
In addition to providing insights on the nature of food has led to considerable debate over the degree of variability
wastes and on potential strategies for reduction, another in food waste composition from different locations and
reason for carrying out compositional analysis is to generate regions. A meta-study based on statistical analysis of
consistent recipes for simulated food wastes for research 70 papers containing food waste characterisation data
and experimental purposes. The scale of operation and the reported high variability between samples and estimated
amounts collected mean that day-to-day variability in food that 24% of this was attributable to the geographical origin
waste from households is insignificant for a commercial of the material (Fisgativa et al., 2016). The analysis covered
plant but could seriously affect pilot and laboratory-scale a wide range of types of food waste, however, including
trials that use only a few grams or kilograms a day. One restaurant food waste, household food waste, FW mixed
option is to homogenise a large-scale representative sample, with green waste, FW of large producers and organic
but another is to characterise the ingredients and then fractions of municipal solid waste (OFMSW). In practice,
manufacture smaller quantities when needed. This also there were some significant differences between OFMSW
allows experimenters to vary the proportions of different and food waste collected with green waste on the one
components in order to observe the effect of any changes hand, and restaurant, household and large producer food
in composition on pre-treatment or digestion processes on the other; but the available data shows little difference
(Alibardi and Cossu, 2015). between source-separated FW collected from any of
Compositional analysis is a useful tool in identifying the latter three types of source. Micolucci et al. (2018)
materials categorised as unavoidable or avoidable (Figure 1) analysed source-separated food waste from Treviso, Italy
and has allowed the United Nations to define a Sustainable for both composition and biochemical characteristics, and
Development Goal with a specific target (SDG 12.3) referring compared the results with data from five European Union
to food waste. It asks: ‘By 2030, to halve per capita global FW (EU) countries (Italy, Finland, UK, Portugal and Greece).
at the retail and consumer levels and reduce food losses along Again, no significant differences were found. This result
production and supply chains, including post-harvest losses’. is not entirely unexpected, as food is both grown and
The European Commission has adopted this goal and has prepared to meet human dietary requirements, and the
defined FW as a priority within its Circular Economy Action daily intake of protein, fat, carbohydrate, roughage and
Plan (EC, 2015). liquids has evolved with humankind over millennia. Food
may differ greatly in appearance in different geographical
Chemical and biochemical analysis regions: for example, carbohydrate may be represented by
Accurate weight data and chemical or biochemical potato in northern Europe, by pasta in the Mediterranean
analyses are essential for developing treatment and re- region and by rice in south and south east Asia. Protein
source recovery technologies to recycle food and process may be predominantly from livestock in central Europe,
residues, avoidable and unavoidable, that end up in the but from fish in the Pacific Rim regions, and from eggs
waste stream. and pulses in parts of India. The data on chemical and
Chemical and biochemical analysis generally covers biochemical analysis given in Table 1 is taken from
a range of parameters, of which the most common are analysis of representative samples and shows considerable
moisture and solids content (total (TS) and volatile (VS) similarity between household source-separated material
solids, the latter also known as organic dry matter); from various sources.
biochemical composition (proteins, lipids, carbohydrates Based on the results of these and other studies, some typi-
and fibre); macro and trace nutrients; and potentially toxic cal values for a European food waste that could be used for
elements (PTE). Finding comparable data from across estimation and modelling purposes are shown in Table 2.12
Food Waste Digestion Source Separated Municipal Food Waste
Table 1: Physico-chemical and biochemical properties of some source-separated food wastes
UK a Finland a Italy a USA b China c S. Korea d
Source Eastleigh Forssa Treviso San Francisco Beijing Yongin
Basic characteristics for AD
pH 5.02±0.01 5.34 6.16 – 4.2±0.2 6.5±0.2
TS (% fresh matter) 25.89±0.01 27.02±0.12 27.47±0.03 30.90 ±0.07 23.1±0.3 18.1±0.6
VS (% fresh matter) 24.00±0.03 24.91±0.05 23.60±0.09 26.35 ±0.14 21.0±0.3 17.1±0.6
VS (% TS) 92.70±0.12 92.26±0.26 86.60±0.40 85.30±0.65 90.9 94±1
TOC (% TS) 48.76±0.87 – – – 56.3±1.1 –
TKN (% TS) 2.91±0.05 2.39±0.04 2.55±0.03 2.3±0.3 –
TKN (g kg-1 fresh matter) 7.53±0.13 6.45±0.1 7.02±0.1 – 5.31 5.42±0.26
Calorific value (kJ g-1 TS) 20.97±0.02 21.39±0.11 20.50±0.01 – – –
Biochemical composition on a VS basis (g kg -1 VS)
Carbohydrates 458±14 194±0.8 206±0.6 – 420 653.2±36.2
Lipids 149±1 156±0.5 202±0.5 – 364 136±3
Crude proteins 197±4 162±0.4 186±3 – 186 192±8
Hemi-cellulose 88.6±1.2 135±10 114±4 – – –
Cellulose 66.1±0.1 121±13 176±3 – 109 –
Lignin 21.7±0.1 40.4±5.4 32.3±0.8 – – –
Nutrients on a TS basis (g kg -1 TS)
TKN (N) 29.1±0.5 23.9±0.4 25.5±0.3 – 23±3 29.9±1.4
TP (P) 2.82±0.13 2.73±0.05 3.47±0.06 5.2±0.8 – 8.23±0.50
TK (K) 8.59±0.27 10.0±0.2 10.0±0.1 9.0±1.1 23.0±0.4 6.83
Potentially toxic elements on a TS basis (mg kg -1 TS)
Cadmium (Cd)13
Source Separated Municipal Food Waste Food Waste Digestion
Table 2: Model values for a typical European food waste
Parameter Unit Typical value
TS % fresh matter 24 to ‘dissolve’ the non-biodegradable structural components
VS % fresh matter 22 that protect the more degradable components. There are,
however, a considerable number of research papers reporting
TKN g kg-1 fresh matter 7.4
the results of pre-treatment techniques, albeit normally at a
Calorific Value (CV) MJ kg-1 TS 22
small scale, and with mixed results. Techniques considered
Carbohydrates (starch and sugar) g kg-1 VS 480
include:
Lipids g kg-1 VS 150
- Physical and mechanical pre-treatments such as
Crude proteins g kg-1 VS 210 chopping, grinding, milling and ultrasound
Hemi-cellulose g kg-1 VS 70 - Physico-chemical and chemical pre-treatments
Cellulose g kg-1 VS 60 including use of chemicals such as alkalis, acids and
Lignin g kg-1 VS 30 ozone
N g kg-1 TS 31 - Thermal pre-treatments including use of heat and hot
P g kg-1 TS 4 water
K g kg-1 TS 13 - Biological and enzymatic pre-treatments using
C % VS 52
specialized microorganisms and enzyme treatments
In the case of domestic food waste, pre-treatments should
H % VS 6.9
be considered with caution as the effect of biodegradability
O % VS 38
enhancement procedures may be limited, negligible or even
N % VS 3.4
negative! The latter is possible as pre-treatment may also result
S % VS 0.3 in detrimental effects through the formation of refractory/
Biochemical Methane Potential (BMP) m3 CH4 kg-1 VS 450 toxic compounds and the removal of organic material, both
of which counteract any positive benefits. An example is
heat treatment, which can bring about Maillard reactions in
2.3 Handling & Pretreatment substrates containing proteins and carbohydrates, resulting
Organic material from plants and animals used as in the formation of melanoidines (Jin et al., 2009; Müller,
food is by its very nature easily digestible in the relatively 2000). In another case autoclaving of food waste reduced
uncomplicated human alimentary canal. Our food contains methane yield simply because proteins were denatured,
very little lignin, and much of our fibre intake has been making them less susceptible to enzyme attack (Tampio et
milled in the food preparation process. It is therefore not al., 2016); a slight positive benefit was that the biogas H2S
surprising that food waste from domestic and catering content was also reduced, as the sulphur remained locked
establishments is readily digestible in an AD plant without up in the protein. An initial aerobic composting stage to
any pre-treatment other than particle size reduction. The promote rapid hydrolysis and enzyme production is likely
latter should be undertaken in any case, as a step to facilitate to result in a net decrease of organic material available for
effective pathogen destruction downstream. Typically, methane production.
source separated food waste fed to a single-stage mesophilic The degree of contamination of source-separated
digester will show a VS destruction of greater than 85%, domestic food waste is generally much lower than that
and the extent to which any form of pre-treatment will be found in material from co-mingled OFMSW (Hoornweg
viable from a financial or energy perspective is thus limited. and Bhada-Tata, 2012), and the number and intensity of pre-
This is because pre-treatment techniques generally employ treatments required is therefore lower.
either: (i) energy-intensive mechanical or thermal processes In the case of residues from food processing factories, pre-
aimed at exposing and increasing the surface area of the treatments may be beneficial, as one of the aims of food pro-
feedstock and making it more accessible to microbial attack; cessing is to remove the hard-to-digest fractions of the food
or (ii) materials-intensive chemical/biochemical methods such as the skin, seed case, peel or other non-edible parts.14
Food Waste Digestion Source Separated Municipal Food Waste
Figure 6: Valorsul AD plant in Lisbon, Portugal. Left – incoming waste. Right - manual sorting cabin (VALORGAS 2012b)
Pre-treatment options from compositional analysis and historical collection data.
Where it is necessary to apply pre-treatments, they can Food waste typically has a high moisture content of the
be divided into 3 main types: sorting, separation and ho- order of 75-80%. Many of the pre-treatment technologies
mogenisation. developed for separating the organic fraction from MSW,
such as rotating drum or disc screens, are thus not appro-
Sorting. The first step of pre-treatment is to remove priate since they rapidly blind when the waste adheres to
non-biodegradable and inert materials that can negatively surfaces or tends to ‘ball’ as a result of the rotational move-
affect downstream processes or digestate quality. Ideally, ment. Typically, for high levels of contamination densito-
this should happen at source, and the effectiveness of a col- metric separation techniques are used either in conjunc-
lection scheme in removing unwanted materials will deter- tion with or following particle size reduction.
mine what sorting is required at the treatment plant. Most When dealing with supermarket and other retail wastes
AD plants, irrespective of the collection system, will have de-packaging equipment may be needed, and a number of
at least visual inspection of the incoming material to pro- proprietary devices are available. These are typically de-
tect the plant from damage to downstream equipment and signed to remove the outer packaging and utilise a combi-
processes. Where gross contamination is a regular problem, nation of mechanical and centrifugal forces coupled with
larger items of paper, plastic, textiles and metals may be screening to separate out the denser food waste from the
manually sorted (Figure 6). lighter card and film packaging components (Figure 7).
Where a food waste stream is to be co-digested, additional
Separation. If necessary mechanical separation can be pre-treatment of other input streams may be required,
used downstream for further contaminant removal. The such as grit and stone removal from animal slurries or ma-
design of this is based on knowledge of the waste obtained nures.
Figure 7: Left – Food de-packaging machine. Right – Linde hydropulper in operation at Valorsul AD plant (courtesy FP7 VALORGAS).15
Source Separated Municipal Food Waste Food Waste Digestion
Figure 8: Food waste shredder at Biocycle South Shropshire AD plant (Pictures: C J Banks)
Homogenisation. Homogenisation is an important proce- digestion, with most food waste falling into category 3. With
dure to promote degradation and prevent clogging, settling the exception of some category 2 materials, all food waste
or formation of floating layers inside the digester. The first must be treated to meet a minimum standard in terms of
step is size reduction, using shredders (Figure 8) and screw pathogen indicator organisms.
cutters, or mills for drier types of material. For ease of pump- In general, this has to be achieved in a two-stage process
ing and mixing the chopped material may then be converted which involves particle size reduction followed by heat
into a slurry using macerator pumps and recycled digestate treatment and biological stabilisation, for which anaerobic
before direct feeding to the digester. digestion is a suitable process. The degree of treatment
Homogenisation of food waste is generally simpler than depends on both the temperature and the holding time.
processing of co-mingled OFMSW or biowastes, where the Sterilisation can be achieved by at least 20 minutes of
addition of water may be required to reach a suitable dry exposure at a core temperature of more than 133 °C and
matter content for contaminant removal using densitometric an absolute steam pressure of no less than 3 bar; this is
techniques. One of the most common techniques for this required for some category 2 materials. Category 3 food
purpose is the use of a ‘Hydropulper’ (Figure 7), which processing waste requires particle size reduction to 12 mm
allows the separation and removal of light floating materials and heat treatment for 60 minutes at 70 °C; whereas catering
and denser settleable particles. wastes (including household food waste) can be treated in
a number of ways provided they meet an end-of-process
Pasteurisation and Pathogen Reduction microbiological standard. In addition to specific process
Food waste may contain a range of pathogens, and as a requirements, there is also a requirement to implement
result of the emergence of Bovine Spongiform Encephalitis strict hygiene controls to prevent bypass between potentially
(BSE) and the catastrophic impacts of foot and mouth, swine contaminated incoming ABP material and the final digestate
fever and other animal diseases, the European Commission product.
has introduced regulations to control the end use and dis- These requirements are onerous and may add consider-
posal of animal by-products (ABPR) (EC 1069/2009 and ably to both the capital and operating costs of running an
142/2011). These cover food waste, which falls into different anaerobic digester, yet the direct and indirect costs of a ma-
categories depending on its origin. In the EU only materials jor animal health incident fully justify this precautionary ap-
in categories 2 and 3 can be processed through anaerobic proach.16
Food Waste Digestion Anaerobic Digestion Systems
3. Anaerobic Digestion Systems
The mono digestion of food waste has so far found its This behaviour is now known to be a consequence of the
greatest popularity in the UK where there are now 94 plants composition of food waste, and in particular of its relatively
producing biogas from mixed commercial and residential high nitrogen content. Food waste contains a nitrogen-
food waste, the largest proportion of which is used to generate rich protein fraction which, on digestion, is degraded
218 MW of electricity in CHP units (IEA Bioenergy, 2017a). to ammonia. This provides an essential nutrient for the
The Scandinavian countries have also been early adopters of growth of microorganisms in the anaerobic consortium,
food waste digestion, with some interesting examples where but at higher concentrations it is also inhibitory. Inhibition
biogas is used mainly as a vehicle fuel. Food waste digestion thresholds vary depending on a number of factors,
plants can also be seen in parts of Spain and Portugal. These including the type of organism and the digester conditions.
plants are usually operated at a ‘natural’ retention time i.e. Of the two main groups of methanogens present in a
without addition of water or other liquids. Even though the typical anaerobic digester, however, the acetoclastic
input material typically has a TS content of around 24% the methanogens are generally more sensitive to ammonia. As
digesters are operating at low solids concentrations in a ‘wet’ total ammonia nitrogen (TAN) concentrations increase, the
digestion process, since at approximately 85% VS degrada- acetoclastic population is progressively reduced, leading
tion the resulting TS concentration is less than 6%. As such to accumulation of first acetic acid and then other VFA, in
food waste digestion is distinct from biowaste schemes in particular propionic acid.
which the food component is comingled with garden waste
and sometimes with paper and card, giving a higher TS and Finding solutions to the mono-digestion of food waste
lower digestibility than for food waste alone. Biowaste collec- The acetoclastic pathway can be replaced by hydrog-
tion is more common in central Europe and requires either a enotrophic methanogenesis by stimulating this initially
‘wet’ digester design in which water is recycled or added, or smaller part of the archaeal population and promoting the
uses a plug flow ‘dry‘ digestion system. degradation of acetic acid through a two-stage process. This
There are many historical reasons why different first involves converting acetic acid to CO2 and H2 by syn-
systems have developed, and each has its advantages and trophic acetate oxidation, then the CO2 and H2 are used by
disadvantages; but once an infrastructure is in place it is hydrogenotrophic methanogens to produce methane. The
difficult and costly to change. Thus all technical options trace element requirement of this combined process is dif-
should be carefully evaluated early in the planning process ferent from that of the acetoclastic pathway, and Selenium
alongside any financial drivers, regulatory issues and has been shown to be essential for the mesophilic digestion
opportunities for nutrient recycling. of food wastes at TAN concentrations above approximately
4.5 g N L-1 or free ammonia nitrogen concentrations above
3.1 Historical Issues in Mono-Digestion of Food Waste about 0.7 g N L-1. Once this alternative hydrogenotrophic
The biochemical and other characteristics of food waste route is established then process loadings can be increased,
make it very attractive as a digestion substrate as it has a although at higher organic loading rates (OLR), deficien-
high methane potential and is readily degradable. Early tri- cies in other trace elements such as Cobalt may become
als with mono-digestion of source segregated food waste as apparent (Banks et al., 2012). There is also some evidence
a sole substrate showed good gas productivity and high sol- that Molybdenum and Tungsten play a role in food waste
ids degradation over the first several months of operation. digestion; it is necessary to look for specific deficiencies in
After prolonged operating periods, however, signs of inhibi- trace elements associated with different food waste types.
tion were observed with reductions in the specific methane Recommended minimum values for six key trace elements
yield, increases in volatile fatty acid (VFA) concentrations are shown in Table 3. In practice some of these elements
(Banks et al., 2008, 2011; Neiva Correia et al., 2008; Park et such as Nickel, Molybdenum, Tungsten and Iron are gen-
al., 2008; Zhang et al., 2012), and in extreme cases a fall in erally present in domestic and commercial food waste in
digester pH and failure of the digestion process. sufficient amounts and do not require supplementation.17
Anaerobic Digestion Systems Food Waste Digestion
Table 3: Recommended minimum trace element concentrations
when food waste is used as an AD feedstock
Amount for addition
Metal
to feedstock in g m-3
3.2 Estimating the Energy Potential of Food Waste
Selenium (Se) 0.2
Digestion
Cobalt (Co) 0.35
Biochemical and elemental compositions can be used as
Nickel (Ni) a 1.0 a basis for prediction of the actual and maximum theoretical
Molybdenum (Mo) a 0.2 methane potential of a feedstock, in some cases providing a
Iron (Fe) a 10.0 reality check on quoted methane yields. This is discussed in
Tungsten (W) a 0.2 detail in the IEA Bioenergy Report on the value of batch tests
a Generally present in sufficient quantities in food waste for biogas potential analysis (Weinrich et al., 2018). Table 4
shows theoretical methane yields from some typical bio-
chemical components; again this is discussed in more detail
Trace element addition should be minimised with respect in Weinrich et al., (2018). For food waste in particular, these
to both the elements and the concentrations used, due to values usually provide a reasonably good estimate of the
concerns over dispersion into the environment (including Biochemical Methane Potential (BMP) and biogas composi-
to agricultural land), as well as cost aspects. More research tion of a feedstock; the values can be modified if the actual
is needed in this area, as trace element supplementation is elemental composition of the lipid, protein or carbohydrate
a complex issue and affected by many factors including in- is known and differs from the typical formulas shown. Cel-
terspecies competition between different microbial groups, lulose and hemi-cellulose can be regarded as carbohydrates
bioavailability, interaction between different elements, and but lignin is not normally degradable in a conventional an-
the organic loading rate applied. Current work has demon- aerobic digester; a high ratio of lignin may indicate that the
strated that Se and Co dosing of 0.2 and 0.35 g m-3, respec- lignocellulosic fraction of the material will be resistant to
tively, is sufficient to operate UK food waste at OLR of up to degradation.
5 kg VS m-3 day-1 without VFA accumulation. The elemental composition can be used in conjunction
Work by a number of research groups around the world with the Buswell equation (Symons and Buswell, 1933) to
has now elucidated the metabolic pathways and microbial calculate the maximum theoretical methane potential of
community structures involved in both the failure of the feedstock, assuming all components are converted. This
unsupplemented food waste digestion and the subsequent provides an upper bound for the methane yield (Angelidaki
successful resolution of the problem. This outcome provides and Sanders, 2004). The high biodegradability of food waste
an outstanding example of the insights new tools in means that a relatively high proportion of this theoretical
microbial and analytical sciences can offer and the practical yield can be achieved, and the biogas composition is typi-
application of these in full-scale engineered systems (Banks cally close to the predicted value.
et al., 2012; Zhang and Jahng, 2012; Zhang et al., 2015; BMP values for source separated domestic food waste
Fotidis et al., 2014). in Europe are typically in the range 0.42–0.47 m3 kg-1 VS,
Table 4: Typical methane yields for biochemical components (adapted from Angelidaki and Sanders 2004)
Typical Methane yield a CH4
Substrate
composition [L CH4 g-1 VS] [% Vol]
Simple sugars – e.g. glucose C6H12O6 0.373 50
Carbohydrate – complex C6H10O5 0.415 50
Protein C5H7NO2 0.495 50
Lipid C57H104O6 1.013 70
Cellulose C6H10O5 0.415 b 50
Hemicellulose Variable 0.424 c 50
a At standard temperature and pressure of 0 °C and 101.325 kPa
b Maximum, depends on degree of accessibility and crystallinity
c Maximum, assuming pentose polymers only. In reality will also contain hexose, uronic acid etc with lower methane yields18
Food Waste Digestion Anaerobic Digestion Systems
and compositional data suggest values elsewhere will be tisation requirements. Thermophilic operation presents
broadly similar. The specific methane production (SMP) some challenges for typical source separated food wastes.
in a well-run mesophilic digestion plant can reach a very At the higher operating temperature, a higher proportion
high proportion of both the BMP value and the measured of the TAN is present in the form of free ammonia, which
or theoretical calorific value, with 75% or more of the is more inhibitory to micro-organisms. The safe work-
higher heat value (HHV) recovered in the form of meth- ing threshold for TAN is reduced, and signs of inhibition
ane, making this a highly efficient conversion process for are likely to appear at TAN concentrations of between
a wet organic material. Factors affecting BMP and SMP 3 –4 g N L-1. This is below the TAN concentration typi-
values include the proportion of lignocellulosic materials cally found in domestic food wastes when digested un-
in the feedstock, which in addition to their intrinsically der thermophilic conditions; long-term stable operation
lower BMP are also slower to degrade. Although lipids at thermophilic temperatures is therefore not possible
have a high biomethane potential, in high concentrations without further interventions. Despite several studies,
they may be problematic for digestion. no trace element supplementation has yet been identified
that allows stable operation in thermophilic conditions.
Operating limits and strategies A number of possible options to allow thermophilic op-
Most commercial food waste digesters operate at eration have been tested. The most common approach,
mesophilic temperatures and there has been a steady in- which has been successfully demonstrated at both labora-
crease in organic loading rates (OLR) from the ‘safe’ load- tory and commercial scale, is dilution of the feedstock to
ing of less than 2 kg VS m-3 day-1 applied in the early days, bring the ammonia concentration down below the toxic-
when the need for trace element supplementation was not ity threshold. This has potential disadvantages, as dilu-
understood, to typical values today of 3-5 kg VS m-3 day-1. tion requires a continuous input of water or other low-
At a feedstock VS content of 22% and an OLR of 5 kg VS nitrogen liquid, thus increasing the required digester size
m-3 day-1 the retention time is around 44 days; in these and the volume of digestate for disposal. An alternative
conditions a digester is likely to achieve 80% or more of is a downstream treatment process to strip ammonia and
the BMP value of food waste. In terms of extracting the other compounds from the dilution medium before recy-
maximum amount of energy from the feedstock and pro- cling. A recent study indicated, however, that the impact
ducing a well-stabilised digestate, this performance leaves on the overall process energy balance when compared to
relatively little room for improvement. mesophilic digestion may be small as, although dilution
Further increases in loading are possible but it is means larger volumes of digestate must be processed, the
important to know the limitations that will ultimately need for pre- or post-pasteurisation is eliminated (Zhang
apply. With correct trace element supplementation, OLR et al., 2017a).
of up to 8 g VS L-1 day-1 have been demonstrated over Another approach is to strip the ammonia from the
long periods at laboratory scale, without any loss in SMP. contents of the digester itself in order to reduce the con-
At OLR over 8 g VS L-1 day-1 there are signs of a reduction centration below the toxicity threshold. Stable thermo-
in the SMP. The most likely reason is simply that, at this philic digestion of undiluted domestic food waste has
OLR, the retention time in the digester is reduced to the recently been demonstrated for the first time at pilot scale
point where not all of the potential degradation can be using a side-stream biogas stripping process, in which the
achieved during the average period for which the food digestate TAN concentration could be controlled by the
waste remains in the digester. degree of stripping applied, without adverse effects on the
Some operators prefer to work in the thermophilic SMP (Zhang et al., 2017b). Other studies have looked at
range (between 55 and 60° C), citing higher reaction stripping using a range of gases from air to nitrogen and
rates, potential improvements in biogas yield due to CO2 mixtures, and a variety of process configurations;
improved degradation of lignocellulosic fractions, and these approaches also offer the potential for recovery of
greater ease of complying with ABPR and digestate sani- ammonia in a form suitable for use as a chemical ferti-19
Anaerobic Digestion Systems Food Waste Digestion
liser, with the option of creating designer digestates tailored domestic food waste from local collection schemes, with a
to local soil and crop types. In many parts of Europe, the small proportion of commercial food waste. The total vol-
amount of digestate that can be applied is controlled by ume of the digester was 900 m3 and it was maintained at
regulations to protect nitrate vulnerable zones. One of the 42 °C, towards the high end of the normally recommended
potential benefits of ammonia stripping may be an increase mesophilic range. The digester operated at an average organ-
in allowable application rates, which reduces the energy re- ic loading rate of around 2.7 kg VS m-3 day-1 and a hydraulic
quirement for transporting digestate. In future a range of retention time (HRT) of around 90 days. One key benefit
novel techniques such as electrochemical, absorption and from the study was to show that methane yields and deg-
membrane techniques are likely to become available for re- radation rates close to those found in laboratory and pilot-
covery of ammonia and other nutrients. scale studies could be achieved at large scale in a convention-
al single-stage mesophilic digester. The mass balance closure
Mass and energy balances for the Biocycle and Valorsul food waste for the study period based on fresh weight of materials was
digesters 90.3%, and 95.7% on a VS basis. Specific methane produc-
A number of energy balance studies have been carried tion was around 400 m3 tonne-1 VS, a little below typical val-
out on food waste digestion looking both at full-scale plant ues for this type of material: this was possibly related to the
and at theoretical scenarios. absence of trace element supplementation in this period. A
One of the earliest studies carried out was on the Bio- comprehensive energy balance carried out for the monitor-
cycle South Shropshire Digester in Ludlow, UK as part of a ing period showed that for each tonne of input material the
national monitoring programme for various types of waste potential recoverable energy was 405 kWh. Table 5 summa-
management demonstration plant (Banks et al., 2011). The rises some of the key components in the energy balance. It
flow sheet for the plant is shown in Figure 9 and, as can be should be noted that the capacity of the AD plant was based
seen, it has a simple linear configuration where feed enters on serving local needs rather than bringing in materials
the plant, is shredded, fed to the digester, pasteurised and from long distance, and it is therefore at the lower end of the
sent to the digestate storage tank before reuse through land typical size range for commercial food waste digesters.
application. A small amount of digestate is recycled to the Another mass and energy balance study was carried out
raw waste buffer tank to facilitate maceration and pumping. using data from the Biocycle plant over an even more ex-
Over a 14-month period, the plant received just under 4000 tended period (1919 days) and from the Valorsul AD plant
tonnes of feedstock, consisting primarily of source separated in Lisbon, Portugal (372 days). The digesters at each plant
Figure 9: Biocycle plant flowsheet20
Food Waste Digestion Anaerobic Digestion Systems
Table 5: Energy requirements, losses and outputs for Biocycle AD plant (based on Banks et al., 2011)
kWh
% of CHP gross
Parameter tonne-1
energy output
of input
mills then water was added to create
CHP gross energy output 706.9 100.0 a suspension that was pumped to the
CHP unrecoverable energy 115.9 16.4 hydropulper.
CHP electrical output [A] 216.5 30.6 Biological treatment involved a
Parasitic electrical requirement of process plant [B] 59.1 8.4 thermophilic (51 °C) digestion pro-
Net energy output as electricity [A-B] 157.4 22.3 cess after which the suspension was
Recoverable heat output from CHP [C] 374.5 53.0 dewatered. The solid fraction was
Parasitic heat requirement of plant [D] 113.4 16.0 mixed with wood chips and pre-
Net energy output as heat [C-D] 261.1 37.0 composted in tunnels with forced
CHP natural gas used [E] 4.7 0.7 aeration, then post-composted in
Energy required for biofertiliser use [F] 8.7 1.2 windrows in a covered area. The
Total potentially recoverable energy (heat and electricity) final compost was refined by siev-
405.1 57.3 ing and use of a densitometric table
[A-B]+[C-D]-[E]-[F]
to remove contaminants. The water
fraction was sent for treatment in
are shown in Figure 10. The Valorsul AD plant was de- an Activated Sludge plant with nitrification/denitrification,
signed to process 40,000 tonnes of source separated food followed by ultrafiltration modules, before recycling as pro-
waste per year, primarily from commercial sources such as cess water. The biogas produced was stored in a gasholder
restaurants, wholesale and retail markets, supermarkets, and sent to two generators to produce electric energy (in-
schools and hospital canteens, with a small proportion of stalled capacity of 1.6 MW). Excess heat from the exhaust
source separated domestic food waste. At the time of the gas was used to heat water to maintain the digester tempera-
study, waste delivered to the plant was discharged into one ture and to supply heat to the composting tunnels. A simpli-
of two lines, depending on the level of contamination. The fied flow sheet for the Valorsul plant is shown in Figure 11.
more contaminated materials were passed through a wet The overall mass balances for each plant on a wet weight
pre-treatment process consisting of manual sorting, fer- and a volatile solids basis are shown in Figure 12. The re-
rous metal separation, shredding, pulping and sieving, after sults were good in both cases, although mass balance clo-
which the resulting suspension was sent to a hydrolysis tank. sure was slightly better on the less complex Biocycle plant.
Materials with little contamination passed through hammer The major notable difference was in the proportion of re-
Figure 10: Digesters at Biocycle (left) and Valorsul plant (right) (courtesy FP7 VALORGAS)You can also read