FORECLOSURE UPDATE: 2020 - Boston.gov
←
→
Page content transcription
If your browser does not render page correctly, please read the page content below
FORECLOSURE
UPDATE: 2020

   Foreclosure Update: 2020   NEIGHBORHOOD
                              DEVELOPMENT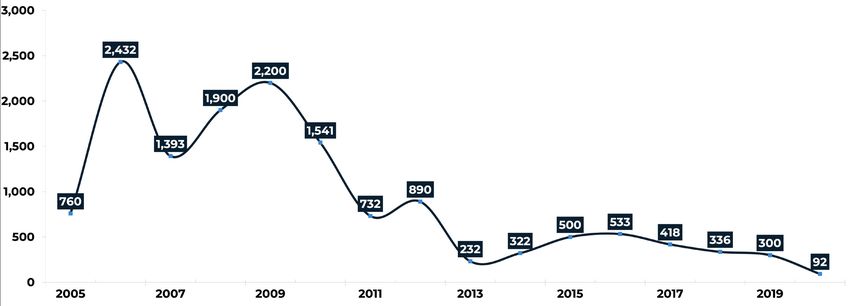
2

       2020 FORECLOSURE OVERVIEW
•   Foreclosure petitions (the initiation of the foreclosure process) decreased by 69
    percent, from 300 in 2019 to 92 in 2020.

•   The percentage of petitions that were owner-occupant properties decreased by
    four percentage points from 61 percent in 2019 to 57 percent (52 total) in 2020.

•   Fifty-eight percent of the petitions occurred in four neighborhoods, with 28 in
    Dorchester, ten in Hyde Park, and eight in Mattapan and Roxbury.

•   Completed foreclosures (deeds) decreased by 15 percent, from 40 in 2019 to 34
    in 2020.

•   Twenty-five percent (8 total) of the 2020 foreclosure deeds were owner-
    occupants.

•   Among the top ten most populous Massachusetts cities, Boston ranks 9th for the
    rate of foreclosure petitions and foreclosure deeds per 1,000 residential parcels,
    respectively.

•   At year-end 2020, the City identified 75 real estate owned (REO) properties,
    down 64 percent from 213 at the end of 2013. Just 20 (9%) of the original 213
    properties remain REO.1

1       The original REO count published in Boston 2030 was 224, a count of REOs in the mid-summer of 2013.
By the end of 2013, REOs rose to 236. However, the 2013 year-end count was revised to 213 as a result of missed
REO sales and rescinded foreclosure deeds.

                                    Foreclosure Update: 2020                                            NEIGHBORHOOD
                                                                                                        DEVELOPMENT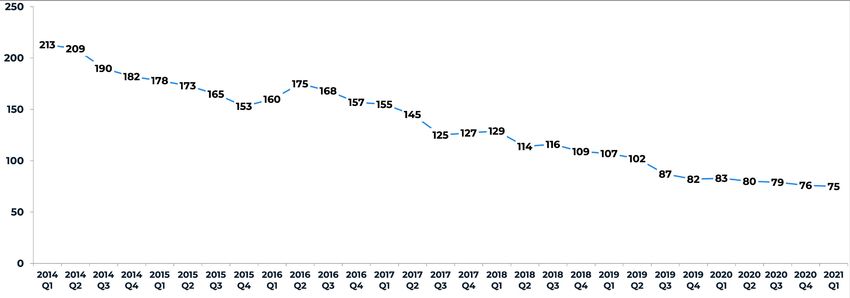
3

    2020 FORECLOSURE OVERVIEW
                            DEFINITIONS
FORECLOSURE              A foreclosure is the taking possession of a property
                         because of a default by the homeowner, typically for
                         not meeting mortgage obligations.

FORECLOSURE PETITION A lender must file a petition in Land Court to begin
                     the foreclosure process.
FORECLOSURE DEED         Issued after the foreclosure process, including the
                         auction. The deed represents the forced sale of the
                         property back to the lender or a third party.

RESIDENTIAL PROPERTY     Condominiums, single, two-, and three-family
                         homes as designated by the City of Boston Assessing
                         Department.

NEIGHBORHOOD             For the 2020 Foreclosure Trends Reports (and reports
                         in the future), DND will no longer use the Planning
                         Districts (PD) to define neighborhood boundaries.
                         Instead, DND will be using the same boundaries
                         used by the BPDA, which are more contemporary.
                         For example, the BPDA boundaries break the City of
                         Boston into 26 neighborhoods. In contrast, the PDs
                         divide the City into 15 more extensive neighborhood
                         areas.
DATA SOURCES             Warren Group provided the Foreclosure Data for
                         this report. The Department of Neighborhood
                         Development (DND) conducted the analysis. Parcel
                         Data is obtained from the Division of Local Services,
                         MA Department of Revenue, Data Analytics and
                         Resources Bureau.

                       Foreclosure Update: 2020                          NEIGHBORHOOD
                                                                         DEVELOPMENT
4
FORECLOSURE PETITIONS
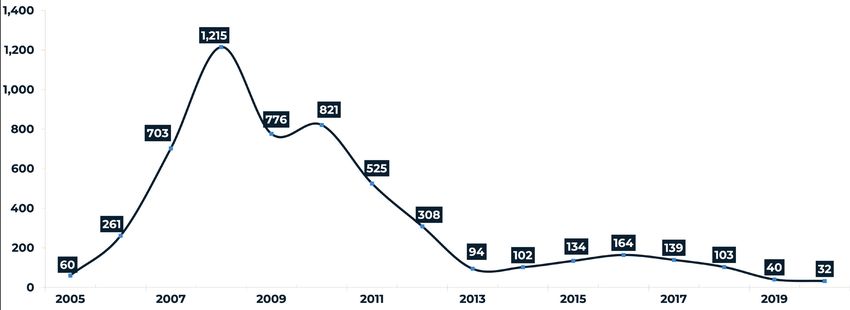
CHART 1. FORECLOSURE PETITIONS IN BOSTON, 2005-2020
Foreclosure petitions decreased from 300 in 2019 to 92 in 2020, a reduction of
208 (-69%) petitions. This drastic decline occurred primarily because the courts
were closed due to COVID-19 related restrictions and foreclosure moratoriums. By
March of 2020, when the State of Massachusetts began to shut down, there were
39 petitions, 28 fewer (-41%) than during the same time period in 2019. Fifty-eight
percent of petitioned properties occurred in four neighborhoods: Dorchester (28),
Mattapan (8), Roxbury (8), and Hyde Park (10), even though these four neighborhoods
have only one-third of the total residential properties in Boston. The bulk of petitions
have been concentrated in these four neighborhoods year over year. However, the
concentration has decreased by 14 percent since 2018. Dorchester saw the most
significant reduction with 63 fewer petitions since last year. With the exception of the
South Boston Waterfront (Seaport), no neighborhood saw an increase in petitions.
Foreclosure Update: 2020 NEIGHBORHOOD
DEVELOPMENT5
FORECLOSURE PETITIONS
TABLE 1. FORECLOSURE PETITIONS BY NEIGHBORHOODS &
PROPERTY TYPE
FORECLOSURE PETITIONS - 2019 FORECLOSURE PETITIONS - 2020 CHANGE
CONDO 1-FAM 2-FAM 3-FAM TOTAL CONDO 1-FAM 2-FAM 3-FAM TOTAL CONDO 1-FAM 2-FAM 3-FAM TOTAL
ALLSTON 2 0 2 0 4 0 0 0 0 0 -2 0 -2 0 -4
BACK BAY 1 4 0 0 5 0 1 0 0 1 -1 -3 0 0 -4
BAY VILLAGE 0 0 0 0 0 0 0 0 0 0 0 0 0 0 0
BEACON HILL 2 2 0 0 4 0 1 0 0 1 -2 -1 0 0 -3
BRIGHTON 3 3 3 0 9 1 2 1 0 4 -2 -1 -2 0 -5
CHARLESTOWN 1 1 1 0 3 1 0 0 0 1 0 -1 -1 0 -2
CHINATOWN 0 0 0 0 0 0 0 0 0 0 0 0 0 0 0
DORCHESTER 23 16 25 27 91 11 7 5 5 28 -12 -9 -20 -22 -63
DOWNTOWN 0 2 0 0 2 0 1 0 0 1 0 -1 0 0 -1
EAST BOSTON 1 2 4 5 12 2 0 2 1 5 1 -2 -2 -4 -7
FENWAY 0 2 0 0 2 0 0 0 0 0 0 -2 0 0 -2
HYDE PARK 26 1 9 1 37 8 0 2 0 10 -18 -1 -7 -1 -27
JAMAICA PLAIN 5 6 4 1 16 0 1 2 0 3 -5 -5 -2 -1 -13
LEATHER DISTRICT 0 1 0 0 1 0 0 0 0 0 0 -1 0 0 -1
LONGWOOD 0 0 0 0 0 0 0 0 0 0 0 0 0 0 0
MEDICAL AREA
MATTAPAN 22 3 6 5 36 4 0 2 2 8 -18 -3 -4 -3 -28
MISSION HILL 1 0 0 0 1 0 1 0 0 1 -1 1 0 0 0
NORTH END 0 1 0 0 1 0 1 0 0 1 0 0 0 0 0
ROSLINDALE 5 3 4 0 12 3 0 1 0 4 -2 -3 -3 0 -8
ROXBURY 7 11 3 8 29 3 1 3 1 8 -4 -10 0 -7 -21
SOUTH BOSTON 2 8 1 1 12 1 3 0 1 5 -1 -5 -1 0 -7
SOUTH BOSTON 0 0 0 0 0 0 1 0 0 1 0 1 0 0 1
WATERFRONT
SOUTH END 0 2 0 0 2 0 1 0 0 1 0 -1 0 0 -1
WEST END 0 2 0 0 2 0 0 0 0 0 0 -2 0 0 -2
WEST ROXBURY 15 2 1 1 19 5 2 1 1 9 -10 0 0 0 -10
CITYWIDE 116 72 63 49 300 39 23 19 11 92 -77 -49 -44 -38 -208
Source: The Warren Group data, DND analysis
Foreclosure Update: 2020 NEIGHBORHOOD
DEVELOPMENT6
FORECLOSURE PETITIONS
Sixty-seven percent of the properties petitioned were condominiums and single-
family homes. In comparison, 33 percent were two-and-three family properties.
Comparatively, Boston’s residential housing stock (by parcel) comprises 75 percent
condominium and single-family properties, while 25 percent are multi-family (2-3
units). Therefore, the petitions of multi-families continue to be overrepresented
relative to their proportion of Boston’s housing stock. This elevation of foreclosure in
multi-family properties is particularly troubling because it impacts both owners and
tenants, as discussed in the tenancy section.
Some of the owners of these petitioned properties will be able to avoid foreclosures
through alternative resolutions, such as mortgage modifications, mortgage write-
downs, refinances, or short sales. For example, in 2020, Boston Home Center (BHC)
closed 26 out of the 41 petition-related cases. BHC is a division of the City’s Department
of Neighborhood Development, which helps Boston residents purchase, improve,
and keep their homes. The closed cases resulted in 23 (88%) favorable resolutions
that prevented foreclosure (primarily loan modifications). BHC counseled the other
three cases (11.5%), or the participants were non-responsive. The fifteen remaining
cases were still open at the end of 2020, with staff continuing to work on resolutions.
Foreclosure Update: 2020 NEIGHBORHOOD
DEVELOPMENT7
FORECLOSURE DEEDS
CHART 2. FORECLOSURE DEEDS IN BOSTON, 2005-2020
The number of foreclosure deeds decreased by 20 percent from 2019 to 2020, from
40 to 32 foreclosure deeds. In 2019 and 2020, foreclosure levels were lower than any
time since 2004, a year with only 25 foreclosure deeds. Because of the low number
of foreclosures, no neighborhood had significant fluctuations in the number of
foreclosures. The most notable changes occurred in Hyde Park and East Boston, with
a decrease of six foreclosures and an increase of three foreclosures, respectively. The
following neighborhoods had three or more foreclosures: Dorchester, East Boston,
Hyde Park, Jamaica Plain, Mattapan, and Roxbury. Seventy-six percent of foreclosed
properties were condominiums and single-family homes, while 30 percent were
multi-family. No property types saw a rise in foreclosures.
Foreclosure Update: 2020 NEIGHBORHOOD
DEVELOPMENT8
FORECLOSURE DEEDS
TABLE 2. FORECLOSURE DEEDS BY NEIGHBORHOODS &
PROPERTY TYPE
FORECLOSURE DEEDS - 2019 FORECLOSURE DEEDS - 2020 CHANGE
CONDO 1-FAM 2-FAM 3-FAM TOTAL CONDO 1-FAM 2-FAM 3-FAM TOTAL CONDO 1-FAM 2-FAM 3-FAM TOTAL
ALLSTON 0 0 0 0 0 0 0 0 0 0 0 0 0 0 0
BACK BAY 0 1 0 0 1 0 1 0 0 1 0 0 0 0 0
BAY VILLAGE 0 0 0 0 0 0 0 0 0 0 0 0 0 0 0
BEACON HILL 0 0 0 0 0 0 0 0 0 0 0 0 0 0 0
BRIGHTON 0 1 1 0 2 0 0 1 0 1 0 -1 0 0 -1
CHARLESTOWN 0 0 0 0 0 1 0 0 0 1 1 0 0 0 1
CHINATOWN 0 0 0 0 0 0 0 0 0 0 0 0 0 0 0
DORCHESTER 3 0 5 2 10 5 3 0 1 9 2 3 -5 -1 -1
DOWNTOWN 0 0 0 0 0 0 0 0 0 0 0 0 0 0 0
EAST BOSTON 1 0 0 0 1 2 0 0 2 4 1 0 0 2 3
FENWAY 0 0 0 0 0 0 0 0 0 0 0 0 0 0 0
HYDE PARK 7 2 1 0 10 2 1 0 1 4 -5 -1 -1 1 -6
JAMAICA PLAIN 0 2 0 0 2 0 1 0 2 3 0 -1 0 2 1
LEATHER DISTRICT 0 0 0 0 0 0 0 0 0 0 0 0 0 0 0
LONGWOOD 0 0 0 0 0 0 0 0 0 0 0 0 0 0 0
MEDICAL AREA
MATTAPAN 1 0 1 1 3 2 1 0 0 3 1 1 -1 -1 0
MISSION HILL 0 0 0 0 0 0 0 0 0 0 0 0 0 0 0
NORTH END 0 0 0 0 0 0 1 0 0 1 0 1 0 0 1
ROSLINDALE 2 0 0 1 3 1 0 0 0 1 -1 0 0 -1 -2
ROXBURY 0 2 1 0 3 1 1 1 0 3 1 -1 0 0 0
SOUTH BOSTON 0 2 0 0 2 0 0 0 0 0 0 -2 0 0 -2
SOUTH BOSTON 0 0 0 0 0 0 0 0 0 0 0 0 0 0 0
WATERFRONT
SOUTH END 0 1 0 0 1 0 0 0 0 0 0 -1 0 0 -1
WEST END 0 0 0 0 0 0 0 0 0 0 0 0 0 0 0
WEST ROXBURY 2 0 0 0 2 1 0 0 0 1 -1 0 0 0 -1
CITYWIDE 16 11 9 4 40 15 9 2 6 32 -1 -2 -7 2 -8
Source: The Warren Group data, DND analysis
Foreclosure Update: 2020 NEIGHBORHOOD
DEVELOPMENT9
TENANCY
Table 3 breaks out foreclosure petitions by owner-occupancy. During the 2000s,
foreclosures were primarily of investor-owned properties. During the last decade,
while the total number of petitions has declined, the percentage of petitions on
owner-occupied properties has been rising steadily, to more than 60 percent. In
2020, that rate dropped to 57 percent.
Nonetheless, there were still more than 90 foreclosure petitions filed in 2020. While
more than half of petitions affect owner-occupant homeowners, not all petitions
lead to foreclosure. In addition, owner-occupant homeowners in foreclosure have
better access to foreclosure counseling and prevention resources than investors. As
a result, petitions on investor owners are more likely to result in a foreclosure deed
than for owner-occupants.
TABLE 3: FORECLOSURE PETITIONS BY OWNER-OCCUPANCY,
2011-2020
YEAR OWNER- INVESTOR- TOTAL PERCENTAGE
OCCUPIED OWNED OWNER-OCCUPIED
2011 418 314 732 57%
2012 520 370 890 58%
2013 131 101 232 56%
2014 179 143 322 56%
2015 295 205 500 59%
2016 313 220 533 59%
2017 259 159 418 62%
2018 207 129 336 62%
2019 183 117 300 61%
2020 52 40 92 57%
Source: The Warren Group data, DND analysis
Foreclosure Update: 2020 NEIGHBORHOOD
DEVELOPMENT10
TENANCY
In 2020, there were just eight owner-occupied property foreclosures, likely
attributable to COVID-19 pandemic restrictions. Reducing the number of foreclosure
executions on owner-occupied homes in the City of Boston to less than 20 per year is
one of Boston’s comprehensive housing policy goals discussed in Housing a Changing
City: Boston 2030. The City met this goal in both 2019 and 2020.
TABLE 4: FORECLOSURE DEEDS BY OWNER-OCCUPANCY, 2011-
2020
YEAR OWNER- INVESTOR- TOTAL PERCENTAGE
OCCUPIED OWNED OWNER-OCCUPIED
2011 196 329 525 37%
2012 103 205 308 33%
2013 35 59 94 37%
2014 34 68 102 33%
2015 54 80 134 40%
2016 57 107 164 35%
2017 58 81 139 42%
2018 35 68 103 34%
2019 15 25 40 38%
2020 8 24 32 25%
Source: The Warren Group data, DND analysis
Foreclosure Update: 2020 NEIGHBORHOOD
DEVELOPMENT11
TENANCY
The residential exemption status from the City of Boston’s Assessing Department
is used to identify whether a foreclosed property is owner-occupied. To receive a
residential exemption from the City, an owner must live in the property on January
1st of the upcoming tax bill year and submit appropriate documentation to the
Assessing Department. Owner-occupied units likely are underestimated using this
data source. However, it remains the most reliable and accessible source to identify
owner-occupied properties. It is assumed that all properties without a residential
exemption are tenant-occupied. The owner-occupied two- and three-family homes
have one or two rental units, respectively, to estimate the number of tenant-occupied
units affected by foreclosure.
The 32 properties foreclosed in 2020 comprise 46 units of housing. This estimate
likely overestimates the number of tenants affected because it relies on the Assessing
Department’s residential exemption status and assumes that all units are occupied
at the time of foreclosure. Using this method, however, it is estimated that up to 38
tenant-occupied housing units were or may have been displaced due to foreclosure.
(Buildings with more than four dwelling units are rarely foreclosed upon and,
therefore, not included in this report.)
Foreclosure Update: 2020 NEIGHBORHOOD
DEVELOPMENT12
TENANCY
TABLE 5: ESTIMATE OF THE NUMBER OF TENANT-OCCUPIED
HOUSING UNITS IN FORECLOSED PROPERTIES, 2011-2020
YEAR NUMBER OF NUMBER OF ESTIMATE OF PERCENTAGE
FORECLOSED HOUSING NUMBER OF RENTAL
PROPERTIES UNITS RENTAL UNITS UNITS
2011 525 780 549 70%
2012 308 466 363 78%
2013 94 137 102 74%
2014 102 135 101 75%
2015 134 181 127 70%
2016 164 239 183 77%
2017 139 194 136 70%
2018 103 150 115 77%
2019 40 57 42 74%
2020 32 46 38 83%
Source: The Warren Group data, DND analysis
Foreclosure Update: 2020 NEIGHBORHOOD
DEVELOPMENT13
TENANCY
TABLE 6: 2020 FORECLOSED PROPERTIES BY PROPERTY TYPE
AND NUMBER OF HOUSING UNITS
PROPERTY TYPE FORECLOSURES HOUSING TENANT
UNITS UNITS
CONDOMINIUMS 7 7 7
1-FAMILY 10 10 10
2-FAMILY 1 2 2
3-FAMILY 6 18 18
TOTAL INVESTOR-OWNED 24 37 37
CONDOMINIUMS 2 2 0
1-FAMILY 5 5 0
2-FAMILY 1 2 1
3-FAMILY 0 0 0
TOTAL OWNER-OCCUPIED 8 9 1
TOTAL 32 46 38
Source: The Warren Group data, DND analysis
Foreclosure Update: 2020 NEIGHBORHOOD
DEVELOPMENT14
REAL ESTATE OWNED PROPERTY
A property becomes Real Estate Owned (REO) or lender-owned when taken back
by the lender at a foreclosure auction instead of being purchased by a third-party
investor. This process occurs when the purchase price offered at auction is lower
than the amount the lender is owed. Of the 32 properties foreclosed in 2020, lenders
bought back 17 (53.1%), a slight percentage increase from last year. However, this
percentage is considerably lower than in 2011 (77.7%), when Boston’s housing market
was still struggling to recover from the Great Recession.
TABLE 7: PERCENTAGE OF REO PROPERTIES, 2011-2020
YEAR REO PRIVATE PERCENTAGE PERCENTAGE
BUYER OF TOTAL REO
FORECLOSURES
2011 408 117 525 77.7%
2012 230 78 308 74.7%
2013 55 39 94 58.5%
2014 60 42 102 58.8%
2015 72 62 134 53.7%
2016 109 55 164 66.5%
2017 64 75 139 46.0%
2018 52 51 103 50.5%
2019 21 19 40 52.5%
2020 17 15 32 53.1%
Source: The Warren Group data, DND analysis
The number of properties held by lenders (the “REO inventory”) is in flux throughout
the year. Some properties become REO at auction, and lenders sell properties that
they own. At year-end 2020, the City identified 74 properties that were still REO after
considering properties either sold or foreclosures rescinded in Land Court (see Chart
2). This change represents a decrease of eight REOs compared to the 2019 year-end
count of 82 properties.
Foreclosure Update: 2020 NEIGHBORHOOD
DEVELOPMENT15
REAL ESTATE OWNED PROPERTY
CHART 3. REO END OF QUARTER COUNTS, 2014-2021
The City of Boston established a goal to reduce REO properties by 50 percent by 2016
in its Housing Boston 2030 plan. The current REO count of 75 represents a 64 percent
decline from the revised 2013 end-of-year count. Most importantly, only 20 (9%) of
the adjusted count of 213 properties from the 2013 year-end count remain, indicating
significant progress on returning distressed properties to the market.
Vacant REO properties can pose a risk to neighborhoods by attracting crime and
lowering local property values. In addition, over time, REO properties can begin to
deteriorate and show signs of physical distress, adding to the City’s distressed building
inventory and ultimately destabilizing communities. For these reasons, properties
that remain REO for long periods are a more significant concern than properties that
banks resell quickly.
Foreclosure Update: 2020 NEIGHBORHOOD
DEVELOPMENT16
REGIONAL AND STATE CONTEXT
The following tables show foreclosure petitions, foreclosure deeds, and total
foreclosure activity (including foreclosure sales) per 1,000 residential parcels (single-
family, multi-family, and condominiums) for Massachusetts cities with populations
over 90,000 and for the entire state. Boston ranks ninth for foreclosure petitions and
foreclosure deeds among the top ten most populated Massachusetts municipalities
in 2020. Indeed, Boston’s foreclosure petition rate (0.7/1,000 parcels) and foreclosure
deed rate (0.3/1,000) and significantly lower than the state’s rates on these measures
(0.9/1,000 and 0.7/1,000, respectively).
TABLE 8: FORECLOSURE PETITION RATE FOR
TOP 10 MOST POPULATED MASSACHUSETTS CITIES
RANK MASSACHUSETTS 2019 2020 CHANGE 2019 2020 CHANGE
CITY (POPULATIONS PETITIONS PETITIONS FORECLOSURE FORECLOSURE
OVER 90,000) PETITION PETITION
RATE RATE
PER 1,000 PER 1,000
RESIDENTIAL RESIDENTIAL
PARCELS PARCELS
1 SPRINGFIELD 306 108 -198 8.5 3 -5.5
2 BROCKTON 171 63 -108 7.7 2.8 -4.8
3 WORCESTER 197 56 -141 5.1 1.4 -3.6
4 FALL RIVER 73 23 -50 4.5 1.4 -3.1
5 LYNN 100 23 -77 5.3 1.2 -4.1
6 LOWELL 86 26 -60 3.9 1.2 -2.7
7 NEW BEDFORD 124 24 -100 6 1.2 -4.9
8 QUINCY 52 16 -36 2.2 0.7 -1.5
9 BOSTON 300 92 -208 2.4 0.7 -1.6
10 CAMBRIDGE 10 3 -7 0.5 0.1 -0.3
TOTAL COUNT 1,419 434 -985 4.1 1.2 -2.8
MASSACHUSETTS 5,816 1,812 -4,004 3 0.9 -2
Source: Division of Local Services, MA Department of Revenue, Data Analytics and Resources
Bureau
Foreclosure Update: 2020 NEIGHBORHOOD
DEVELOPMENT17
STATE CONTEXT
TABLE 9. FORECLOSURE DEED RATE FOR
TOP 10 MOST POPULATED MASSACHUSETTS CITIES
RANK MASSACHUSETTS 2019 2020 CHANGE 2019 2020 CHANGE
CITY (POPULATIONS DEEDS DEEDS FORECLOSURE FORECLOSURE
OVER 90,000) RATE PER 1,000 RATE PER 1,000
RESIDENTIAL RESIDENTIAL
PARCELS PARCELS
1 SPRINGFIELD 182 84 -98 5.1 2.3 -2.7
2 NEW BEDFORD 64 45 -19 3.1 2.2 -0.9
3 BROCKTON 70 36 -34 3.1 1.6 -1.5
4 FALL RIVER 39 24 -15 2.4 1.5 -0.9
5 WORCESTER 117 51 -66 3 1.3 -1.7
6 LYNN 40 20 -20 2.1 1 -1.1
7 LOWELL 33 15 -18 1.5 0.7 -0.8
8 QUINCY 15 10 -5 0.6 0.4 -0.2
9 BOSTON 40 34 -6 0.3 0.3 -0.1
10 CAMBRIDGE 3 2 -1 0.1 0.1 0
TOTAL COUNT 603 321 -282 1.7 0.9 -0.8
MASSACHUSETTS 2,536 1,321 -1,215 1.3 0.7 -0.6
Source: Division of Local Services, MA Department of Revenue, Data Analytics and Resources
Bureau
Boston’s total foreclosure activity rate (1.4/1,000) is tied with Quincy but ranked
higher because Boston’s total foreclosure activity is higher. Again Boston’s rate is
lower than the state rate as well as the total rate for comparative cities. Brockton
and Springfield consistently have had among the highest foreclosure activity rates
among the largest cities in Massachusetts since the Great Recession of 2007 to 2009.
Foreclosure Update: 2020 NEIGHBORHOOD
DEVELOPMENT18
STATE CONTEXT
Table 10: Total Foreclosure Activity (Petitions, Sales, and Deeds)
per 1,000 Parcels
RANK MASSACHUSETTS 2019 2020 CHANGE 2019 2020 CHANGE
CITY (POPULATIONS FORECLOSURE FORECLOSURE
OVER 90,000) ACTIVITY ACTIVITY
PER 1,000 PER 1,000
RESIDENTIAL RESIDENTIAL
PARCELS PARCELS
1 BROCKTON 653 209 -444 29.2 9.3 -19.9
2 SPRINGFIELD 1,177 295 -882 32.9 8.2 -24.6
3 LYNN 418 92 -326 22 4.8 -17.2
4 WORCESTER 766 182 -584 19.8 4.7 -15.1
5 FALL RIVER 321 71 -250 19.7 4.3 -15.4
6 NEW BEDFORD 329 89 -240 16 4.3 -11.7
7 LOWELL 323 61 -262 14.7 2.8 -12
8 BOSTON 620 178 -442 4.9 1.4 -3.5
9 QUINCY 184 33 -151 7.7 1.4 -6.4
10 CAMBRIDGE 44 8 -36 2 0.4 -1.6
TOTAL COUNT 4,835 1,218 -3,617 14.1 3.5 -10.6
MASSACHUSETTS 19,473 4,453 -15,020 10 2.3 -7.7
Source: Division of Local Services, MA Department of Revenue, Data Analytics and Resources
Bureau
Foreclosure Update: 2020 NEIGHBORHOOD
DEVELOPMENT19
THE IMPACT OF COVID-19
Despite the economic distress created by the COVID-19 Pandemic, foreclosure
activity in 2020 was at record lows, in part because of the relief provided to
eligible homeowners by both the Commonwealth of Massachusetts and the federal
government. The State moratorium ended in October 2020. This moratorium
prevented lenders or servicers from undertaking foreclosure-related actions such as
a foreclosure sale or exercising a right to entry. This moratorium applied to owner-
occupied homes of four units or fewer that were neither vacant nor abandoned.
Generally speaking, this moratorium did not allow homeowners to skip payments;
instead, it allowed homeowners to pay in a lump sum, via a repayment schedule or
through a loan modification. In addition, during the moratorium period, penalties
and late fees were waived for missed payments. The federal foreclosure moratorium
applies to federally backed mortgages such as Freddie Mac, Fannie Mae, and HUD/
FHA loans. However, lenders or servicers of non-federally backed mortgages may
provide some relief on their own. The federal relief ends June 30, 2021. However,
some banks, such as Wells Fargo, have announced extensions of mortgage relief
through the rest of the year.
Though foreclosure protections are ending, new funds will soon become available to
assist vulnerable homeowners. As part of the American Rescue Plan Act (ARP), nearly
$10 billion was provided to assist homeowners. Of these funds, the Commonwealth is
receiving $178.5 million, and will launch a program in the second half of 2021.
Even with this funding, it is expected that foreclosures will rise in the last half of
2021 and into 2022, though it is difficult to predict how much. In the first half of 2021,
calls to the Boston Home Center to inquire about foreclosure prevention services
nearly tripled. The City will monitor foreclosures closely, reach out to homeowners,
continue to offer foreclosure prevention services, and connect owners to the ARP
funds so as to protect Boston’s homeowners.
Foreclosure Update: 2020 NEIGHBORHOOD
DEVELOPMENTYou can also read