Foreign Aid and Structural Change - Calumn Hamilton Working Paper
←
→
Page content transcription
If your browser does not render page correctly, please read the page content below
Foreign Aid and Structural Change
                              Calumn Hamilton

                      Working Paper
   Version November 2021 - Preliminary, please do not cite
                 University of Groningen
                  c.g.hamilton@rug.nl

                                     Abstract
          This paper explores the effects of DAC and Chinese aid on the
      sectoral structure of Sub-Saharan African economies. It extends the
      GGDC/UNU-WIDER Economic Transformation Database with sub-
      national sectoral employment data such that analysis can be per-
      formed at the national and sub-national levels. 2SLS regressions are
      estimated using a novel IV strategy for identifying the effects of aid
      which exploits exogenous variation in the frequency and severity of
      natural disasters in donor countries. The findings suggest that DAC
      aid has a negative effect on the relative size of manufacturing activity,
      whereas Chinese aid does not. On average, a ten percent increase in
      DAC aid causes an estimated 0.14 percentage point decrease in the
      manufacturing employment share after four years. Policy implications
      for DAC aid and industrialization-led development strategies are dis-
      cussed.

   Keywords— aid effectiveness, foreign aid, deindustrialization, structural change,
DAC aid, Chinese aid, regional aid, Dutch Disease, urbanization, Economic Trans-
formation Database, manufacturing share, agricultural share.

                                         1
1     Introduction
Two recurring findings have caused concern amongst macroeconomic development
researchers and policymakers for quite some time. Years of study into aid effec-
tiveness have found aid effects which are disappointing at best, and disastrous at
worst (Gong & Zou 2003; Rajan & Subramanian 2008; Doucouliagos & Paldam
2009). Meanwhile, the structural change literature has raised serious concerns re-
garding the state of industrialization in Sub-Saharan Africa [SSA]. It is proposed
that a process of deindustrialization in some African countries has led to work-
ers being reallocated from manufacturing to less productive activities, reducing
overall average productivity in the economy and mitigating positive gains from
within-sector productivity growth (de Vries et al. 2013; McMillan et al. 2014;
Rodrik 2016). In other countries, industrialization has as yet failed to initialize
to any noteworthy degree, and many workers remain in low productivity sectors.
As industrialization is seen as integral both to the early development of Europe
and the USA (Maddison 2001), and to modern development success stories such
as China and the economies of South-East Asia (Young 1995), questions are being
asked as to how rapid growth can take off in SSA in the absence of industrializa-
tion, and what may be driving the underwhelming industrial performance thus far.

    This paper positions itself at the intersection of the structural change and aid
effectiveness literatures in order to explore the extent to which these two recurring
findings may be related. There is reason to suppose that large inflows of foreign
capital may affect the structure of the economy through the mechanism of the real
exchange rate (Rajan & Subramanian 2011; Gollin et al. 2015), and that if these
inflows act more as consumption than productive resources, the effect may be to
suppress the industrial sector. Furthermore, it has been suggested that DAC aid
has targeted more rural areas in recent years, resulting in a negative causal effect
on urbanization (Hamilton et al 2021). This may cause deindustrialization when
cities are centres of manufacturing activity. If foreign aid has contributed to poor
industrial performance in SSA, this could simultaneously provide a partial expla-
nation for the disappointing effects of aid on growth, and for deindustrialization
in some African countries.

    In order to explore the effects of aid on the structure of the economies of SSA,
these effects must be causally identified in a manner which plausibly alleviates
endogeneity biases. Additionally, to account for potentially heterogeneous effects
of different types of aid, it is necessary to separately consider aid from competing

                                         2
sources, especially when the nature of such aid is demonstrably different1 . Finally,
the existence of the micro-macro paradox in aid effectiveness, by which aid effects
are often found to be encouraging at the local/project level but disappointing at
the country level (Mosley 1986), suggests the need for analysis of the effects of aid
on industrialization in units smaller than entire countries, in this case sub-national
regions - in the words of Arndt et al. (2010), a ‘meso-level’ analysis. This paper
seeks to incorporate all of these three factors to answer the research question: How
do DAC and Chinese aid flows affect the manufacturing and agricultural shares of
the economies of Sub-Saharan African, and are these effects heterogeneous across
the two aid types? Do these effects hold also at the sub-national level?

    Benchmark estimations of the national level effects of aid on structural change
are generated by exploiting the panel data structure with panel fixed effects regres-
sions. The control set includes alternative theoretical drivers of structural change
(van Neuss 2019; Mensah 2020), which allows for comparison of the significance and
magnitude of the aid effects. The preferred national level specifications, however,
take the form of panel fixed effects instrumental variable regressions. Aid flows are
instrumented using instrument sets constructed in the manner of Nunn & Qian
(2014), utilizing two sources of variation. First, this paper exploits plausibly ex-
ogenous time variation in the total volumes of both DAC and Chinese aid driven
by the frequency and severity of natural disasters occurring in donor countries.
Second, cross-sectional variation is introduced on the basis of varying likelihood of
being a Chinese aid recipient, or varying weights of the composition of total DAC
aid across the individual donor countries of the DAC. The interaction of these two
sources of variation yields separate sets of instruments for Chinese and DAC aid
which exhibit full panel variation. The disaster based instruments for Chinese aid
were first presented in Hamilton et al. (2021); this paper expands upon the same
principle by constructing a set of weighted average index instruments for the full
DAC. These instruments for DAC aid are constructed and presented in this paper
for the first time. It is shown that both instrument sets for DAC and Chinese aid
are sufficiently strong, and it is argued that both satisfy the exclusion restriction.
   1
    This paper considers separately the structural change effects of aid from China and
from the DAC. Aid from these two sources are often seen as fundamentally different in both
nature and intention. Dunford (2020) notes that the Chinese aid model rests on a different
conception of international relationships which is less interventionist and based more on
mutual advantage, especially in the case of the Belts and Roads Initiative [BRI]; Bello
(2019) goes into depth regarding the political economy motivations for the disbursement
of Chinese aid; Berthelemy (2011) details the difference in project focus between Chinese
and DAC aid; and Dreher et al. (2019) demonstrate that Chinese aid is less conditional
and therefore more prone to political capture than DAC aid.

                                            3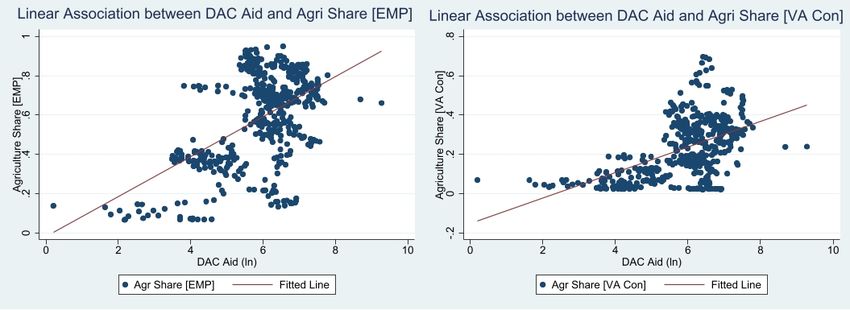
In terms of data, this paper utilizes the newly released Economic Transfor-
mation Database [ETD] from the Groningen Growth and Development Centre
[GGDC] in order to analyse structural change on the widest possible sample of
SSA countries (de Vries et al. 2021). The database provides quality sectoral em-
ployment and value added data across a large sample of developing countries. This
paper supplements the ETD by constructing a new Sub-National Economic Trans-
formation Database [SETD] Beta version, which compiles regional sectoral employ-
ment shares across 122 regions of 8 different countries of Sub-Saharan Africa2 . The
SETD follows similar construction principles as the ETD and is presented here for
the first time. With regards to aid data, a pioneering new geolocated data-set
of the universe of Chinese aid projects, compiled by Bluhm et al. (2018) and
maintained by the AidData research lab of William & Mary University (AidData
2017a), allows for both national and sub-national level analysis of the effects of
Chinese aid, and a similar database of geolocated World Bank aid projects (Aid-
Data 2017b) allows for analysis of this component of DAC aid at the sub-national
level.

    The results show that DAC aid has had a significantly negative causal effect
on the manufacturing share of employment in Sub-Saharan Africa in recent years
at the national level. Furthermore, it appears that DAC aid has also negatively
affected the manufacturing share of value added, and positively affected the agri-
cultural share of employment. This may imply that the displaced workers from
manufacturing relocated at least in part to agriculture, although this link is not
proven. There is no such deindustrializing effect of Chinese aid at the national
level, and in fact the preferred IV specifications suggest that Chinese aid posi-
tively affected the manufacturing share, albeit at a smaller economic magnitude
than the negative effect of DAC aid. These findings are broadly confirmed at the
sub-national level, although the process takes place more quickly, and may reverse
over time in the case of Chinese aid. In terms of the effect sizes, from the preferred
specifications a ten percent increase in the flow of DAC aid causes an approximately
0.142 percentage point decrease in the relative size of the manufacturing share of
employment after four years3 , ceteris paribus. By contrast, a ten percent increase
in the flow of Chinese aid causes an approximately 0.052 percentage point increase
in the relative size of the manufacturing share of employment after four years,
   2
     The selection of countries for the SETD was guided predominantly by data availability,
this may lead to some selection biases which are discussed in Appendix A.
   3
     The effect duration of four years is to allow the mechanism by which aid affects
manufacturing share to unfurl, the contemporaneous effects are smaller but operate in the
same direction. The decision as to lag-length is discussed in detail in section 4.

                                            4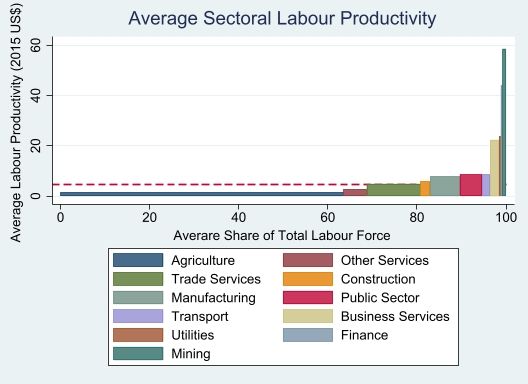
ceteris paribus. The magnitudes of the percentage point changes in manufacturing
value added share are similar for the effects of both DAC and Chinese aid, although
the VA effects are not as regularly significant across all specifications. These effects
are equivalent to just under 14,000 workers diverted from manufacturing in the
average country year per 10% increase in DAC aid, and just over 5,000 workers
diverted to manufacturing from other sectors per 10% increase in Chinese aid4 .
An econometric horse-race between the DAC and Chinese aid effects, conducted
in Appendix D, confirms the expectation that the pro-industrialization effects of
Chinese aid were insufficient to fully mitigate the deindustrializing effects of DAC
aid.

    The remainder of this paper will proceed as follows. Section 2 outlines the
extant literature linking foreign aid and structural change, explores theoretical
mechanisms, and develops three hypotheses. Section 3 compiles data and sources
before presenting and exploring descriptive statistics. Section 4 outlines the em-
pirical strategies and introduces the new instruments. Section 5 presents and
discusses all results. Section 6 concludes.

2       Background Literature, Theory, and Hy-
        potheses
There has been little direct research into the effects of foreign aid on structural
change and (de)industrialization. This is likely due in part to the relative recency
with which quality economic structure data for a large sample of aid-recipient
countries has become available. Data limitations might explain why the exist-
ing literature, such as there is, takes the form either of case studies for single
economies (Ahlerup 2019), or are narrative/descriptive in structure (Page 2012).
Ahlerup (2019) uses micro-level data and a DiD identification strategy to explore
the effects of foreign aid on the economic structure of Uganda and finds that aid
caused a reallocation of working hours to agriculture (from non-agriculture), with
the dependent variable as the self-reported hours spent on agricultural activities
from individual level survey data. Ahlerup speculates that this result may be
due to crowding out of local suppliers of non-agricultural goods by aid projects
providing mosquito nets, water pumps, school supplies, etc. Page (2012) presents
a series of descriptives based on the African Sector Database, a precursor of the
    4
   These numbers are calculated by multiplying the point estimate for the change in
manufacturing share by the total persons employed in the average sample country-year.
The full calculations are in section 5.

                                           5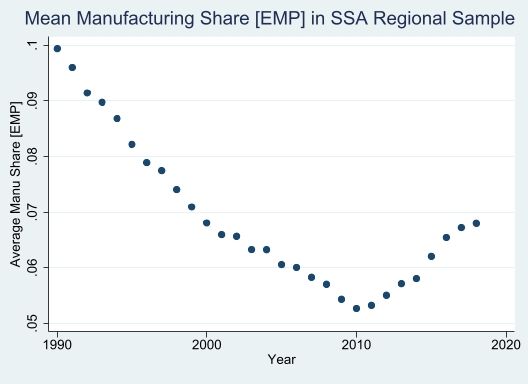
ETD, which chart both the process of deindustrialization in Africa and the priori-
ties of DAC aid disbursement over the same time period, arguing that the targeting
of DAC aid was not conducive to industry. Specifically, it is argued that DAC aid
had a low focus on infrastructure and human capital generation due to other de-
velopment priorities.

     In terms of the theoretical mechanisms by which aid may affect structural
change and industrialization, a natural starting point is the four categories of
drivers of structural established in van Neuss (2019); “(i) changes in income, (ii)
changes in relative (sectoral) prices, (iii) changes in input–output linkages and (iv)
changes in comparative advantage(s) via globalization and trade.” The literature
surrounding the effects of aid on growth, and therefore on incomes as in category
(i), suggests mixed at best, and disappointing at worst, effects of aid on growth; a
finding which in part motivates this paper. In a meta-analysis of 97 aid effective-
ness studies, Doucouliagos & Paldam (2009) note the striking formal homogeneity
of the empirical specifications, with all of them either attempting to estimate the
direct effect of aid on growth, the direct effect of aid on investment, or the effect of
aid on growth conditional on other features of the recipient countries. They con-
clude from this meta-analysis that, on balance, aid was ineffective in stimulating
growth and investment in the four decades since 1970. Later studies provide more
mixed results (Mekasha & Tarp 2013; Galiani et al. 2016; Minasyan et al. 2017),
including some which suggest small but significantly positive effects, but for the
most part the literature suggests an effect of aid on growth which is conditionally
positive at best.

    Aid may also affect international trade as in category (iv), especially if the
aid is conditional upon liberalizing trade regimes. Martı́nez-Zarzoso (2019) argues
that aid increases the volume of imports from donor countries. Pettersson and Jo-
hansson (2013) argue that foreign aid has a significant causal effect on the volume
of recipient country exports, whereas Nowak-Lehman et al. (2013) by contrast ar-
gues there is no such significant effect. Similarly, aid may affect the input-output
linkages of category (iii) if it led to modernization of the economy and therefore of
intermediate production, however evidence suggests the coefficients of the Leontief
matrix (technological structure of intermediate production) are relatively persis-
tant over short time periods (Torres-Gonzales & Yang 2018). Category (ii), the
impact of aid on differential sectoral productivity, will be discussed in the next
section.

                                           6
2.1 An aid ‘Dutch Disease’ ?
A primary theoretical mechanism for the effect of aid on structural change and
industrialization is whether aid can lead to a form of ‘dutch disease’. The dutch
disease hypothesis proposes that, when large inflows of capital flow to specific sec-
tors, the result can be a decline in the relative size and performance of other sectors
(Buiter & Purvis 1983). Originally developed as a potential explanation for why
natural resource discoveries sometimes fail to yield significant GDP growth, the
name refers to the discovery of natural gas in the Dutch province of Groningen.
The impact is negative for the aggregate macroeconomy especially when the cap-
ital receiving sector is less conducive for growth than the sectors which decline;
for example, the natural resources sector has a poor capacity to absorb labour, is
prone to rent extraction, and often yields value added which flows back out of the
country. The process works through the real exchange rate mechanism: the large
capital inflows cause an appreciation in the recipient country exchange rate rela-
tive to other countries, therefore the recipient country imports more and exports
less. As a result, the effect is especially harmful for recipient country sectors which
produce tradeable goods.
The potential for foreign aid to drive a form of dutch disease has been widely
explored in the literature. A classic paper is Rajan & Subramanian (2011), which
explores the effects of aid on the relative growth rates of more and less exportable
manufacturing industries, and concludes that aid caused the exportable indus-
tries to grow relatively slower, thereby damaging recipient country competitive-
ness. The paper presents suggestive evidence that this process unfurled via the
exchange rate mechanism. A theoretical underpinning for this finding can be
found in Michaely (1981), which presents a model by which inflows of foreign cap-
ital affects the relative prices of tradeable and non-tradeable goods and relates
it specifically to aid. More recently, Diao & McMillan (2018) update the Lewis
(1954) model to include a third ‘in-between-traditional-and-modern’ sector, which
they call non-tradeables. According to their model, when public investment is
financed by foreign inflows, which would include but is not limited to foreign aid,
the ‘modern’ sector becomes less competitive, again because of appreciation of the
real exchange rate. Diao & McMillan empirically test this model for the case study
of Rwanda, utilizing micro-level data, and find evidence of this effect. They also
note that Rodrik (2008) proposed the appreciation of the real exchange rate as an
explicit mechanism for the disappointing effects of aid on growth, and that this
might take place through a Dutch disease style channel.
Implicit in the hypothesis that aid drives a form of Dutch disease is the notion
7that aid does not flow especially to the manufacturing sector, or at least does
not boost manufacturing productivity. Strong descriptive evidence for this can be
found in the aforementioned paper of Page (2012). Additionally, Page & Shimeles
(2015) find no effect of aid on overall employment levels in recipient countries,
suggesting that aid is not boosting sectors which have a large capacity to generate
employment, such as manufacturing. Boone (1996) found that aid led to increased
government consumption and an expanded public sector, which suggests aid was
not flowing largely to manufacturing. Another way of thinking about this is to ask
the question: does aid function more as a productive or a consumption resource?
On the basis of the literature thus far, the latter appears to be more reflective of
the reality of aid.
Gollin et al. (2015) create a model of structural change by which the nature
of sectoral shifts, and resulting ‘types’ of urbanization, depends on the nature of
exogenous capital inflows. Their model and empirics considers the role of capital
inflows from natural resource extraction, but as with models of the dutch disease,
it is easy to conceptualize aid as the capital inflow instead. Gollin et al. differ-
entiate between ‘production’ and ‘consumption’ cities, arguing that as countries
develop, cities tend to expand, but the nature of this expansion depends very much
on changes in the underlying structure of the economy. If the economy reallocates
productive resources in an efficient, growth-enhancing manner; the manufacturing
sector increases in relative size and cities become centres of industrial production,
benefitting from agglomeration, scale effects, and industrial externalities (Tolley
& Thomas 1987). However, if an exogenous capital inflow concentrates wealth
or yields rent extraction, the result may instead be a concentration of consump-
tion power and increase in demand for consumption goods and services. In this
case, manufacturing goods are instead imported due to the appreciation of the
real exchange rate, and cities facilitate consumption by providing primarily non-
tradeable goods and services. The implication for structural change is a relative
decline in the manufacturing sector and relative increases in the size of less pro-
ductive, non-tradeable service sectors, and maybe also of agriculture in producing
primary ingredients for non-tradeable consumption products and services, and also
as a larger share of national exports.
2.2 Spatial Targeting of Aid
Whilst cities may be differentiated between consumption and production centres,
agriculture takes place primarily in rural areas. Therefore, the expected effect
of aid on the ratio of the agriculture to manufacturing sectors may be greatly
informed by the effect of aid on urban-rural migration. Hamilton et al. (2021)
8explored the causal effect of aid on urbanization rates and found that DAC aid had
a negative effect on urbanization rates in Sub-Saharan Africa, whereas Chinese aid
had no such effect, and actually seems to have positively influenced urbanization.
This research question was motivated by an explicit shift in DAC aid disbursement
policy in recent years towards supporting rural projects (OECD 2012), with no
such spatial targeting stated for Chinese aid. If indeed DAC aid facilitated urban-
to-rural migration, it could therefore be expected that this would in turn lead to
declines in the relative size of the manufacturing sector and increases in the relative
size of the agriculture sector, especially in terms of employment.5 Conversely,
if Chinese aid lead to rural-to-urban migration, this might be expected to have
a positive effect on manufacturing, although this expectation is weaker as the
connection between urbanization and manufacturing may be less strong than the
connection between deurbanization and agriculture.
2.3 Heterogeneous effects by source and level of aggre-
gation.
The discussion of the above subsection indicates one possible explanation of why
DAC and Chinese aid may affect structural change differently. Similarly, whilst
Page (2012) suggests that DAC aid was not channeled towards infrastructure and
other uses supportive of manufacturing, and OECD (2012) suggests instead that it
was channeled more to rural areas and agriculture, there is evidence that Chinese
aid is significantly targetted at infrastucture (Berthelemy 2011, Bello 2019). Ad-
ditionally, Dreher et al. (2018) suggests that recipient country governments exert
much more influence over the disbursement of Chinese as opposed to DAC aid,
and that Chinese aid is more prone to political capture. This is likely part of the
reason why Chinese aid is spent more commonly on infrastructure, as such spend-
ing is politically popular, and why it is targeted more commonly at urban areas
where there are larger voter concentrations (Pugh 1996). It may alternatively lead
to a deindustrialization effect if Chinese aid is prone to rent extraction as opposed
to productive use. The question of whether DAC and Chinese aid have affected
structural change and industrialization differently is ultimately an empirical one,
however the suggestive evidence is that it is more ambiguous as to whether Chinese
aid will have driven declines in manufacturing than DAC aid.
Whilst aid affects appear to have been either negative, null, or at best condi-
5
To the extent that the Lewis (1954) assumption of a zero marginal product of agricul-
tural labour in developing countries still holds, increases in agricultural employment need
not lead to increases in total agricultural value added.
9tionally positive at the national level, the results of project level studies into aid
effectiveness are often much more optimistic. This is known as the ‘micro-macro’
paradox in the aid effectiveness literature6 (Mosley 1986). One potential explana-
tion for this paradox is that aid is fungible with government spending. Therefore,
aid projects which have a positive effect locally may crowd out government spend-
ing on similar projects nationally, resulting in null effects on aggregate. Arndt
et al. (2010) also introduce an intermediate stage of meso-level effects to capture
effects between the individual and national level; effects which can be assembled
either by aggregating micro-level studies, or performing analysis on sub-national
units such as regions or cities. Results based on country-level analysis alone may
be insufficiently detailed as to facilitate quality policy prescription, especially in
the presence of imperfect measurement and heterogeneous aid effects. On the
other hand, most most micro-level studies essentially capture only partial equilib-
rium effects missing the aforementioned fungibility, and may be temporally con-
strained. Comprehensive aid effectiveness research should therefore incorporate
both a macro-level and at least meso-level component. It is for this reason that
this paper opts to construct sub-national level data so as to establish the extent
to which results also hold at the meso-level.
2.4 Hypotheses
On the basis of the above overview of literature and theory, this paper draws three
hypotheses which will be subjected to empirical testing:
Hypothesis (H1): DAC Aid has caused deindustrialization in SSA, particularly
in terms of employment.
That is, DAC aid drove reductions in the relative size of the manufacturing sec-
tor, ceteris paribus. This is because DAC aid was not targeted at uses conducive to
manufacturing productivity, and instead reduced the competitiveness of recipient
country exporting sectors and caused urban-to-rural migration. Therefore, DAC
aid acted more as a consumption resource.
Hypothesis (H2): The expected effect of Chinese aid on industrialization is more
ambiguous, and may balance out to a null effect.
6
Arndt et al. (2010) confirm the persistence of the micro-macro paradox in the aid
effectiveness literature in recent years, noting continued highly positive impact evaluations
of specific aid projects (Cohen & Soto 2007; Banerjee & Duflo 2009) in the same time
period when most rigorous macro-level analysis found null or even negative effects (Gong
& Zou 2003; Rajan & Subramanian 2008).
10This is because Chinese aid focused more on infrastructure, and may have
caused rural-to-urban migration, but also may be more prone to political capture.
Hypothesis (H3): Both types of aid have had similar effects at the sub-national
as at national level, however these effects may have manifested more quickly.
Due to the micro-macro paradox in aid effectiveness, and the fact that most
of the above discussed mechanisms involve country level variables such as the real
exchange rate, it is difficult to predict in advance whether the sub-national level
effects will strongly mirror the national level effects. However, regions remain
quite a high level of aggregation, so it is expected that effects will operate in
the same direction as at the national level, although not necessarily at the same
magnitude. Because production and labour can reallocate more quickly within
regions than within countries, it is expected that this will be reflected in a more
rapid reallocation response to aid inflows. The results in section 5 collectively
represent an empirical test of these three hypotheses.
3 Data and Sources
3.1 Data
The national level analysis is performed on a panel of 18 Sub-Saharan African
[SSA] countries7 of the Economic Transformation Database [ETD] (de Vries et
al. 2021). As the ETD prioritized primary source data, with each country in-
dividually investigated so as to retrieve sectoral data directly from the NSIs, it
automatically represents an improvement on secondary sources such as the ILO
sectoral employment estimates. The ETD represents the largest sample of quality
sectoral employment and value added data presently available, and therefore the
SSA sample is as large as is possible. The sample does not, however, include all
the economies of SSA; the extent to which this sample is representative will be
discussed later in the section on potential biases. The ETD covers the time period
1990 - 2018; however in some cases, the time period on which analysis can be
performed is restricted by the aid inflow data. The analysis of the effects of DAC
aid at the national level covers the entire time period 1990 - 2018; the analysis
of the effects of World Bank aid at the sub-national level covers the time period
1995 - 2014; the analysis of the effects of Chinese aid at both the national and
7
Burkina Faso, Botswana, Cameroon, Ethiopia, Ghana, Kenya, Lesotho, Mozambique,
Mauritius, Malawi, Namibia, Nigeria, Rwanda, Senegal, South Africa, Tanzania, Uganda,
and Zambia.
11sub-national levels covers the time period 2000 - 2014. In all cases, the sample
period is the maximum possible given the source data.
The sub-national level analysis is performed on a panel of SSA regions of the
Sub-national Economic Transformation Database [SETD] Beta Version, which has
been constructed specifically for this paper. The SETD Beta version comprises a
total of 122 different African regions8 across 8 countries9 in SSA. The sample pe-
riod, 1990 - 2018, corresponds precisely to the parent ETD. Appendix A presents
the SETD in some detail and provides some discussion of limitations and biases.
The ETD provides the dependent variable data for all of the national level specifi-
cations of this paper, the SETD provides the dependent variable data for all of the
regional level specifications. Structural change is the change in the relative sizes
of sectors of the economy, rather than their absolute levels; for this reason for use
in this paper the ETD and SETD were converted into sector shares by dividing
the sectoral employment and VA levels by the overall total employment and VA
levels, in each country-year.
The independent variables of interest are the flows of aid from varying sources,
drawn from foreign aid databases. Data for total DAC aid by recipient country
is from the OECD Statistics database and is in constant 2017 US dollars. As
the OECD does not provide DAC aid data disaggregated at the regional-recipient
level, sub-national analysis of the effects of ‘traditional’ aid is done using World
Bank aid, which is a component of total DAC aid. The data source for this is
the “World Bank Geocoded Research Release, Version 1.4.2” (AidData 2017b),
which is a database of individual World Bank aid projects geolocated to precise
recipient locations, with disbursment amounts. Similarly, all data for Chinese aid
comes from the “Geocoded Global Chinese Official Finance Dataset version 1.1.1”
database (AidData 2017a; Bluhm et al. 2018), which is a database of individual
Chinese aid projects geolocated to precise recipient locations, with disbursement
amounts, and individually verified to ensure the project was genuine and this dis-
bursement actually took place. Disbursement amounts are in constant 2014 dollars.
Both AidData (2017a) and (2017b) are maintained by the AidData research lab of
William & Mary University. In both cases, the individual projects were aggregated
upwards by hand such that they correspond to the recipient regions of the SETD;
in the case of the Chinese aid data, this was then additionally aggregated upwards
to the recipient country level.
8
Official administrative regions at the lowest level possible depending on the primary
source data.
9
Botswana, Ghana, Mauritius, Namibia, Nigeria, Rwanda, Tanzania, and Zambia.
12In the case of both the World Bank and Chinese geolocated aid, only verified
and completed projects are included. When projects spanned multiple years, they
are dated to the first year of actual aid flow. In the case of the Chinese aid, the
data is restricted only to DAC Official Development Assistance [ODA] equivalent
aid projects (Bluhm et al. 2018). ODA equivalent aid means only cash grants,
soft loans, or in-kind gifted resources are taken into account (Fuhrer 1996). This
ensures as precise as possible comparability between the aid flows from China and
the DAC, and therefore the analysis of Chinese aid does not include Chinese FDI,
or other forms of investment marked as aid. This paper therefore captures as far
as possible the effects of Chinese pure aid on the structure of the economy, and is
deliberately silent regarding the effects of Chinese investment.
The new instrumental variables developed in this paper exploit exogenous vari-
ation in the frequency and severity of natural disasters occurring in donor coun-
tries. The source of natural disaster data is the “Emergency Events Database”
(EM-DAT) maintained by the Université Catholique de Louvain; this provides a
complete list of all natural disasters recorded in each country, along with statistics
related to their severity. This data was used to construct two types of natural
disasters variable. Measures of the frequency of natural disasters occurring per
year in China and each donor country of the DAC10 are a pure count of the num-
ber of disasters occurring in each country. Measures of the severity of all natural
disasters occurring per year in China and each donor country of the DAC include
the total number of deaths due to natural disasters, the total value of damage from
natural disasters in constant US dollars, and the total number of people rendered
homeless by natural disasters. These variables are transformed with interactions
in the style of Nunn & Qian (2014), as detailed in section 4, to provide two instru-
ment sets; one each for Chinese and DAC aid.
This paper exercises two guiding principles over the parsimonious selection of
controls for the national level data: a) other theoretically established drivers of
structural change; and b) recurring controls from past aid effectiveness regressions.
There is some overlap between the two control sets. Income per capita (when not
used as the dependent variable) and population are among the most common con-
trols in aid effectiveness regressions, and are also the standard proxies for the
10
The DAC contains 30 full members, one of which is the European Union, which in
turn contains several smaller members. The DAC disaster index, construction details of
which can be found in section 5, therefore utilizes natural disasters data for a total of 37
countries. The full list of DAC donor countries, along with rules and requirements for
DAC aid, can be found in OECD (2021). China is not and has never been a member of
the DAC.
13category (i) ‘demand-side’ drivers of structural change11 . This data comes from
the Penn World Tables [PWT]. Category (ii), the ‘supply-side’ drivers, or changes
in relative sectoral productivity/prices, is proxied by the ratio of manufacturing to
agricultural sector productivity, which is calculated from the ETD. This is similar
to the ‘Unbalanced Productivity Growth’ indicator of Mensah (2020), although
he utilizes the productivity ratio of manufacturing to services. Category (iv), the
‘relative-trade’ drivers, or changes in comparative advantage, is proxied by the
ratio of total trade (imports plus exports as a share of GDP) in merchandise to
total trade in services, which is calculated using variables drawn from the World
Bank Development Indicators [WBDI].
Additional controls based on the aid effectiveness literature canon include a
conflict dummy, which takes the value one if the recipient country-year experienced
an internal or external conflict, and zero otherwise. This dummy is constructed
using data from the “Armed Conflict Dataset version 20.1” built by the Uppsala
Conflict Data Program and Peace Research Institute Oslo (UCDP/PRIO), and
maintained by Uppsala University (Gleditsch et al. 2001, Pettersson & Öberg
2020); and oil rents as a share of GDP, from the WBDI.
The sub-national level controls are Sub-national Human Development Index
[SHDI], as a measure for regional level of development, and regional population,
both from the “Global Data Lab Area Database version 3.6.0” [GDL], maintained
by Radboud University. Due to a lack of SSA regional data availability, there are
fewer controls at the sub-national level. In particular, it is not possible to include
the aforementioned drivers of structural change at the sub-national level. Whether
or not this is important depends on the extent to which these drivers differ between
regions within the same country. Production technology, and therefore relative
sectoral productivity, might be expected to be fairly constant across regions due
to technological diffusion. Nevertheless, Bloom et al. (2012) show that there can
be significant heterogeneity between productivity levels at different manufacturing
plants in developing country contexts. Trade variables may also vary between
regions within countries, especially when some regions are Special Economic Zones
[SEZ]. However, the SHDI implicitly controls for all of income level, education
(human capital) and health status, so the set of controls is larger than it may
appear.
11
As this purpose of this paper is not to trace out the ‘inverted U-Shape’ a la Rodrik
(2016), the quadratic of income per capita is not part of the standard set of controls,
however most findings are robust to its inclusion.
143.2 Descriptives
Table 1 presents summary statistics of the manufacturing shares12 , agricultural
shares, the logarithms or inverse hyperbolic sines [ihs] of the DAC and Chinese aid
variables, and the controls at the national-recipient level.
Table 1: Summary Statistics; National Level Data 1990-2018
Mean S.D. Min Max
Manu Share [EMP] 0.073 0.055 0.001 0.315
Manu Share [VAQ] 0.112 0.048 0.026 0.290
Agri Share [EMP] 0.579 0.228 0.067 0.949
Agri Share [VAQ] 0.230 0.147 0.021 0.696
DAC Aid (ln) 5.89 1.17 0.20 9.28
Chinese Aid (ihs) 1.68 2.88 0 11.16
GDP per capita (ln) 20.84 1.01 18.91 23.04
Population (millions) 26.88 33.77 1.06 190.9
Relative Prod (Man/Agr) 7.9 4.77 0.77 23.79
Relative Trade (Goods/Serv) 4.08 2.28 1.14 14.73
Conflict 0.20 0.40 0 1
Observations 501
Notes: Summary statistics for dependent variable, independent
variables of interest and all control variables used in the National
Level Analysis. All units and data sources are as collated in Ap-
pendix B. Observations refers to country-years, sample is Sub-
Saharan African countries from 1990 - 2018.
As Table 1 averages over both countries and time periods, much information
is lost in aggregation. Nevertheless, some important insights can be gleaned. The
average manufacturing share of value added is greater than the average share
of employment, whereas the average agriculture share of employment is (much)
greater than the average share of value added. This indicates the vast productiv-
ity difference between the two sectors, which is confirmed by the average relative
productivity ratio. Despite this, the average share of persons employed in agricul-
ture is much larger than of manufacturing, denoting the misallocation of labour
and the potential surplus employment in agriculture necessary in Lewis (1954) and
other two-sector models. Note that, as the sum of the average shares of manufac-
turing and agriculture are far below one for both employment and VA, the average
12
For reasons of brevity, only the employment and real value added share statistics are
shown.
15country year also has other relatively large sectors including trade services, public
sector, transportation, etc.
The average DAC annual aid flow to a recipient country is considerably larger
than the average Chinese aid flow, and the DAC has provided at least some aid
to every sample country in every sample year, whereas China has not. Despite
this, the standard deviation of Chinese aid flows is greater than of DAC aid, as
is the maximum aid disbursement, suggesting that Chinese aid flows are much
more volatile, and can be of an economic magnitude greater than the DAC. It
seems therefore that China is more specific in providing aid, and generally pro-
vides smaller amounts of aid than the DAC, but can on occasion provide very large
flows.
There is great heterogeneity in terms of the population sizes of the countries
in the sample, less in terms of GDP per capita, and, somewhat soberingly, 20%
of country-years saw some form of conflict. Table 2 splits the above summary
statistics into two time periods of equal length, 1990 - 2003, and 2004 - 2018,
omitting some of the controls. The reason for this split is to examine how much
changed between the first and second halves of the sample period. Chinese aid
is omitted for the first half of the sample, because the Chinese aid data sample
begins only in 2000.
Table 2: Summary Statistics; National Level Data 1990-2003; 2004-2018
Mean S.D. Min Max Mean S.D. Min Max
Man Share [EMP] 0.069 0.062 0.009 0.315 0.076 0.047 0.017 0.242
Man Share [VAQ] 0.121 0.054 0.026 0.283 0.115 0.046 0.037 0.290
Agri Share [EMP] 0.634 0.230 0.092 0.949 0.528 0.213 0.067 0.850
Agri Share [VAQ] 0.255 0.158 0.023 0.696 0.205 0.130 0.0210 0.530
DAC Aid (ln) 5.65 1.11 0.20 7.79 6.13 1.18 2.17 9.28
Chinese Aid (ihs) 2.76 3.43 0 11.16
Relative Prod 7.69 4.35 1.31 21.40 7.01 5.13 0.77 23.79
Observations 249 252
Notes: Summary statistics for dependent variable, independent variables of interest and
selected control variables used in the National Level Analysis. All units and data sources
are as collated in Appendix B. Observations refers to country-years, sample is Sub-Saharan
African countries split into two time periods; 1990-2003 and 2004-2018.
The differences between the two time periods are perhaps not as great as might
be expected. The average share of manufacturing is slightly higher in the second
16time period in terms of employment, and slightly lower in terms of constant VA;
the picture for industrialization on (unweighted) average is therefore sluggish at
best. The average share of agriculture, by contrast, is notably smaller in the second
half of the time period in terms both of employment and VA, suggesting significant
‘deagriculturalization’. The average relative productivity is slightly lower in the
second time period, but exhibits more variation. In terms of aid flows, DAC aid
flows have increased both on average and in terms of maxima and minima in the
second time period, and Chinese aid remains lower on average but more volatile
when just the second time period is considered.
Table 3 presents summary statistics of the manufacturing shares and agricul-
tural shares of employment, the inverse hyperbolic sines of the WB and Chinese
aid variables, and the controls at the regional-recipient level. The statistics are for
the largest time period available, and therefore do not always correspond; the WB
aid covers the time period 1995 - 2014, the Chinese aid 2000 - 2014.
Table 3: Summary Statistics; Subnational Level Data
Mean S.D. Min Max
Manu Share [EMP] 0.064 0.070 0 0.370
Agri Share [EMP] 0.559 0.282 0 0.980
WB Aid (ihs) 4.86 7.46 0 19.80
Chinese Aid (ihs) 0.64 1.76 0 7.83
SHDI 0.51 0.08 0.33 0.72
Population (millions) 1.71 1.54 0.04 9.29
Observations 2413 (SETD) 1880 (WB) 765 (Chn)
Notes: Summary statistics for dependent variable, independent variables of
interest and all control variables used in the Sub-National Level Analysis. All
units and data sources are as collated in Appendix B. Observations refers to
region-years, sample is Sub-Saharan African countries from 1990 - 2018, with
the World Bank and Chinese aid averages calculated from subperiods thereof.
From Table 3, it can be seen that Word Bank aid flows to regions are con-
siderably higher than Chinese, both on average, and at the maximum. Chinese
regional aid flows can be sizeable, but are on average quite small. Unlike at the
national level, there are regions at the lower bound in terms of manufacturing and
agriculture share (note that, as employment is measured in thousands, a share
of zero does not denote precisely zero workers). The average manufacturing and
agriculture shares are comparable to those at the national level.
17Turning now to the question of relative sectoral productivity, Figure 1 presents
an ascending bar chart of the average labour productivity levels at the national
level in 11 sectors of the ETD, omitting real estate. The width of the bars rep-
resent the average share of employment in each sector, and the dashed horizontal
line is the total average labour productivity.
Figure 1: Average Labour Productivity by Sector; National Level
From Figure 1 it can be seen that the average productivity of manufacturing is
above average, considerably higher than that of agriculture, and somewhat higher
than trade services. Manufacturing is by no means one of the highest productivity
sectors. Nevertheless, most sectors to the right of manufacturing in the bar chart
are very limited in their capacity to absorb labour, as illustrated by the relative
thinness of their bars. Utilities is a publicly funded natural monopoly, mining is
highly capital intensive, and business services and finance require high levels of
18human capital. For workers wishing to ‘move right’ from agriculture or trade ser-
vices, it is hard to envision that they could get much further than manufacturing
or transport, given their skills and human capital level and the labour demand of
the other sectors. The figure demonstrates the fact that deindustrialization will
be average productivity reducing, unless the displaced workers are able to move
to the industries on the right-hand side of the bar chart.
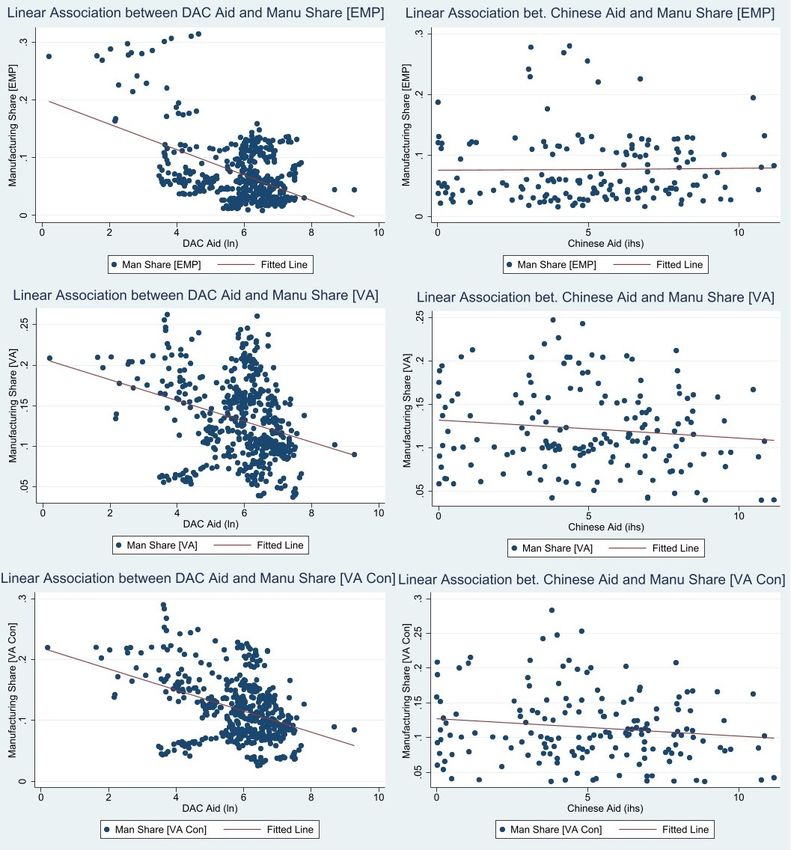
Figure 2 presents scatterplots and linear associations between a) DAC aid,
and b) Chinese Aid, and manufacturing share at the national level, across all
three manufacturing share measures (employment, nominal value added, and real
value added). The zero-aid-flows are omitted from the Chinese scatterplots, their
inclusion does not materially affect the trends of the best fit lines. From Figure
2, it can be seen that there is a strong negative association between DAC aid
and manufacturing share both in terms of employment and both types of value
added. No such association can be observed with the Chinese aid, or at best a
much more gentle negative association in the case of the VA shares. Whether or
not the negative association between DAC aid and manufacturing share represents
a causal affect of aid on industrialization will depend on more rigious econometric
identification techniques; it is also likely that the line of causation runs at least
in part the other way around - that DAC aid is targeted at less industrialized
recipients. Nevertheless, the difference between the patterns of DAC and Chinese
aid are noteworthy, regardless of the explanation. Either Chinese aid has less of a
causal impact on industrialization, or Chinese aid is not nearly so targeted at less
industrialized economies, or some combination of both; which of these options is
likely will emerge later from empirical testing, however, in any case, there is a clear
difference between DAC and Chinese aid which again points to the heterogeneity
of aid from these two different sources.
Figure 3 repeats the information of Figure 2, but now with both aid flows
and the manufacturing share (unweighted) averaged by country. Figure 2 also
omits the association between manufacturing share of current value added and
aid, for reasons of conciseness. The oberved best fit lines are broadly the same
when averaged by country, although the negative association between Chinese aid
and manufacturing share of VA is now steeper, albeit with the countries widely
dispersed around the best fit line. In terms of the effects of DAC aid, it can be seen
that Mauritius represents an outlier which an unusually high manufacturing share
and low dependence on DAC aid; this is in part responsible for the steepness of
the negative association. Omitting Mauritius results in negative associations which
are considerably flatter, although still distinctively downward sloping. There do
not appear to be any outliers at the other end of the aid distribution. Figure
194 presents scatterplots and linear associations between DAC aid and agricultural
share of employment and constant VA; the strong negative associations between
aid and manufacturing share observed in Figure 2 are mirrored by equally strong
positive associations between aid and agriculture share in Figure 4. Whether this
indicates an aid focus on more heavily rural countries, or of aid driving shifts to
agriculture, is a question which must be answered with econometric identification.
Appendix B collates a full list of all variables, units, and sources to act as a
reference point for interpretation of forthcoming regression results.
4 Empirical Methodology
4.1 Baseline Panel Regressions with Fixed Effects
The baseline specifications of this paper are panel fixed effects regressions. By
exploiting the panel structure of the data, many sources of endogeneity bias will
already be mitigated in these baseline specifications. It is not infrequent that
panel fixed effects is sufficient to capture causal identification, even when checked
against more sophisticated techniques; for example in the famous papers of An-
grist & Krueger (1991) and Angrist & Levy (1999), instrumental variables and
regression discontinuity designs respectively are used to confirm the accuracy of
many previousy established panel fixed effects results.
The procedure which will be employed to provide baseline estimates of the
effects of both DAC and Chinese aid on structural change will therefore be a panel
regression with a) country, and b) regional fixed effects. The basic structural
equation is as follows:
IndSharei,j,k,t = β1 Aidtr Dr Oth
i,t−n + ΨXi,t + γXi,t + ci + δt + i,t (1)
where the dependent variable IndSharei,j,k,t is the share of industrial sector
j ∈ (M AN, AGR)13 in total aggregate k ∈ (EM P, V A, V AQ), at time t in country
or region i. The dependent variable of interest is Aidtr
i,t−n , which is the nth lag
of either the transformed constant dollar flow of DAC or Chinese Aid to which a
logarithmic or inverse hyperbolic sine transformation has been applied (the super-
script tr denotes that a transformation is applied). The estimated coefficient β1
13
Whilst all the regressions in the main body of this paper utilize the manufacturing
or agriculture shares, some unreported regressions may be mentioned or discussed which
explore other sectors, in which case the sector set k expands.
20will therefore be the point estimate for the effect of aid on the relative size of the
dependent variable sector. The term ci captures the individual country or region
fixed effects and δt is a full set of annual time dummies with the first year excluded
as the baseline.
The dependent variable, sector shares, is a decimal percentage, and is there-
fore bounded between zero and one. This is similar to the case in Hamilton et
al. (2021), where the dependent variable was the urbanization rate expressed as
a percentage, and in Mensah (2020), which also explored the manufacturing share
of the economy. The former used a two-limit tobit model, censored both from
below and above (Cameron & Trivedi 2006), and the latter used the robust frac-
tional response method (Papke & Wooldridge 2008) as checks against the results
in the linear main specifications. In both cases, the results from these alternative
methods were extremely similar to the linear results. Few observations are at the
extreme bounds of the unit interval - none, in the case of the National Level data
- rendering linear estimation appropriate14 (von Hippel 2005). Therefore, this pa-
per opts to proceed exclusively with the linear panel fixed effects model. The data
required to calculate two-limit tobit estimations can be provided on request.
Finally, the decision was taken to set the appropriate lag length for the main
specifications of this paper to n = 4, i.e. to model the effects of aid on the structure
of the economy four years later15 . The issue of appropriately modelling the timing
of aid effects is thoroughly explored by Clemens at al. (2011), which makes the
point that studies which assume an approximately instantaneous effect of aid fail
to account for the fact that the mechanisms by which aid effects outcome variables
may be a drawn-out process. Structural change takes time; workers cannot switch
jobs instantly, and physical capital and plant require time to purchase, build,
and install. Using the lags of aid as the independent variable also helps mitigate
endogeneity biases arising from reverse causality. However, all output tables for
the panel fixed effects estimations will also present the contemporaneous results,
and in no case does the coefficient on the fourth lag qualitatively differ from that
on the third or fifth.
14
When the dependent variable is bounded on the unit interval, as is also the case in
probability models, the model is not linear and is instead underpinned by a sigmoidal
curve. However, the sigmoidal curve is quasi-linear except at the two extremes of the
interval. Therefore, linear estimation methods will only be widely inaccurate when there
is a large concentration of observations at the extremes of the unit interval, which is not
the case for either the national or subnational data of this paper (Hellevik 2007).
15
This is a little longer than the third lag used in Hamilton et al. (2021), however
extending to the fourth lag allowed for stronger instruments in the case of Chinese aid.
2122 Figure 2: Linear Associations between a) DAC Aid, and b) Chinese Aid and Manufacturing Share of i) Employment, ii) Current Price Value Added, and iii) Constant Price Value Added in SSA Sample; Zero Aid Flows excluded.
Figure 3: Linear Associations between DAC Aid and i) Employment, and ii)
Constant Price Value Added in SSA Sample.

    The set of controls, Xi,t , is split into two vectors; X Dr and X Oth . The former
vector contains theoretically established drivers of structural change; these controls
mitigate omitted variable bias and refine precision of the estimator, but also allow
for benchmarking the magnitude of the aid effects. Therefore, their coefficients
Ψ will be reported in the output tables. The latter vector contains those other
controls mentioned in section 3; as these controls are included only for reasons of
precision and unbiasedness, their coefficients are omitted from the output tables.
All variables and units are as collated in Appendix B.

                                         23
Figure 4: Linear Associations between DAC Aid and i) Employment, and ii)
Constant Price Value Added in SSA Sample.
4.2 Potential Sources of Endogeneity Bias
There are three potential sources of endogeneity bias: reverse causality, omitted
variable bias, and measurement error. Reverse causality would occur when changes
in the manufacturing share cause changes in the inflows of aid, rather than the
other way around. This is a highly plausible source of endogeneity bias in the
case of both DAC and Chinese aid, as aid could be targeted specifically at coun-
tries with a lower manufacturing share either directly, because the intention is to
boost lagging manufacturers, or indirectly, if industrial level is seen as a proxy
for development. This is even more likely to occur at the regional level, whereby
regions with underdeveloped industry are likely to be preferred for aid projects.
Omitted variable bias occurs when there is a latent third variable which causally
drives both aid disbursement and the manufacturing share; for example recipient
country political policy or even political competence. More competent leaders may
be more successful both at developing manufacturing and lobbying for aid - this
is especially likely at the regional level, where the connections of local leadership
to the central government is likely to influence both aid allocation and industrial
investment inflows. Finally, measurement error occurs when either the dependent
variable or the independent variable of interest are measured imprecisely. Whilst
the ETD and SETD use the most precise methods available, there may be im-
precision in the primary source data, especially when this data is labour force
surveys from which national shares are based on a sample rather than the entire
population. In terms of the independent variable of interest, measurement error
is unlikely to be a large issue with the DAC aid flows or with the World Bank
24regional aid data, but there may be an issue with the Chinese aid data. To the
extent that such resulting measurement error represents classical measurement er-
ror, i.e. that the degree of measurement error is independent of the true/latent
value, this would lead to attenuation bias (Schennach 2016). This may imply that
findings of null effects in fact mask small but true effects; the fact that there is a
higher potential for measurement error in the Chinese than DAC aid data might
therefore be one explanation for why the best fit lines in Figure 2 are flatter for
Chinese aid. There may also be some measurement error which is non classical;
for example if smaller aid projects are more likely to be misreported or are more
difficult to trace and verify than large ones.
4.3 A New Instrument for DAC Aid
Whilst panel fixed effects estimations go a long way towards removing endogene-
ity biases, they are usually insufficient on their own to provide unambiguously
causal estimates of independent variable effects. The fixed effects transformation
with time dummies removes all biases from time-invariant country/region hetero-
geneity and time-variant country/region homogeneity, but not from time-variant
country/region heterogeneity. Biases of this latter category could stem from id-
iosyncratic shocks which affect some but not all of the countries in the sample,
such as changes in political leadership or specific climate events. It is not difficult
to envision how such shocks could be relevant to the relationship between aid and
structural change. For example, an earthquake or hurricane in one or more coun-
tries of the sample could both destroy manufacturing capital and displace workers,
and trigger a large influx of foreign aid16 . Even in a panel FE regression, it could
mistakenly appear that the influx of foreign aid caused the deindustrialization.
It is for reasons such as these that instrumental variable strategies have become
standard practice in the aid effectiveness literature, as discussed in section 2. In
brief, IV techniques seek to uncover ‘instrumental variables’ which are plausibly
exogenous sources of variation in the independent variable of interest which have
no statistical relationship with the dependent variable, except through this inde-
pendent variable. The asymptotic consistency of the effect-size estimates resulting
from IV estimations is completely dependent upon the instrument(s) being valid.
If, however, the instruments used are valid, the point estimates of the coefficients
are consistent even in the absence of controls (Angrist & Pischke 2009). Controls
16
The use of fourth lags rather than contemporaneous relationships does however help
to remove biases of this type; in the earthquake example, the earthquake would have had
to influence the manufacturing share four years on for it it to bias the panel fixed effects
point estimate.
25You can also read