PERFORMANCE EVALUATION OF USAID/ZAMBIA'S COMMUNITY FORESTS PROGRAM
←
→
Page content transcription
If your browser does not render page correctly, please read the page content below

PERFORMANCE EVALUATION OF
USAID/ZAMBIA’S COMMUNITY FORESTS
PROGRAM

January 2019

This publication was produced at the request of the United States Agency for International Development
(USAID) and made possible by the support of the American People through USAID. The contents of this
publication are the sole responsibility of Integra LLC. The authors’ views expressed in this publication do
not necessarily reflect the views of USAID or the United States Government.

                                                        1
FINAL EVALUATION REPORT

PERFORMANCE EVALUATION OF USAID/ZAMBIA’S
COMMUNITY FORESTS PROGRAM

Contract Title:                 LEAP III: Learning, Evaluation and Analysis Project

Contract Number:                GS-10F-083CA / 7200AA18M0004

Activity Number:                LEAP III 2018-02

Submitted:                      January 18, 2019

Contractor:                     Integra Government Services International LLC
                                1100 Vermont Avenue NW, Suite 750
                                Washington, DC 20005

USAID Office:                   USAID/Zambia, Office of Economic Development

DISCLAIMER
This publication was produced at the request of the United States Agency for International Development
(USAID) and made possible by the support of the American People through USAID. The contents of this
publication are the sole responsibility of Integra LLC. The authors’ views expressed in this publication do
not necessarily reflect the views of USAID or the United States Government.

                                                     2
TABLE OF CONTENTS
ACRONYM LIST                                     3
1. EXECUTIVE SUMMARY                            5
1.1 BACKGROUND OF THE PROJECT                   5
1.2 EVALUATION PURPOSE                          5
1.3 METHODOLOGY                                 5
1.4 CONCLUSIONS                                 7
1.5 RECOMMENDATIONS                             7

2. INTRODUCTION                                 8
2.1 BACKGROUND OF THE PROJECT                   8
2.3 EVALUATION PURPOSE                          9
2.4 EVALUATION QUESTIONS                        9

3. EVALUATION METHODOLOGY AND LIMITATIONS       10
3.1 DATA COLLECTION METHODS                     10
3.2 DATA ANALYSIS METHODS                       12
3.3 ASSUMPTIONS AND LIMITATIONS                 12
3.4 DATA STORAGE                                13

4. EVALUATION FINDINGS                          14
EVALUATION QUESTION 1.                          14
EVALUATION QUESTION 2.                          23
EVALUATION QUESTION 3.                          24
EVALUATION QUESTION 4.                          26
EVALUATION QUESTION 5.                          31

5. CONCLUSIONS AND LESSONS LEARNED              33
6. RECOMMENDATIONS                              35
ANNEX I: REFERENCES                             38
ANNEX II: GIS DATA                              40
ANNEX III: KII INTERVIEW GUIDE                  49
ANNEX IV: FGD SEMI-STRUCTURED INTERVIEW GUIDE   52
ANNEX V: LIST OF KIIS                           54
ANNEX VI: SUMMARY OF FGD RESULTS                59
ANNEX VII: STATEMENT OF CONFLICT OF INTEREST    63
ANNEX VIII: STATEMENT OF WORK                   64
ANNEX IX: APPROVED WORK PLAN                    75

                                   3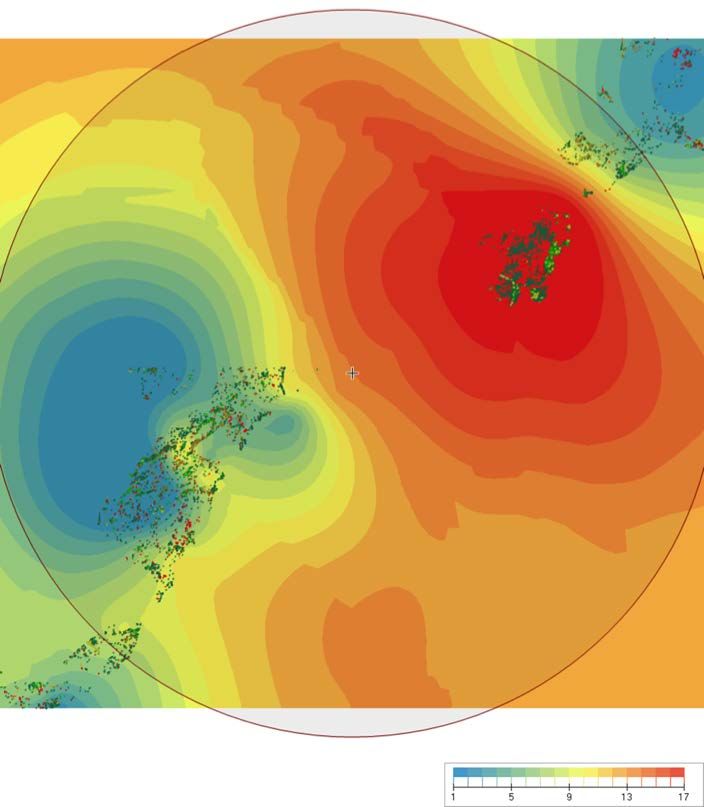
ACRONYM LIST
BCP       BioCarbon Partners
CBO       Community Based Organizations
CFMG      Community Forest Management Group
CFP       Community Forests Program
CIFOR     Center for International Forestry
COMACO    Community Markets for Conservation
CRB       Community Resource Board
DNPW      Department of National Parks and Wildlife
EC-LEDS   Enhancing Capacity for Low Emission Development Strategies
EQ        Evaluation Questions
ERPA      Emissions Reductions Purchase Agreement
FD        Forestry Department
FGDs      Focus Group Discussions
FPIC      Free Prior and Informed Consent
GHG       Greenhouse Gas
GRZ       Government of Zambia
KII       Key Informant Interviews
M&E       Monitoring and Evaluation
MoA       Ministry of Agriculture
NGOs      Non-Governmental Organizations
NRZ       New Rotations Zambia
NTFP      Non-timber Forest Product
REDD+     Reduced Emissions from Deforestation and Forest Degradation
SI        Statutory Instrument
SOW       Scope of Work
USAID     United States Agency for International Development
VAG       Village Action Group
WB        World Bank
ZAWA      The Zambian Wildlife Authority

                                      4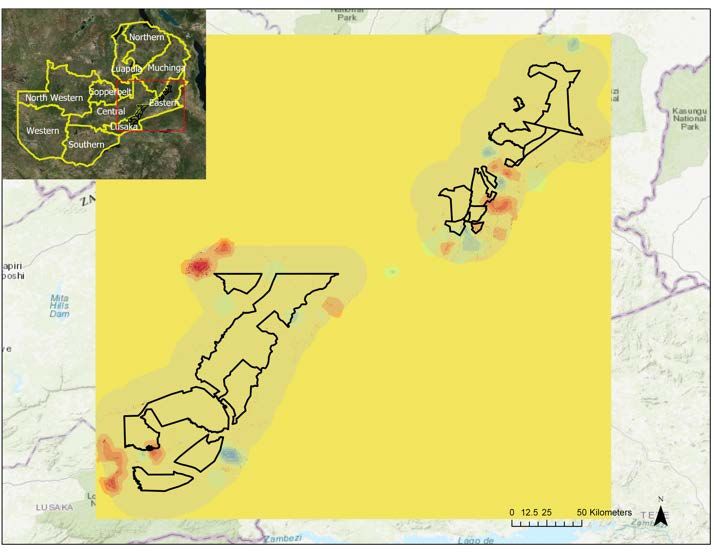
1. EXECUTIVE SUMMARY
1.1 BACKGROUND OF THE PROJECT
In February 2014, USAID/Zambia awarded a Cooperative Agreement to BioCarbon Partners, Ltd. (BCP)
to implement the Community Forests Program (CFP) in Zambia. The CFP was designed to support the
Government of the Republic of Zambia’s (GRZ) Reducing Emission from Deforestation and Degradation
(REDD+) strategy by establishing the largest REDD+ program to date in Zambia. The CFP aimed to
establish REDD+ project areas across a minimum of 700,000 hectares within the Zambezi and Luangwa
Valley ecosystems, and in so doing, incentivize better forest management on a total of up to two million
hectares, involving up to 10,000 households (BCP 2017 Annual Report).
The CFP is intended to reduce emissions from deforestation through participatory natural resource
management of globally biodiverse and significantly forested landscapes. To accomplish this, the CFP
included a full suite of activities to help develop, manage, and maintain a comprehensive community forest
management and REDD+ project. Specifically, the CFP included components in stakeholder consultations,
livelihood improvements, forest management, forest carbon science, carbon market creation, and
engagement with the Government.

1.2 EVALUATION PURPOSE
This evaluation will provide USAID/Zambia with an independent review of progress made by the
USAID/Zambia CFP project, and identify lessons that can be applied, as appropriate, to future activities in
the sector. The evaluation has three main objectives, to:
    1. Document the overall effectiveness of the project in reducing deforestation of biologically
       significant forest landscapes;
    2. Identify lessons learned from the project—specifically, the strengths and weaknesses of the design
       and implementation of the CFP, and how they contributed to project’s successes and challenges;
       and
    3. Assess the sustainability of CFP results related to forestry conservation. That is, are the gains and
       successes of the CFP likely to continue after the end of the project?

1.3 METHODOLOGY
The performance evaluation used a mixed methods approach, where qualitative and quantitative data
collection methods were combined to answer the evaluation questions. The evaluation team used baseline
data from internal sources, including routine monitoring reports, annual reports, and implementer
monitoring plans, to establish baseline conditions and measure performance over the project lifetime. The
team supplemented this data with external materials, including published literature, third-party reporting
and open databases, and data collection through key informant interviews (KIIs) and focus group
discussions (FGDs) to address the remaining questions.

                                                     5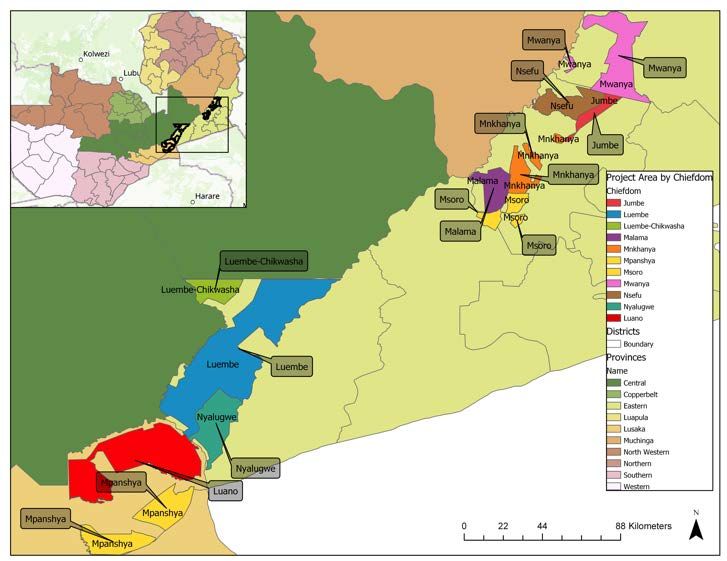
FIGURE 1 - SUMMARY OF FINDINGS

Evaluation Question (EQ)               Summary of Findings
EQ1: To what extent has CFP            Strengths
activities resulted in reduction       • The project appears to have had a positive impact on limiting deforestation.
in deforestation in the areas          • CFP’s strong bonds with local leaders encouraged forest conservation.
where        activities    were        • CFP responded to the threat of forest encroachment from migration.
implemented?                           Weaknesses
                                       •   CFP provided limited attention to alternative livelihoods.
                                       •   Community conservation payments (conservation fees) were insufficient
                                           to positively impact households.
                                       • CFP progress was impeded by limited project sensitization at the
                                           community level over time.
EQ2: To what extent are key            Strengths
stakeholders satisfied with            •   GRZ line ministries, Community Resource Boards (CRBs), and village
CFP’s approach to resolving                leaders thought that CFP positively influenced the development of
policy issues?                             community forests and carbon management policies.
                                       • CFP helped to resolve policy issues by assisting the GRZ in formalizing
                                           forest conservation policies, including inputs on two statutory instruments
                                           (SIs).
EQ 3. How have stakeholders            Strengths
perceived the CFP’s efforts in         • The CFP was successful in building capacity within the targeted GRZ field
building capacity of government          offices, and with several CRBs. The local staff were usually well-versed in
and           community-based            REDD+ concepts, understood the agreements with BCP, and had realistic
organizations at the national,           expectations of how things might develop with carbon trading in the future.
provincial, district and local         Weaknesses
level to develop and implement
                                       •   Only about a half of FGD groups were aware of benefit sharing
REDD+ strategies?
                                           agreements, and the majority of the FGD respondents were unaware of
                                           existing forest management plans.
EQ4: To what extent are the            Strengths
systems and processes that CFP         •   At the central, provincial, and district levels, the GRZ is supporting
put in place to ensure technical,          REDD+.
financial, social, and institutional   • The communities involved with the CFP are generally open to continue to
sustainability, being adopted by         be engaged in REDD+ process.
institutions at the provincial,        Weaknesses
district, and local levels?
                                       •   The community members were mostly unhappy with the systems put in
                                           place by CFP to distribute conservation funds.
EQ5: How can BCP maintain              CFP planned for funding diversification and has begun developing alternative
the gains achieved under the           sources of funding. The sustainability of REDD+ efforts started under CFP is
CFP?                                   dependent on:
                                       •   Both BCP’s financial standing and their ability to continue to manage
                                           related activities and interact with the communities.
                                       •   The development of the international market for carbon offsets.
                                       •   The community and CRB’s commitment to conserving the forests.

                                                            6
1.4 CONCLUSIONS
Overall, the evaluation team concludes that the CFP was successful in building the
foundational layers of capacity necessary to manage REDD+ projects at the national and
district levels, and to a limited extent, the local/village levels.
The CFP is a groundbreaking project, because it was one of the first REDD+ projects funded by USAID
to have forest carbon offsets verified and sold1, and one of the very few REDD+ projects implemented in
a dry tropical forest. It was also groundbreaking because the implementing partner, BCP, was a private
African-based company and not a traditional international development implementing partner.
This performance evaluation produced several broad findings and lessons for future programming.
       •   Capacity building for GRZ officials: CFP supported the GRZ in the writing of two national
           policies (statutory instruments) on managing carbon stocks and community forests. The evaluation
           team found strong evidence of capacity building around REDD+ throughout the GRZ.
       •   Low levels of alternative livelihood training: BCP concentrated their forest conservation
           efforts, due to the carbon verification process and limited funds, more on carbon management
           than alternative livelihoods development. A quarter of FGDs reported not receiving any
           alternative livelihood trainings, including a third of the female-focused FGDs.
       •   Community engagement: After a strong initial Free Prior and Informed Consent (FPIC)
           process, the project reduced its engagement/sensitization at the community level over the long
           term. As a result, there was, and still is, confusion and misunderstanding about what the CFP is
           and what BCP does.
       •   Financial uncertainties related to climate politics/markets: The essence of the CFP is to
           incentivize forest conservation by using funds generated from the sale of “forest carbon offsets”
           in climate change mitigation projects. The sustainability of this concept is dependent in part on
           the capacity and perseverance of BCP, and on the political mandate of national and local
           institutions involved with the project. However, the sustainability of the project is also dependent
           on the price of carbon – which in turn is dependent on how the world approaches the issue of
           climate change over the next five to ten years. This is obviously outside of the influence or control
           of BCP.

1.5 RECOMMENDATIONS
USAID/Zambia should consider options for maintaining and enhancing the gains achieved under CFP. This
might be accomplished by providing additional short-term support directly to BCP, or indirectly, through
ancillary support to organizations involved with conservation or alternative livelihoods in the CFP area.
USAID should also note that although BCP is a leader in REDD+ implementation in Zambia, they are not
the only player. USAID could provide support to strengthen a larger segment of REDD+ proponents –
including not only BCP but also organizations focused on conservation and alternative livelihood
opportunities like Bee Sweet, Community Markets for Conservation (COMACO), and SNV Netherlands.

1   Along with the BioREDD Project in Colombia and the TIST project in Kenya.

                                                              7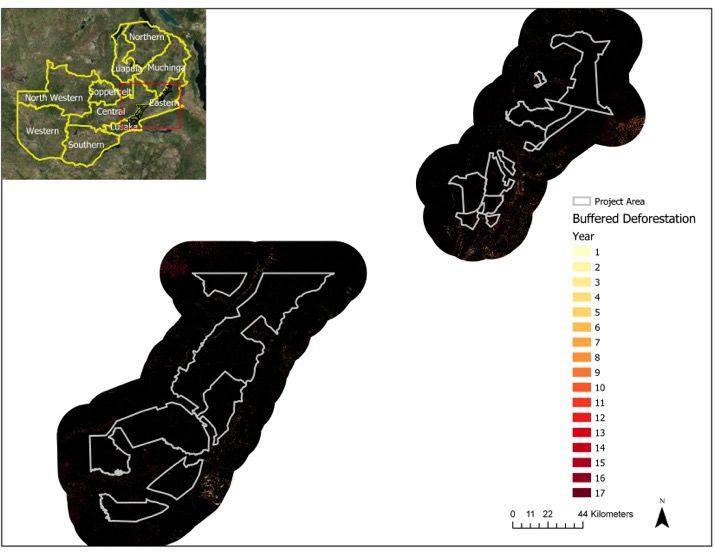
2. INTRODUCTION
The evaluation report follows the standard USAID evaluation reporting template. We separate the
evaluation into four sections: 1) Introduction, 2) Evaluation Methodology and Limitations, 3) Findings and
Conclusions, and 4) Recommendations. In the Introduction section, we outline the project, describe the
purpose of the evaluation, and present the evaluation questions. The Evaluation Methodology and
Limitations section describes our approach and the limitations to our strategy. In our Findings and
Conclusions section, we present the key findings of our evaluation, discuss their implications, and
summarize our main conclusions. Finally, we present recommendations for future action.

2.1 BACKGROUND OF THE PROJECT
USAID/Zambia awarded a Cooperative Agreement to BCP to implement the CFP project in Zambia. The
CFP began on February 1st, 2014 and is expected to run until January 31st, 2019. The Forestry
Department (FD) and the Department of National Parks and Wildlife (DNPW) were key GRZ ministries
working with BCP on CFP.
The CFP is designed to exemplify and support the GRZ’s REDD+ strategy by establishing the largest
REDD+ program to-date in Zambia. The CFP aims to establish REDD+ project areas across a minimum
of 700,000 hectares within the Zambezi and Luangwa Valley ecosystems, and in so doing, incentivize better
forest management on a total of up to two million hectares, involving up to 10,000 households. CFP
exceeded these minimum requirements by helping to conserve over a million hectares of forest and
assisting over 28,000 households. A detailed overview of CFP’s project areas/chiefdoms and ecological
environment are presented in Annex II. CFP’s main objectives are to:
    1. Reduce emissions from deforestation through participatory management of natural resources in
       globally biodiverse and significantly forested landscapes;
    2. Reduce poverty through improvements in smallholder farmers’ agricultural productivity;
    3. Develop non-timber forest products (NTFP) and expand their markets and value chains; and
    4. Support the GRZ in the development of a legal framework and pilot project to demonstrate the
       viability of REDD+ as a replicable forest management strategy.
To accomplish this, the CFP included a full suite of activities to help develop, manage, and maintain a
comprehensive community forest management and REDD+ project. Through a range of stakeholder
consultations, forest management, and policy engagement, CFP conducted a number of activities, which
include: empowering and equipping communities to lessen the drivers of deforestation through CRB
trainings, forest demarcation, use of local conservation funds, and breach action tools; establishing and
improving forest and natural resources management plans; promoting alternative livelihoods in lieu of
unsustainable charcoal and timber production; and implementing pay-for-performance and revenue sharing
programs for forest conservation and carbon sequestration.
CFP worked closely with CRBs to engage with villages in the project areas. CRBs are composed of Village
Action Group (VAG) members. Each VAG elects a representative to the local CRB. An “average”
Chiefdom may have one CRB with 8-12 members, depending on the size of the Chiefdom. A VAG usually

                                                    8
represents 7-10 villages.2 CRBs serve as a mechanism for the GRZ to connect and consult with
communities on natural resources management. The GRZ created the CRBs in 1998 through the Wildlife
Act, when the CRBs replaced the six Area Development Committees, and Local Leader Committees were
abolished. By instituting CRBs, the GRZ increased local authority and control over natural resources.

2.3 EVALUATION PURPOSE
The purpose of this performance evaluation of USAID/Zambia’s CFP is to provide an independent review
of progress made by this important project, and identify lessons that can be applied, as appropriate, to
future activities in the sector.3 The evaluation has three main objectives:
    1. Document the overall effectiveness of the project in reducing deforestation of biologically
       significant forest landscapes;
    2. Identify lessons learned from the project—specifically, the strengths and weaknesses of the design
       and implementation of the CFP, and how they contributed to project’s successes and challenges;
       and
    3. Assess the sustainability of CFP results related to forestry conservation. That is, are the gains and
       successes of the CFP likely to continue after the end of the project?

2.4 EVALUATION QUESTIONS
USAID/Zambia provided five key evaluation questions (EQs) to be answered during this performance
evaluation. These questions were divided into two overarching topics: lessons learned and sustainability.
FIRST OVERARCHING TOPIC: LESSONS LEARNED

EQ1: To what extent has CFP activities resulted in reduction in deforestation in the areas where activities
were implemented?
EQ2: To what extent are key stakeholders satisfied with CFP’s approach to resolving policy issues?
EQ3: How have stakeholders perceived the CFP’s efforts in building capacity of government and
community-based organizations at the national, provincial, district and local level to understand REDD+
and to develop and implement REDD+ strategies and action plans?
SECOND OVERARCHING TOPIC: SUSTAINABILITY

EQ4: To what extent are the systems and processes that CFP put in place to ensure technical, financial,
social, and institutional sustainability, being adopted by institutions at the provincial, district, and local
levels?
EQ5: How can BCP maintain the gains achieved under the CFP?

2 For example, in Mambwe District, Jumbe Chiefdom has 9 VAGS and Nsefu Chiefdom has 5 VAGS.
3 It is important to note that this is not an evaluation of the CFP’s effectiveness in reducing greenhouse gas (GHG) emissions.
Such an assessment is a function of the REDD+ project monitoring and verification process and should address the possibility of
the “leakage” of emissions through deforestation displaced to areas outside the intervention sites. This assessment addresses the
management of the site itself. Use of this report to draw conclusions on GHG reductions would be inappropriate.

                                                               9
3. EVALUATION METHODOLOGY
AND LIMITATIONS
3.1 DATA COLLECTION METHODS
Breakdown of stakeholder
The evaluation used a non-experimental, observation-based design to
meetings:
conduct this performance evaluation. Specifically, we implemented a
mixed methods approach to evaluate CFP, where we combined ● 50 separate KIIs
meetings;
qualitative and quantitative data collection methods to answer the EQs.
● 88 FGDs (in 45 villages);
The evaluation team focused on four data collection methods to conduct
the CFP evaluation: ● Over 900 community
members reached;
Desk and literature review: The evaluation team used baseline data ● 19 CRB members
from internal sources, such as project documents, published literature, interviewed;
third-party reporting, and open databases, to establish objective baseline ● 22 Government officials
descriptions of the project’s operating environment. Annex A contains interviewed.
a complete list of the documents reviewed.
Quantitative Data Collection (GIS Data Sets / Reports / Maps): In conjunction with the desk
review, the evaluation team collected and analyzed publicly available GIS data and requested additional
data from USAID and BCP. This data was used to create, to the extent possible, a statistical and spatial
picture of project location, data collection sites, and selected outputs and outcomes from the CFP,
including: jurisdictions impacted by the project; locations of land; locations of focus group discussions; and
changes in deforestation rates over the life of project in comparison to deforestation rates before the
project. These maps enabled the fieldwork to concentrate on areas of most and least deforestation within
the CFP areas.
Key Informant Interviews (KIIs): Following USAID/Zambia’s KIIs conducted:
guidance, combined with the team’s own research, the evaluators
identified a list of key informants to interview. These included people ● 11 development partners
and NGOs
from GRZ line ministries, other donors, Non-Governmental
● 2 private sector
Organization (NGOs), and private companies involved in the technical companies
sectors and geographical areas of the CFP, CRBs, local leaders,
● 14 central, provincial and
USAID/Zambia, USAID/Washington, and current and past BCP district officials
employees. The evaluation team conducted 50 KIIs with a variety of key ● 12 local authorities
stakeholders. Most KIIs lasted no longer than 60 minutes to respect the ● 11 current and former
respondents’ work obligations. Data collection was done using mobile BCP staff
devices (tablets and smart phones), when appropriate. Prior to each
interview, the team reviewed the KII protocol and determined which questions to focus on for the
interviewee. Based on conversations with USAID/Zambia, the evaluation team prioritized interviews with
the CRB members, current/former employees of BCP, and stakeholders from various levels of
government. The final list of KIIs is provided in Annex F.
Focus Group Discussions (FGDs): Data collection in the field occurred over a two-week period
between September 3 -15 in the project areas in Nyimba, Mambwe, Rufunsa and Lundazi (see Figure 2).
10FIGURE 2: LOCATION OF FGDS
To capture a diverse sample of beneficiaries, and to ensure proficiency in Nyanja, the evaluation team
contracted with a Zambian data collection firm, RuralNet, which has extensive experience conducting
surveys in Zambia.4 Technical Coordinators were appointed for each of the four specified districts
(Mfuwe/Lundazi, Nyimba, and Rufunsa) and each coordinator oversaw a team of three junior level research
assistants. Before conducting FGDs, the field teams paid courtesy calls to the local chiefs. The chiefs then
allowed the teams to conduct the FGDs in their areas. The field teams conducted 88 FGDs in a total of
45 villages, with separate FGDs for men and women in nearly each village.
The FGDs generally lasted between 1-2 hours, depending on the size of the group and interest of the
interviewees.5 Since time and budget constraints prevented the field teams from conducting FGDs in all
CFP communities, the evaluation team developed an FGD sampling strategy based on a combination of
BCP implementation information and GIS deforestation data. Based on guidance from USAID/Zambia, an
4 Most recently, RuralNet conducted a baseline survey for over 3,500 households in Zambia as part of the USAID/STARR
Evaluation, Research and Communication project.
5 At the beginning of each FGD, the participants were provided information about note-taking and recording, and clear instructions
around the participants’ right to leave the conversation at any time. The FGD leader took GPS coordinates and outlined the
discussion topics. FGD leaders identified participants by number, rather than name, to ensure anonymity.
11effort was made to ensure FGD representation from all four district project areas namely Rufunsa,
Nyimba, Mambwe/Mfuwe and Lundazi.
3.2 DATA ANALYSIS METHODS
The evaluation team took detailed written notes at all FGDs and KIIs (with consent), to allow the team
to accurately report on the responses. The enumeration team also recorded the FGDs for response
summary purposes. The teams collecting the FGD explained in detail that the recordings would not be
shared beyond the data collection team and that they would be deleted after the team summarized the
FGD responses. The data collection team used safeguards like assigning FGD participants numbers instead
of using their names, to ensure the respondents were comfortable with sharing their true opinions. Where
appropriate, the team hand-coded the responses to transform these qualitative data into quantitative
tabulations.
The evaluation team directly linked each question in the KII and FGD protocols to one of the five EQs.
The evaluation team also used GIS analysis to spatially benchmark question responses. In addition to the
KII, FGD, and GIS, the evaluation team incorporated desk review results and conducted site verification
trips in the field. This triangulation process is designed to ensure the independence and robustness of the
team’s evaluation findings. We describe our analytical techniques for each question, along with their
limitations and underlying assumptions, in the Assumptions and Limitations section below.
3.3 ASSUMPTIONS AND LIMITATIONS
This evaluation methodology described above has, as described below, underlying assumptions and
limitations specific to the various evaluation questions.
EQ 1. To what extent have CFP activities resulted in reduction in deforestation in the areas
where activities were implemented?
Attributing the success of a project is difficult within a performance evaluation, where there is no
counterfactual (or control group) with which to compare. In this instance, the evaluation team assumed
that analysis of available GIS data would be adequate to identify appropriate target areas for FGDs, and to
measure deforestation rates. Our evaluation strategy hinged on the willingness of properly contextualized
community members and other key stakeholders to openly discuss their perceptions of CFP, BCP, CRBs,
and deforestation in general. Finally, we assumed that our data collection strategy, including FGD and KII
fieldwork, would provide us with a sufficient number of responses to address this question.
Without a counterfactual, our findings are correlational, which means we are unable to directly attribute
changes we observed to the project. Our evaluation strategy assumes that we undertook sufficient data
collection through KIIs and FGDs to allow us to understand both the extent of CFP activities and the
relationship between those activities and deforestation within the implementation areas.
EQ 2. To what extent are key stakeholders satisfied with CFP’s approach to resolving policy
disputes?
Our key assumption for EQ2 is that key informants would speak freely. The evaluation team assumed that
we identified the appropriate key stakeholders and that they understood the policy issues. Our response
to this question is based on the answers that these key stakeholders were willing to share with us, along
with the documentation we reviewed.
12EQ 3. How have stakeholders perceived the CFP’s efforts in building capacity of government
and community-based organizations at the national, provincial, district, and local level to
understand REDD+ and to develop and implement REDD+ strategies and action plans?
There are several limitations to the measurement of CFP’s capacity building efforts across multiple layers
of government and Community Based Organizations (CBOs).
1. We assume that we adequately identified stakeholders from these four layers of government.
2. Given the limited time, we were restricted to assessing their understanding of REDD+ to FGD
and KII conversations.
3. REDD+ projects are long-term endeavors and the actual outcomes of the project will not be
known until carbon offset credits are sold and change in forest cover is tracked over the long
term.
4. Communicating with local stakeholders can be difficult. Even when focusing on fundamental
capacity building activities, like trainings, we found that respondents often did not know that the
training they attended was funded or organized by CFP. Thus, there is a risk that some of the CFP
capacity building work would have been under-appreciated within the KIIs.
The evaluation team faced similar limitations when evaluating capacity building and the understanding of
REDD+ among CBOs and other local organizations. Some of these organizations competed for the CFP
implementation contract and lost or expected to be involved in the implementation and were not used.
We assumed that we identified and spoke with an adequate number of CBO representatives and that
these representatives accurately responded to our questions.
EQ 4. To what extent are the systems and processes that CFP put in place to ensure
technical, financial, social, and institutional sustainability being adopted by institutions at the
provincial, district, and local levels?
The team assumed that we received adequate documentation and spoke with sufficient people to answer
this evaluation question. As mentioned earlier, as CFP is still being implemented. It is difficult to measure
adoption over the relatively short span of time, and the full impact of CFP activities might not be observed
for several years. Measuring adoption at four levels of institutions also requires responses from a range of
GRZ stakeholders.
EQ 5. How can BCP maintain the gains achieved under the CFP?
BCP is a private company and the evaluation cannot conclusively ascertain their capacity, intentions and
aspirations. This evaluation assumes that we received adequate and accurate information from BCP on
their current and future financial situation. We assessed carbon market opportunities based on our finite
knowledge of Zambian opportunities. Our conclusions and recommendations are naturally restricted
given the underlying volatility in the carbon markets and our limited access to financial projections of
carbon pricing.
3.4 DATA STORAGE
During this evaluation, the evaluation team collected notes on 50 KIIs and 88 FGDs. The anonymized files
including the results of the KII and FGD interviews and the GIS information for each of the FGD locations
will be stored on a secure cloud server for the indefinite future.
134. EVALUATION FINDINGS
This section of the report is organized according to the five key EQs. The evaluation team based their
findings on field data collection and analysis, a review of relevant publications, and their experience
designing, managing, and implementing USAID-funded community forestry and REDD+ projects.
EQ1. TO WHAT EXTENT HAVE CFP ACTIVITIES RESULTED IN A REDUCTION IN
DEFORESTATION IN THE AREAS WHERE ACTIVITIES WERE IMPLEMENTED?
The CFP utilized various mechanisms to reward communities for setting aside forests for conservation
and curbing deforestation. These mechanisms included community partnership projects (as identified and
prioritized collaboratively by the local communities in the various chiefdoms, Chiefs and the CRBs), the
payment of conservation fees, public outreach on the importance of forest conservation, and capacity
building activities related to forest governance. Despite these efforts, some communities continued to
show deforestation and/or forest degradation within their set-aside forested areas. The objective of this
EQ is to understand to what extent CFP activities have resulted in a reduction in deforestation rates and
why the mechanisms that CFP utilized were only effective in some communities.
The scope of this evaluation, and the emphasis on qualitative, rather than quantitative findings, make it
difficult to definitively state where CFP reduced deforestation and by how much. Documentation from
BCP suggests that deforestation rates slowed within the project areas.6 The assessment team was also
able to use available GIS data to quantify patterns of deforestation in project areas. The analysis of the
data, combined with FGDs, KIIs, and the team’s professional experience, identifies several important
factors that may have impacted the efficacy of CFP interventions on deforestation.
Deforestation Overview
To understand CFP’s strengths and weaknesses, one must first have a sense of the state of deforestation
in and around the project areas. While we cannot present causal interpretations for our deforestation
findings, our GIS analysis provides an overview of deforestation in the CFP areas. Figure 3 shows that
deforestation rates in and around the CFP areas are generally on an upward trend. We include some
additional information on deforestation in Annex II, where Figure 16 and Figure 17 depict the current
state of deforestation in the CFP areas and buffer zones as of 2017.
Recent increases in deforestation rates are of concern, however, the project timeframe was relatively
short and there are many factors that may contribute to changing rates of deforestation. In our discussion
of the EQs, we present some reasons for why CFP’s activity might not have stopped deforestation in
project areas.
6 As a baseline evaluation was conducted, the evaluation team understands that a quantitative impact evaluation of CFP will be
conducted in the future. An impact evaluation would be able to assess and attribute changes in deforestation rates to the project,
given an adequate timeframe.
14FIGURE 3: AERIAL DEFORESTATION OVER TIME
7000
6000
5000
Square Kilometers
4000
3000
2000
1000
0
2000 2002 2004 2006 2008 2010 2012 2014 2016 2018
Year
STRENGTHS OF CFP’s APPROACH
1. Overall, the project appears to have had a positive impact on limiting deforestation.
It is difficult to attribute specific changes in deforestation rates (the outcome) to specific interventions of
CFP. There are several factors influencing deforestation rates that are outside the control of the project,
and the five-year timeframe is just too short to rigorously establish the causes of changes in deforestation
rates. There are numerous “outputs” from CFP, however, that can be quantified, tracked, and supported
further, and a defensible argument can be made that these outputs are, and will continue to, support the
outcome of reduced deforestation. Examples of these outputs include:
1. Management capacity improved in CRBs and District Forestry Department Offices;
2. Local village patrols established to enforce forests in REDD+ zones; and
3. National policies established to manage carbon stocks and community forests.
Our analysis of GIS data shows a correlation between limiting deforestation and project intervention
zones. Figure 18 and Figure 19 in Annex II model changes in deforestation rates in these areas over time.
From the evaluation team’s analysis of Figure 18, it is clear that deforestation exists both within and outside
the intervention areas, but that deforestation levels are lower within the intervention areas.7 However
this analysis is static, not taking time into account. By modeling “hotspot” deforestation analysis in Figure
19, the evaluation team takes recent deforestation patterns into account. The GIS hotspot analysis notes
7 It is necessary to acknowledge that there are limitations inherent in using data covering such a short time span to assess how
CFP activities impacted deforestation. Also, the evaluation team had limited access to disaggregated GIS data, which prevented a
deeper level of analysis of deforestation rates within specific project areas over time. The lack of a counterfactual also makes it
difficult to impute causality concerning deforestation to CFP.
15higher rates of deforestation in the northwestern and southwestern areas of the project, prior to project
implementation. During the project, the GIS analysis did highlight a hotspot for deforestation in the north-
central region of the project, but deforestation in the two previously identified hotspots both decreased.
Overall, the hotspot analysis supports a conclusion that deforestation rates are trending downward in
most of the CFP protected areas.
2. CFP’s strong bonds with local leaders helped limit deforestation.
By working collaboratively with GRZ, local chiefs, and CRB members, CFP provided the tools and
resources to help limit deforestation within the protected REDD+ forest areas. These tools included CRB
trainings, forest demarcation, use of local conservation funds, and breach action tools – quick impact
projects. The CFP program provided support to local authorities and specifically CRBs in the practice of
good governance of their natural resources and revenues associated with these natural resources. The
CRBs were provided training and experience in managing the conservation fees provided by the project.
This required work planning, budgeting, and consultation down to the VAG levels. This also required
practice in transparent financial accounting practices. Additionally, CFP used a Breach Action tool – where
monitoring (community scouts and or other surveillance technique) revealed an encroachment in the
REDD+ forest; in such cases a report was written and BCP staff along with local authorities (chiefs and
CRB members) would plan a visit to the area to meet with the communities and the community leader to
discuss corrective and mitigating actions.
FIGURE 4: CONSERVATION PAYMENTS BY CHIEFDOM
CRB Round One Round One Round Two Round Two
REDD+ Amount (USD) REDD+ Amount (USD)
Hectares Hectares
Mwanya 87,417 ha $17,483 87,784 ha $17,767
- -
Nsefu 39,779 ha $8,051
Jumbe 16,200 ha $3,240 16,212 ha $3,281
Mnkhanya 34,484 ha $6,897 33,608 ha $6,802
Msoro 24,076 ha $4,815 24,089 ha $4,876
Malama 32,283 ha $6,457 32,297 ha $6,537
Luembe 289,760 ha $57,952 289,934 ha $58,683
Nyalugwe 61,088 ha $12,218 61,088 ha $12,364
83,050 ha
Mpanshya $16,610 84,663 ha $17,136
Shikabeta 80,540 ha $16,108 159,444 ha $32,271
Totals 828,898 ha $141,780 828,898 ha $167,768
16CFP disbursed conservation fees through a standard mechanism to the CRBs, consisting of payments of
two Zambian Kwacha per hectare of protected forest conserved. Figure 4 includes a summary of the two
rounds of conservation payments, by chiefdom.8 As noted in this figure, the latest round of conservation
payments included transfers of over 1 million Zambian Kwacha.
As shown in Figure 5, deforestation rates within protected areas in most chiefdoms remained fairly low
throughout the project time period.9 Some chiefdoms experienced higher levels of deforestation, including
Msoro, Shikabeta, and Mnkhanya. In FGDs in these areas, the evaluation team heard of higher levels of
deforestation for charcoal production, and lower levels of community engagement with BCP. However,
overall CFP’s strategy of direct engagement with the chiefs and CRB chairs appears to have resulted in
reduced levels of deforestation.10 When comparing Figure 4 and 5, two of the three chiefdoms with the
highest rates of deforestation also have some of the lowest amounts of protected forests. Shikabeta
Chiefdom is an anomaly; here deforestation levels are relatively high and there is a large amount of
protected forest. Additional research is needed to understand this situation.
Figure 5: Percent Deforestation by Chiefdom
25%
20%
Percent Deforested
15%
10%
5%
0%
a
ha
ya
be
a
fu
be
ro
ya
ya
e
ta
ny
m
gw
se
be
an
sh
sh
as
so
em
m
ala
ha
N
lu
kw
ika
n
n
Ju
w
M
Lu
M
pa
pa
nk
ya
M
Sh
hi
M
M
N
M
-C
be
Chiefdom
em
Lu
The evaluation team’s KIIs and the literature review support the conclusion that strong governance is a
decisive factor in preventing deforestation. KII and FGD respondents consistently noted that CFP had
solid relationships with local leaders, which prevented local community members from entering the
protected forests. When asked who controlled the forests in the area, most FGD respondents mentioned
their chief. There is also some evidence to suggest that, at the chiefdom level, better functioning CRBs
8 The evaluation team used a historical exchange rate of 0.1012 to convert Zambian Kwacha to USD for the second round of
conservation fees.
9 Mpanshya is represented twice on Figure 5 because, as shown in Figure 15, CFP included two separate protected areas within
this chiefdom.
10 It is important to note that there are many potential reasons for deforestation in any area, including governance, population
growth, and infrastructure/road building.
17and more respected local leadership played a pivotal role in preventing deforestation, namely in Jumbe
and Nsefu.
3. CFP successfully responded to the threat of encroachment from migration.
Some of the deforestation that is occurring within the intervention zones is a result of the migration of
members of the Chewa Clan into REDD+ areas. The CFP developed a method of successfully responding
to this migration issue, working with the CRBs to help relocate migrants outside of the project area. This
approach worked well in preventing additional deforestation or encroachment in the REDD+ areas. CFP
utilized airplane surveillance11, Global Forest Watch data, and on-the-ground monitoring by community
scouts and DNPW staff to enforce the agreed upon REDD+ boundaries.
When farmers and herders from other areas resettled in the chiefdoms in Nyalugwe and Jumbe, for
example, the encroachments were addressed through a process that started with “Corrective Action
Reports.” These reports were shared among the CRBs, Chiefs, and other key stakeholders. Then the key
leadership figures visited the sites, talked with the migrants, local community members, and engaged local
authorities from the chiefdom where the migrants originated to negotiate a plan to resettle the migrants.
This process was successful in removing the migrants and preventing further land degradation and
deforestation.
WEAKNESSES OF CFP’S APPROACH
1. CFP progress vis-à-vis deforestation was slowed by limited attention to alternative
livelihoods.
BCP is a carbon marketing organization. It was founded, however, by people “People are disappointed
with wildlife conservation backgrounds. BCP has the mission of making wildlife with the fact that what
was agreed to be done for
habitat conservation valuable to people, partly through using carbon offsets to
the community has not
generate funds for wildlife and forest conservation. The evaluation team finding
been done. This was not
from the field is that, to date, the BCP technical approach has leaned towards what they had expected.
forest conservation/protection through enforcement of rules and regulations, They were promised
and less towards promoting community engagement and supporting alternative employment but up to
livelihoods. This is demonstrated by the emphasis on surveillance and now nothing has been
compliance (e.g., airplane surveillance, aerial imagery data, on the ground site done yet.”
visits, village scouts, and development corrective action memos to address - FGD participant
encroachment into the REDD+ forest areas).
Conversely, livelihood interventions tended to be small or non-existent. BCP did not have a strong group
of partners that could deliver on the livelihood and community engagement components of the project.
They did have discussions, and in some cases, even memorandums of understanding, with organizations
focused on alternative livelihoods, but these relationships were not fully utilized. For example, due at least
in part to budget restrictions, the subcontract with New Rotations Zambia (NRZ) was discontinued after
one year, and the memorandum of understanding with COMACO was never operationalized.
11 Aerial surveillance occurs monthly or bimonthly and focuses on areas at risk of encroachment. DNPW sends an observer, and
the flights are treated as joint patrols. The project pays for fuel. Given the 700,000-ha project area, this is an effective approach,
when combined with remote sensing and field patrols. It is noteworthy that CFP also includes community authorities in over-
flights of adjacent forests for perspective.
18Although preliminary evidence from MINT’s small-scale evaluation in 2018 suggests reductions in charcoal
production in certain project areas, these possible reductions do not appear to be correlated with an
expansion in alternative livelihood opportunities for local community members. Figure 6 shows the
percent of focus groups reporting livelihood training in beekeeping, conservation farming, tree planting,
and other activities, broken down by gender. These results are recorded per focus group, not per
participant in each focus group. For example, over 50 percent of male FGDs mentioned receiving
conservation farming training. It is noticeable that a quarter of focus groups were not aware of any
livelihood training. This suggests that there is significant room to provide trainings to support more
economic development. Given that many respondents felt that losing access to the forest negatively
impacted their livelihood, the livelihood trainings should really be given to all to reduce the negative
economic impact of the program and improve sustainability.
FIGURE 6: FGDS REPORTING LIVELIHOOD TRAINING, BROKEN DOWN BY GENDER
Female Male
80.00%
60.00%
40.00%
20.00%
0.00%
Beekeeping Forest Treeplanting Other None
Conservation (EcoCharcoal, etc.)
Throughout the alternative livelihoods analysis, the evaluation team found that women consistently
reported lower levels of training. Overall, female focus groups were significantly less likely to report
the existence of training programs in almost all areas. This suggests that future trainings might want to
specifically target women or design alternative livelihood opportunities for women with high potential in
the local context.
Conservation farming is another path to alternative livelihoods within the CFP “They need to employ
areas. In the FGDs, men reported conservation farming as the most frequent scouts to check on the
training they received. The evaluation team heard in KIIs and FGDs of forest and protect it from
community willingness to provide scouts to protect the forest, along with the damage from cutting
down trees.”
community openness to alternative farming techniques focused on conserving
the forest. The limitation here is finding a sustainable method to pay for these - FGD participant
scouts and the capacity to reinforce conservation farming methods to allow for
greater adoption levels.
19While the alternative livelihood component of the CFP was not a success story overall, partially due to
funding limitations, the CFP was successful in piloting beekeeping as an alternative livelihood
activity that could prove to be a viable option for use on a larger scale. CFP’s beekeeping efforts
have resulted in the distribution of over 11,000 hives, which is one of the largest conservation beekeeping
efforts to date in Zambia. Since beekeeping is dependent on intact forest, this is a perfect example of the
kind of income generating activity that adds value to a REDD+ project and further incentivizes forest
protection. Anecdotal evidence of the success of the beekeeping program comes from the Headmaster
of a school in Rufunsa, who stated “sometimes the students tell me that they will pay the school fees as
soon as their family sells their next honey harvest”.
2. Conservation payments to communities were insufficient to impact households.
As part of the program, benefits were paid out to communities in exchange for
“The community has
their agreement to preserve the designated forests. Inadequate funds are a received nothing in terms
common challenge in many development programs, and in the case of the CFP, of benefits. As long as the
the size of the payments that went to communities in exchange for conservation, villagers conserve the
as outlined in Figure 4, were often insufficient to the community. Moreover, forest they were promised
activities funded from conservation fees, from building a house for a local head boreholes for water, build
teacher to drilling boreholes, tended to help at a broader community level. As a clinic, school and
these projects were spread out over the entire community, the impact was introduce income
disbursed, and often seen as insufficient to compensate individuals for the generating activities for
their livelihood but this
opportunity-costs of lost forest use.
has not happened.”
In the FGDs, participants were asked about whether they were aware of benefits
- FGD participant
from CFP or BCP. As summarized in Figure 7, many of the community members
did not feel that they personally benefitted, and they questioned if the payments
were sufficient to earn their support for the project. It is likely that larger payments, which will possibly
arrive with future carbon payments, would translate into more noticeable investments in the communities.
FIGURE 7: SHARE OF FGDS BY REGION REPORTING THAT THEY BENEFITED FROM CFP
PAYMENTS
100.00%
75.00%
50.00%
25.00%
0.00%
Lundazi/ Lumezi (6 Mambwe (22 obs.) Nyimba (37 obs.) Rufunsa (23 obs.) Total (88 obs.)
obs.)
20It is worth noting that only approximately half of the focus groups reported receiving benefits
from CFP. In some areas, like Rufunsa and Lundazi, the share of focus groups that reported benefits
were less than half. As we show in Figure 8, we noted a strong relationship between receiving benefits
and having a positive or neutral view of the project.
FIGURE 8: PERCEPTION OF THE PROGRAM CORRELATED WITH OBSERVED BENEFITS
40
30
Observations
20
10
0
Positive or neutral perception Negative perception
Noticed benefits Did not notice benefit
It is quite possible that in some of these cases, benefits were given to communities, but that respondents
were not sufficiently informed about the benefits received, or how funds were used. There were also
several respondents that expressed concerns that money was mishandled by the CRBs, which may be part
of the reason why some communities are not seeing benefits. That being said, CFP worked with the CRBs
to monitor the conservation funds and enacted safeguards, like requiring multiple signatories for any
withdrawals, to prevent fund mismanagement. BCP noted that under the CFP, CRBs used conservation
funds to implement 50 projects (excluding separate CFP alternative livelihood trainings).
Given that the exchange of benefits for conservation is a key part of the program, more work should
be done to ensure that sufficient benefits are being provided to the communities in a timely
manner. In some cases, it may also be important to actively publicize the release of benefits to increase
awareness and ensure that the communities feel that they are benefiting from a positive exchange.
3. CFP progress was impeded by inadequate community sensitization.
In general, stakeholders felt that the CFP community sensitization process was insufficient and inconsistent
in some communities, and that this was a weakness in the project. However, it is important to note that
there are several factors that should also be considered when assessing the effectiveness of this aspect of
the CFP:
• The CFP covered 700,000 ha, and this coverage area was much larger if you consider buffer zones,
impacted areas, etc. Thus, it would be a challenge for any project implementer to consistently and
adequately engage with all the communities in such a large area. The “unusually large” coverage
21of the CFP had some logic behind it, and it presented some advantages to the project, but it also
resulted in less penetration in the community sensitization process.
• A REDD+ project is a long-term endeavor. Effective community sensitization is also a long-term
endeavor, and it cannot be evaluated solely on community impressions during the first several
years of the project.
• There were budget constraints that restricted the CFP’s ability to engage with other organizations
that could have helped to roll out the community sensitization process.
Community members involved in FGDs were often critical of the community sensitization process. They
could not describe, or identify, an FPIC process that they were involved with. And they did not feel they
were adequately engaged in making decisions about BCP activities in their community.12
The FGDs and KIIs indicate that stronger and deeper levels of community engagement, beyond
interactions with local leaders, were needed. Our research indicates that the project did not adequately
engage all of the village authorities. The FGDs and KIIs note that there is a missing connection between
the Chief/CRB chair level and the Headman (or woman). For example, one KII commented:
“The headmen (who are the leaders closest to the communities, because they live within their respective
villages) should have been more actively involved. In many cases, the community and the headmen had
refused the project, but the chief wanted it, and it went ahead. They mainly ‘’refused’’ because of bad
rumors, and because they were not initially consulted.”
One FGD discussion participant reported that they did not want the program to come to the community,
but the Chief wanted it and so “it is like a dictatorship.”
The evaluation did not uncover a clear explanation of where and how the initial community engagement
process was rolled out. However, in the few areas where there was deep and sustained community
engagement from prior REDD+ readiness investments, such as in Rufunsa, our research revealed that
communities understood that the REDD+ zones were “off-limits,” because they were now being managed
differently. They also understood that they were receiving benefits in exchange for foregoing opportunities
to use the forest. The beekeeping, conservation fees and conservation farming training they received in
exchange for forest conservation were the most appreciated interventions.
The lack of a deep and sustained CFP project sensitization led some individual villages to select protected
forests far from their population centers, in areas at lower risk of deforestation to begin with. In Nyimba,
for example, the boundary of the REDD+ forest is 10+ kilometers away from most of the villages that
were beneficiaries of the CFP project. In the 15 FGDs the evaluation team conducted in Nyimba, almost
half mentioned that the forest was “too far” to be of a concern to the local community members. In
interviews with ex-BCP staff, the evaluation team confirmed that communities selected the forests they
wanted to protect, and they generally chose forests far from them, while using closer resources for
exploitation. Selecting these distant forests is sub-optimal from a REDD+ perspective, because they had a
low probability of deforestation in the first place, which decreases the price they receive on the carbon
markets.
12However, it should be noted that community members are often critical of conservation efforts directed from outside the
community.
22EQ2. TO WHAT EXTENT ARE KEY STAKEHOLDERS SATISFIED WITH CFP’S APPROACH TO
RESOLVING POLICY ISSUES
The CFP provides capacity building and policy support to GRZ and other key “CFP’s involvement in the
stakeholders at the national, provincial, district, and local levels. This capacity development of the
building is related to REDD+, Enhancing Capacity for Low Emission Statutory Instrument’s for
Development Strategies (EC-LEDS), community-based natural resource Carbon Stock
management, wildlife management, and climate-smart agriculture. This EQ Management was very
seeks to assess the extent to which key stakeholders are satisfied with CFP’s supportive overall for
approach to resolving policy issues and to identify lessons learned for tackling forest policy development
in Zambia”
policy issues for future REDD+ projects.
- Senior Government
The assessment team found that, broadly speaking, CFP helped resolve policy Official
issues by providing inputs and trainings to GRZ that formalized their policies
around preventing deforestation. CFP was successful in influencing REDD+
policy in Zambia at the central, provincial, and local levels. Specific policies and regulations impacted by
CFP include: 1) an Statutory Instrument (SI) for carbon stock management (draft supported by CFP), 2)
an SI on Community Forest Management, and 3) operationalizing the Community Forest Management
Group (CFMG) as laid out in the Forest Act. Government officials at the central and provincial level stated
repeatedly that CFP helped to facilitate dialogue between stakeholders and provided training and technical
expertise to help resolve or clarify policy issues. Examples of commonly cited statements included:
• A KII with a Senior Forestry Officer of the Department of Forestry indicated that “the CFP’s
support for the development of the Statutory Instrument for Carbon Management was positive” and he
pointed out that GRZ staff that previously involved with the CFP are now working on the new
World Bank REDD+ project called the Zambian Integrated Forest Landscape Project;
• District government officials reported that as a result of CFP efforts they had some opportunities
to provide input into the development of the SIs and were also briefed on the near final versions
of policy (e.g. the statutory instruments for carbon management and community forestry);
• The project facilitated the connection between wildlife policy and forest policy.
The SIs developed with CFP assistance was generally viewed positively in the KIIs and are relatively
progressive. Several KIIs opined on the impact that the CFP had on the development and/or
implementation of these policies. In general, national stakeholders (GRZ, Donors, NGOs) felt that CFP
had a positive impact on these policies – although there was some criticism of the project's involvement
with the Community Forest Management SI. For example, the Forest Department felt that they should
have had more involvement with the development of the agreements between BCP and the communities
– rather than just expecting the Department to “just sign off on them” after BCP had already completed
the negotiations. With respect to the development of the Carbon Stock Management SI, GRZ and NGO
stakeholders felt the project played a significant role in the development of this policy, and that this policy
was now well respected. The Forestry Department did reflect that there could be some inherent conflict
of interest when the seller of the carbon credits (BCP) is also the entity developing the agreements with
the communities.
At the local level, CFP assisted the GRZ in formalizing community rights to both the forests and the
materials in the forests. The SIs on carbon stock management and community forest management clearly
23You can also read