FORWARD EAST BAY - SEPTEMBER 2021 - East Bay Economic Development Alliance
←
→
Page content transcription
If your browser does not render page correctly, please read the page content below
EAST BAY

FORWARD

SEPTEMBER 2021
EAST BAY FORWARD | Acknowledgements                                                                                II

                                      ACKNOWLEDGEMENTS
                                      East Bay Forward was informed and developed with extensive
                                      input from diverse East Bay stakeholders. We are grateful for
                                      the contributions to the following organizations and individu-
                                      als who have supported the development of East Bay Forward.

                                      SPONSORS
                                      Champion                              Supporter
                                      Bank of America                       AB&I Foundry
                                      Bayer                                 Alameda County
                                      StopWaste                             Transportation Commission
                                                                            AT&T California
                                      Leader                                East Bay Regional Park District
                                      First 5 Alameda County                Wells Fargo
                                      Wareham Development

                                      Special Acknowledgements
                                      Special acknowledgement and thanks to East Bay EDA’s members who
                                      supported the development of this publication through valuable insights
                                      and information.

                                      East Bay Economic                         Strategic Economics
                                      Development Alliance Team                 Team
                                      Stephen Baiter, Executive Director        Dena Belzer, President
                                      Carline Au,                               Derek Braun, Senior Associate
                                       Senior Economic Development              Samantha Moskol, Associate
                                       Analyst
                                      Xian Ballesteros,
                                        Senior Economic Development             Graphic Designer
                                        Analyst                                 José Fernandez
                                      Alyson Greenlee,
                                       Senior Economic Development
                                       Analyst
                                      Jackie Keliiaa,
                                       Regional Economic Develop-
                                       ment Director
                                      Maribel Purificacion,
                                       Administrative Associate
                                      Bob Sakai,
                                       Trade & Investment Director
                                       (retired)

                                      To learn more about East Bay EDA, please visit:
                                      www.EastBayEDA.org

                                      East Bay Economic Development Alliance
                                      1221 Oak Street, Suite 555, Oakland CA 94612
                                      (510) 272-6746 | info@EastBayEDA.org

                                      Reproduction of this document or any portion therein is prohibited without the
                                      express written permission of the East Bay Economic Development Alliance.
                                      Copyright ©2021 by the East Bay Economic Development Alliance.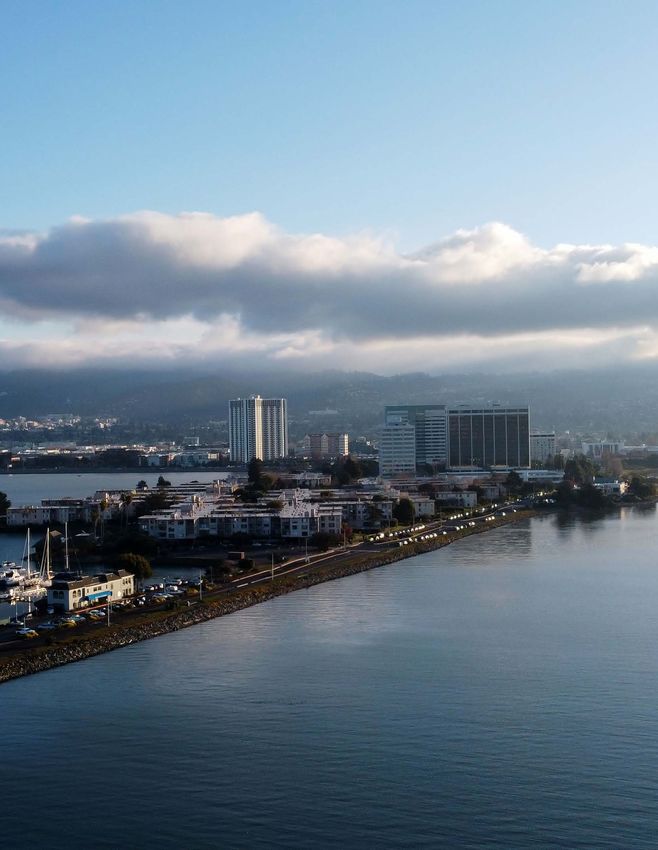
EAST BAY FORWARD | Acknowledgements III
ACKNOWLEDGEMENTS
Strategic Advisory Committee Members
Ahmed Ali Bob, Edward Del Beccaro, John McManus,
Community Affairs Lead, Square EVP/East Bay Regional Manager, Executive Managing Director,
Timothy Burroughs, TRI Commercial Real Estate Services Cushman & Wakefield
Executive Director, StopWaste Bryce Fennell, Hon. Carlyn Obringer,
Hon. Keith Carson, Business Development Officer, Councilmember, City of Concord
President, Alameda County Board of TMC Financing Rich Rankin,
Supervisors Debra Gore-Mann, President, Director – Innovation & Partnerships,
Brandon Cardwell, The Greenlining Institute Lawrence Livermore National Labora-
Senior Management Analyst, Johnny Jaramillo, tory (LLNL)
City of Livermore & Executive Director, Executive Director, Placemade Rebecca Rozen,
i-GATE Carol Johnson, Regional Vice President, Hospital Coun-
Dr. Karen Chapple, Assistant General Manager – cil Northern & Central California
Former Chair & Professor of City & Public Affairs, East Bay Regional Gene Russell,
Regional Planning, UC Berkeley Park District President & CEO, Manex
Leslay Choy, Cynthia Kroll, Dr. Cathy Sandeen,
Executive Director, San Pablo Economic Former MTC-ABAG Chief Economist & President, California State
Development Corporation Asst. Director for Economic Develop- University East Bay
Jennifer Cogley, ment & Research Dr. Raja Sengupta,
Deputy Director – Tess Lengyel, Professor, University of California,
Community Relations, Bayer Executive Director, Alameda County Berkeley
Amalia Cunningham, Transportation (ACTC) Kristin Spanos, CEO,
Assistant Deputy Director, Contra Costa Ruben Lizardo, First 5 Alameda County
County Department of Conservation & Director – Local Government & Danny Wan,
Development Community Relations, UC Berkeley Executive Director, Port of Oakland
Ronak Davé Okoye, Ken Maxey, Judy Wetterer,
Director, SPUR Oakland Director of Government Affairs, Comcast Communications Director,
Wareham Development
Focus Group Participants
Cathy Adams Jesse Denver Kimberly Koempel Tom Salinaro
Dr. Berna Aksu Hilary Dito Jessica Li Carmelo San Mames
Emily Alvarez Donald Frazier Gaylon Logan, Jr. Joshua Simon
Keith Archuleta Shari Godinez Eric Mathis Elaine Schroth
Dawn Argula Sherry Hirota Muhammad Nadhiri Meri Soll
Claudia Arroyo Rob Hope Aaron Ortiz Marsha Tokuyoshi
Julina Bonilla Chris Iglesias Andrew Park Dr. Jennifer Tran
Aisha Brown Carlyn Johnson Joe Partida Kevin Thorne
Shomari Carter Drew Johnston Elizabeth Redman Cleveland Evodio Walle
Alejandra Chamberlain Tina Kapoor Ingrid Roberson Scott Wilson
Carl Chan Michael Katz Jamesine Rogers Gibson
Jessica Chen Meemee Khine Anita Russell
Sarah Church Miya Kitahara Madlen Saddik
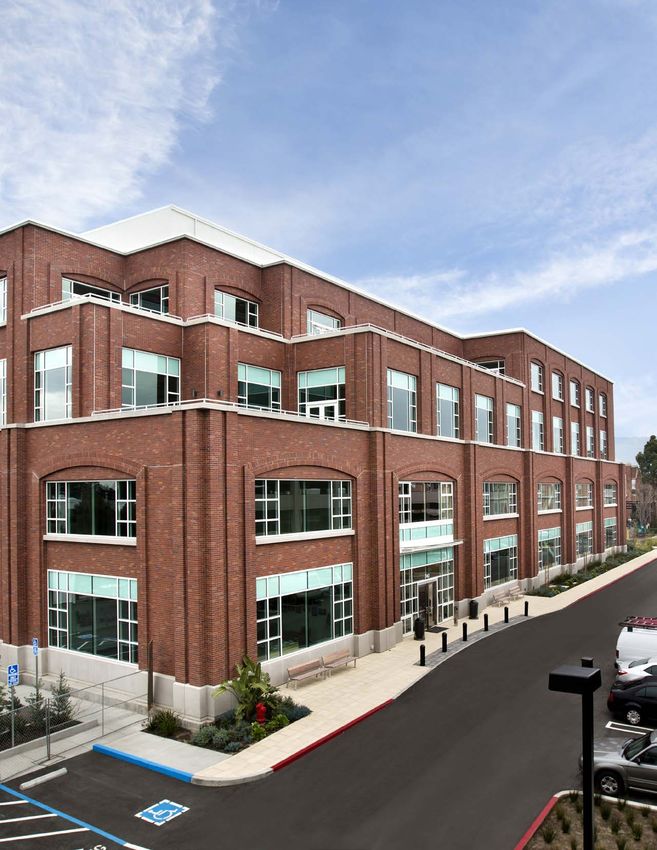
Images in Cover & Acknowledgements: San Leandro Tech Campus (Courtesy of City of San Leandro);
Jupiter Laser Facility (Courtesy of Lawrence Livermore National Lab); Liberation Park (Courtesy
of Black Cultural Zone); Downtown Berkeley BART (Photo by Patrick Civello); Jack London Square
(Courtesy of Port of Oakland); Saildrone Mission Control (Courtesy of Saildrone); Ohlone College’s
Smart Manufacturing Technology Program (Courtesy of Ohlone College); Richmond-San Rafael
Bridge (Photo by Neal Parish)
EAST BAY FORWARD | Table of Contents                     IV

   TABLE OF CONTENTS
Acknowledgements

  I EXECUTIVE SUMMARY                                  5

  II INTRODUCTION                                     11

  III THE EVOLVING EAST BAY                           16
     Pre-Pandemic Economic Trends                     18
     The East Bay’s Pre-Pandemic Workforce            25
     COVID-19’s Impacts on the East Bay               29
     Summary of COVID-19’s Impacts on the             39
     East Bay Economy

  IV LOOKING AHEAD TO A                               41
     POST-PANDEMIC FUTURE
     Legacy Assets                                    42
     Industries to Watch                              43
     Venture Capital Investments                      50

  V FULFILLING OUR PRINCIPLES:       57
    PRIORITIES FOR ECONOMIC RECOVERY
    AND PROSPERITY IN THE EAST BAY

  VI APPENDICES                                       80
     Appendix A: Gross Regional Product by Industry   81
     in the East Bay
     Appendix B: Fastest-Growing Industries           83
     by Payrolled Business Growth
     Appendix C: Occupations to Watch                 86
     Appendix D: About EMSI Data                      88

  VII ECONOMIC PROFILES OF EAST BAY                   90
      SUBAREAS
     Northern Alameda                                 91
     Southern Alameda                                 93
     Central Alameda                                  94
     Tri-Valley                                       96
     Eastern Contra Costa                             97
     Western Contra Costa                             98
     Central Contra Costa                             99
EAST BAY FORWARD | List of Figures                                                                                     V

LIST OF FIGURES
Figure 1        East Bay at a Glance                           Figure 23   Vacancy Rate by Commercial and Industrial
                                                                           Use in the East Bay, 2010 to 2021
Figure 2        The Seven East Bay Subareas
                                                               Figure 24   Strategic Assets and Advantages in the
Figure 3        All Jobs in East Bay per Sq. Mi, 2018
                                                                           East Bay
Figure 4        East Bay Jobs by County, 2014 and 2019
                                                               Figure 25   Top Ten Manufacturing Sectors by East Bay
Figure 5        East Bay Jobs by Industry Sector, 2019                     Employment, 2019
Figure 6        Rate of Job Growth by Industry Sector in the   Figure 26   Select Subsectors in Creative Technology
                East Bay and Bay Area, 2014 to 2019                        and Design
Figure 7        Industry Employment as Share of Total          Figure 27   Biomedical Industry Employment by Busi-
                Employment in Alameda and Contra Costa                     ness Category: Alameda County, 2014-2020
                Counties, 2019
                                                               Figure 28   Logistics Employment in the East Bay, 2014
Figure 8        Employment Growth by County and Indus-                     to 2019
                try Sector, 2014 to 2019
                                                               Figure 29   East Bay Venture Capital Investment in
Figure 9        Concentration of East Bay Industry Sector                  Millions, 2012 to 2020
                Employment in East Bay, Compared to Bay
                                                               Figure 30   Venture Capital Investment by Category
                Area, 2019 (Displayed as Location Quotients)
                                                                           across Bay Area Subregions, 2020
Figure 10       Alameda County: Share of Jobs and Gross
                                                               Figure 31   East Bay Venture Capital Awards by Deal
                Regional Product by Sector, 2019
                                                                           Type and Total Funding, 2020
Figure 11       Contra Costa County: Share of Jobs and
                                                               Figure 32   Venture Capital Investment Funding in the
                Gross Regional Product by Sector, 2019
                                                                           East Bay by Category, 2020
Figure 12       East Bay Educational Attainment for People
                                                               Figure 33   Top 20 Venture Capital Awards in the East
                Age 25 and Over, 2015-2019 Estimate
                                                                           Bay in 2020
Figure 13       Educational Attainment by Race/Ethnicity
                                                               Figure 34   Venture Capital Funding by Subarea, 2020
                in East Bay for People Age 25 and Older,
                2014-2018 Estimate                             Figure 35   Venture Capital Investment by Category
                                                                           and Subarea, 2020
Figure 14       Snapshot of Median Hourly Wages by
                Race/Ethnicity and Education in the Bay        Figure 36   Venture Capital Investment by Subarea, 2020
                Area, 2014-2018 Estimate
                                                               Figure 37   Jobs and Gross Regional Product by Industry
Figure 15       Educational Attainment of Population 25                    and County, 2019
                Years and Older: Some College or Less,
                                                               Figure 38   Comparison of Gross Regional Product by
                2015-2019 Estimate by Zip Code
                                                                           Industry and County, 2019
Figure 16       East Bay Projected Job Openings by Wage
                                                               Figure 39   Industry Subsectors that Added the Greatest
                Level and Educational Requirement, 2018
                                                                           Number of New Establishments in the East
                to 2028
                                                                           Bay, 2014 to 2019
Figure 17       Change in Jobs by Industry in East Bay,
                                                               Figure 40   Fastest-growing Industry Subsectors by
                January 2020 to January 2021
                                                                           New Establishment Formation, Alameda
Figure 18       Vulnerable Jobs in the East Bay, 2018                      County, 2014 to 2019
Figure 19       Unemployment Rate in East Bay, January         Figure 41   Fastest-growing Industry Subsectors by
                2020 through July 2021                                     New Establishment Formation, Contra
                                                                           Costa County, 2014 to 2019
Figure 20       East Bay Unemployment by Race/Ethnicity,
                2020 (Bay Area Equity Network)                 Figure 42   Middle-Wage Occupations with Most Projected
                                                                           Openings in the East Bay, 2018 to 2028
Figure 21       East Bay Unemployment Claims vs Labor
                Force by Gender, 2020                          Figure 43   Top Posted Occupations that Require a
                                                                           Bachelor’s Degree in the East Bay, May to
Figure 22       Unemployment Claims to Labor Force
                                                                           August 2021
                Ratio, 2020
EAST BAY FORWARD | Executive Summary                                                                         5

I.

EXECUTIVE SUMMARY
The COVID-19 pandemic has forced many changes
in the global economy, some from the rapid
accelerations of existing trends, and others from
new economic patterns and ways of doing business.
“East Bay Forward” provides an assessment of how
the pandemic’s impacts have played out in the East
Bay, and what this means for the region’s economy
going forward. East Bay Forward establishes a
roadmap of twelve shared priorities for regional
leaders to address our most pressing challenges,
including the growing economic and social divides
that pervade our communities. This initiative
will move the East Bay toward a new economic
paradigm to capitalize on the many existing and
potential opportunities our region offers, ensuring
that our diverse businesses and residents can grow
and thrive.

                                                      Sunrise over the Altamont Pass. Photo by: Dawn Humphrey.
EAST BAY FORWARD | Executive Summary                                                                                  6

                 East Bay Forward is being led by the East Bay         • Realign and reorganize local and regional
                 Economic Development Alliance (East Bay                 networks and systems that influence and
                 EDA). East Bay EDA is a regional economic               shape issues related to business climate,
                 development organization with more than 150             land use and infrastructure, workforce
                 members that serves as the regional voice and           development, and community health and
                 networking resource for strengthening the               well-being.
                 East Bay economy, workforce, and quality of
                                                                        Six guiding principles—developed with exten-
                 life for our residents. We believe that now is
                                                                      sive input from diverse East Bay stakeholders—
                 the moment to undertake this strategic effort
                                                                      underpin the priorities of East Bay Forward.
                 to address many long-simmering issues of
                                                                      These principles must guide the efforts of East
                 racial, gender, income, and spatial inequality
                                                                      Bay EDA’s stakeholders and compel us to be:
                 in the East Bay. It is also time to capitalize on
                                                                        1.	Connected. Many of our region’s great-
                 our economic strengths and new investment
                                                                           est challenges are inextricably linked,
                 opportunities coming from multiple public and
                                                                           requiring coordinated regional advocacy,
                 private activities.
                                                                           and policy actions and investments that
                   To realize this vision, everyone involved in the
                                                                           address multiple challenges and deliver
                 East Bay economy will need to be engaged in
                                                                           shared benefits.
                 these efforts—business and nonprofit leaders,
                                                                        2. Equitable. An equity-first approach
                 education professionals, elected officials, local
                                                                           ensures that current and future genera-
                 governments, community members, and other
                                                                           tions will achieve meaningful economic
                 stakeholders. We must increase investment
                                                                           inclusion, access to opportunity, and
                 and build greater resilience into our human
                                                                           upward mobility.
                 and physical infrastructure if we are to steer
                 our region toward a healthy and sustainable            3. Measurable. For our region to move
                 economic recovery that supports our business-             forward, we need to be able to measure
                 es and residents. And we must remain com-                 meaningful indicators and outcomes
                 mitted to this goal by charting a new course              indicating how we are doing with accom-
                 forward rather than merely succumbing to the              plishing our goals.
                 pull toward business as usual.                         4. Regenerative. Supporting clean and
                   East Bay Forward provides a framework to                renewable investments to support the
                 undertake this exciting transition based on               just transition to a dynamic, healthy, and
                 East Bay EDA’s core activities, which include             circular economy has immense potential
                 providing informed and data-driven guidance               to drive innovation and growth, as well
                 for leaders to:                                           as yield economic, environmental, and
                                                                           community benefits.
                   • Maximize the East Bay’s opportunities
                                                                        5. Resilient. From destructive wildfires to
                     within the greater Bay Area and Northern
                                                                           future public health crises, there is an
                     California economies and position the
                                                                           urgent need to mobilize and prepare for
                     diverse subareas of the East Bay to benefit
                                                                           complex, intersecting disasters and to
                     from them.
                                                                           future-proof our physical and human
                   • Promote economic recovery efforts that                assets to provide maximum resilience
                     reduce income and wealth disparities by               against ongoing and future challenges.
                     gender and race.
                                                                        6. Transformational. Public and private
                   • Promote efforts around regional emer-                 investment must focus on dismantling
                     gency preparedness and safeguarding                   barriers and creating opportunities for
                     public health to protect against future               long-term and systemic solutions; it is
                     economic shocks.                                      imperative that we do more than pro-
                                                                           mote incremental change.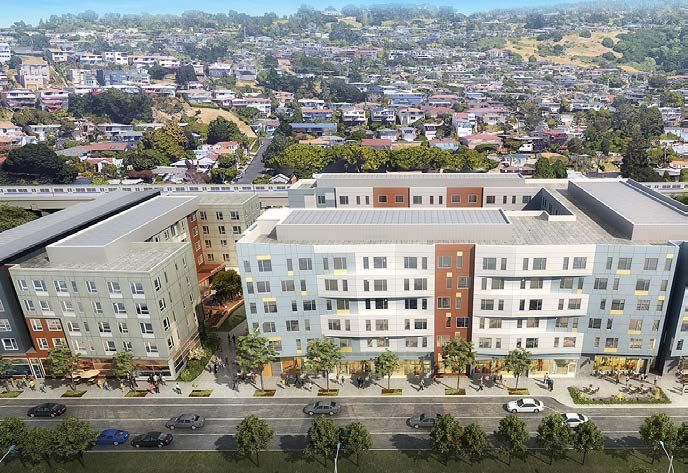
EAST BAY FORWARD | Executive Summary                                                                                7

                 East Bay EDA will pursue the priorities out-       COVID-19’S IMPACTS ON
                 lined in East Bay Forward by coordinating with     THE EAST BAY ECONOMY
                 various East Bay stakeholders across four dif-
                                                                    The COVID-19 pandemic accelerated and
                 ferent “focus areas.” These focus areas repre-
                                                                    amplified trends and conditions already
                 sent specific topics around which East Bay EDA
                                                                    underway in the East Bay, and brought about
                 brings together members and partners with
                                                                    transformational changes that will forever
                 specific knowledge, networks, and resources.
                                                                    shift our old ways of living and working. The
                 These focus areas include:
                                                                    conclusions of data analyses described in
                    1. Business Climate: Encompasses efforts        Section III’s “The Evolving East Bay” section
                       to attract, grow, and retain businesses of   of this report found that the COVID-19 pan-
                       all sizes and industry sectors to ensure     demic accelerated and amplified the follow-
                       that the East Bay continues to enjoy         ing conditions and trends in the East Bay:
                       the benefits of a diverse composition of
                                                                     • Systemic inequities: The pandemic exac-
                       companies and industries.
                                                                       erbated longstanding systemic economic
                    2.	Land Use and Infrastructure: En-
                                                                       and health disparities in the East Bay, par-
                       compasses efforts to address critical,
                                                                       ticularly along racial, ethnic, and gender
                       interconnected land use policy issues to
                                                                       lines. These disparities played out in work-
                       support the mobility of people and goods
                                                                       force job stability and access to oppor-
                       across the East Bay and beyond, as well
                                                                       tunity, on-the-job coronavirus exposure,
                       as the needs for resilient, responsive
                                                                       physical health outcomes, mental health
                       and safe transportation, utilities, and
                                                                       outcomes, and numerous other ways.
                       other essential infrastructure systems
                       to withstand climate-related risks and        • Business Impacts of Ecommerce: Existing
                       other disasters.                                trends related to Ecommerce accelerated,
                                                                       as people purchased a greater share of
                    3. Education and Workforce Development:
                                                                       goods on the internet. This trend primarily
                       Encompasses efforts to advance access
                                                                       favored larger retailers with established
                       to and implementation of early child-
                                                                       Ecommerce platforms, but also pushed
                       care, K-12 education, higher education,
                                                                       smaller businesses to pivot toward expand-
                       and workforce preparedness to ensure
                                                                       ing their Ecommerce and online marketing
                       the East Bay provides a globally com-
                                                                       presences. The acceleration of Ecommerce
                       petitive and diverse workforce that can
                                                                       will also continue to accelerate growth of
                       access quality jobs and careers.
                                                                       “experiential” businesses in bricks-and-
                    4.	Community Health and Well-Being:
                                                                       mortar retail locations as the pandemic
                       Efforts within this focus area recognize
                                                                       recedes, including businesses such as
                       that community safety, health, and em-
                                                                       restaurants, gyms, and entertainment.
                       powerment are all critical ingredients
                       for addressing disparities between the        • Land Use Impacts of Ecommerce: Ecom-
                       East Bay’s communities and ensuring             merce growth will continue to drive reduc-
                       greater resiliency against economic             tions in total retail space required per
                       downturns and other external shocks.            resident, increased demand for distribu-
                                                                       tion facilities located near population cen-
                                                                       ters, and new opportunities to redevelop
                    East Bay Forward’s guiding principles will         and reuse shopping center sites.
                    help us achieve an inclusive, resilient, and
                    sustainable economic future.
EAST BAY FORWARD | Executive Summary                                                                                 8

                                                                    At the same time, the COVID-19 pandemic
                                                                    brought about several transformational
                                                                    changes:
                                                                     • Widespread adoption of remote work: This
                                                                       sudden transformation will have wide-
                                                                       ranging impacts on locations and quantities
                                                                       of demand for office space, design of offices,
                                                                       locations of demand for daytime retail and
                                                                       services, locations of demand for housing,
                                                                       and transportation needs.
                                                                     • Rapid adoption of telehealth, distance
                                                                       learning, and other digital strategies:
                                                                       As with remote work generally, rapid
                                                                       and widespread adoption of telehealth
                                                                       and distance learning will likely lead to a
                                                                       permanent expansion of these services.
Mayfair Mixed-Income Housing Development at El Cerrito del             Businesses also undertook and learned
Norte BART Station. Photo by Lowney Architecture.
                                                                       from implementation of a variety of digital
                                                                       strategies to replace entertainment,
                   • Housing affordability challenges: While           conferences, and other activities that once
                     federal, state, and local policies and            occurred in person.
                     assistance limited mass eviction and            • Enhanced regulatory flexibility: The pan-
                     foreclosure activity during the pandemic,         demic provided a moment for governments
                     the pandemic’s effects on workers and             to prove their ability to rapidly remake laws,
                     incomes demonstrated again how vul-               policies, and regulations. Some of this ad-
                     nerable many East Bay residents are to            ditional regulatory flexibility and speed is
                     economic shocks in our extremely high-            likely to continue beyond the pandemic.
                     cost region.
                                                                     • Creation of new funding resources and
                   • Small business funding and financing              programs: Federal, state, and local
                     challenges: A relatively large share of           governments deployed enormous new
                     small businesses struggled during the             resources to support communities dur-
                     pandemic due to thin operating margins,           ing the pandemic and to reinvest in the
                     lack of capital reserves, and lack of exist-      economy as the pandemic recedes. These
                     ing relationships with traditional financial      resources will have a lasting effect, pro-
                     institutions—which posed a further ob-            viding new one-time or ongoing resources
                     stacle to accessing new federal assistance        for affordable housing, workforce develop-
                     such as the Paycheck Protection Program.          ment, infrastructure investment, business
                     These challenges were especially notable          support, and numerous other needs.
                     for businesses owned by women, people
                     of color, and immigrants.
EAST BAY FORWARD | Executive Summary                                                                                  9

                 OPPORTUNITIES                                        Investments” described in Section IV’s “Look-
                 FOR THE EAST BAY’S                                   ing Ahead to a Post-Pandemic Future.” They
                                                                      include the following:
                 POST-PANDEMIC FUTURE
                 East Bay Forward has identified critical legacy       • Manufacturing is responsible for an
                 assets, industries of opportunity, and investment       outsize share of the East Bay’s job and
                 trends that together indicate “bright spots”            economic growth, provides a high share
                 that will support a vital East Bay economy and          of entry-level middle-wage jobs, and is
                 workforce as the COVID-19 pandemic recedes.             directly linked to the Bay Area’s thriving
                                                                         innovation ecosystem.
                    The East Bay’s legacy assets consist of rela-
                 tively permanent, longstanding, and fixed-in-         • Creative Technology and Design services
                 place components of the region that support             and sectors also tie directly into the Bay
                 and shape the economy—as they have done for             Area’s innovation ecosystem and attract
                 decades or longer already. These are funda-             substantial venture capital investment
                 mental factors that establish the East Bay’s            in the East Bay. This industry group is
                 basic competitive strengths compared to other           dominated by businesses related to the Bay
                 areas, including institutions, infrastructure,          Area’s computer technology industry and
                 land use and land availability, location, and           scientific research and development, but
                 geographic features. These assets are listed            also includes jobs in architecture and engi-
                 and described in Section IV’s “Legacy Assets,”          neering, media, and technical consulting.
                 but examples include our region’s colleges and        • Biomedical industries are positioned to
                 universities that support education, innova-            continue attracting major venture capital
                 tion, and workforce preparedness; our na-               investments; the East Bay plays a special-
                 tional laboratories that support innovation;            ized role within the Bay Area as a distinct
                 our ports, airports, highways, and industrial           biomedical innovation ecosystem focused
                 lands that underpin our goods movement,                 on medical equipment, biotechnology,
                 manufacturing, and innovation-oriented                  pharmaceuticals, and medical devices,
                 industries and high-quality job opportunities;          with strong relationships among our
                 and our unique and diverse arts, culture, and           national laboratories, universities, and
                 open space assets that provide a sense of               industry associations and accelerators.
                 belonging and inclusivity for residents while
                                                                       • CleanTech activities and industries are
                 generating economic activity and contributing
                                                                         attracting large quantities of venture
                 to the East Bay’s cachet as a residential and
                                                                         capital investment in the East Bay and will
                 business location.
                                                                         continue to grow as our society moves to
                   East Bay Forward identified five “industries to       reduce waste and carbon emissions. The
                 watch” based on economic trends and the East            East Bay’s CleanTech cluster especially
                 Bay’s competitive assets, workforce opportu-            benefits from our expansive network of
                 nities, and recent venture capital investment           firms involved in scientific research and
                 activity. These five industries or industry groups      development, advanced manufacturing,
                 drive outsized economic output in the East Bay          and construction, as well as the East Bay’s
                 and are well-positioned to generate substantial         industrial land supply.
                 innovation, investment, business growth, and
                                                                       • Goods Movement and Logistics is rooted
                 growth of high-quality jobs over the coming
                                                                         in the East Bay based on the Port of Oak-
                 years. The industries are described in detail in
                                                                         land seaport and Airports, Port of Rich-
                 the “Industries to Watch” and “Venture Capital
                                                                         mond, our rail and highway connections,
                                                                         and our vast industrial land supply.
EAST BAY FORWARD | Executive Summary 10
OUR TWELVE PRIORITIES FOR 3. Concentrate education, workforce
ECONOMIC RECOVERY AND training, and broadband infrastructure
investments that expand equitable ac-
PROSPERITY IN THE EAST BAY
cess to economic opportunity.
East Bay Forward’s twelve critical priorities
4. Align land use policy and infrastructure
together serve as a comprehensive framework
investments to ensure sufficient flex-
for engaging and activating efforts by East Bay
ibility to respond to regional trends
EDA’s many stakeholders to ensure a more
around remote work, e-commerce, and
inclusive, resilient, and sustainable economic
related innovations.
future for our businesses and residents. The
priorities chart a course for responding to the 5. Mobilize the East Bay’s robust network
COVID-19 pandemic’s impacts, building on our of institutions and organizations to ad-
region’s assets and opportunities, and ensur- dress regional housing affordability.
ing widely shared future economic growth. 6. Protect and invest in the East Bay’s
Achieving that vision will require the East Bay’s industrial employment lands to support
business and nonprofit leaders, education pro- economic diversity.
fessionals, elected officials, local governments, 7. Secure regional and local multimodal
community members, and other stakeholders transportation infrastructure invest-
to work together so that their individual efforts ments to support job growth and acces-
collectively build toward outcomes centered sibility.
around these strategic regional priorities. 8. Position the East Bay to be a leader in
This approach reflects the reality that the East sustainability and climate advance-
Bay’s most pressing challenges and opportu- ments while spurring economic growth
nities are shared both locally and regionally, and innovation.
so our approach must combine individual and 9. Bolster the East Bay’s diversity of arts,
collective decisions and actions. culture, parks, and other essential as-
Section V of this report provides more sets to ensure a vibrant and cohesive
details about the twelve priorities, including region.
major opportunities and challenges for each 10. Expand access to health resources,
priority, and examples of actions that East Bay human infrastructure investments, and
EDA’s partners could pursue to support each other supports that enhance the resil-
priority’s implementation. The featured case ience of our region’s most vulnerable
studies serve to highlight relevant innovative, residents and workers.
equity-centered, and collaborative models and
11. Develop solutions to improve public
best practices in the East Bay.
safety outcomes while reducing sys-
1. Prioritize delivering resources and temic biases and encounters between
services for East Bay small to mid-sized community residents and law enforce-
businesses—especially those most se- ment agencies.
verely impacted by the pandemic.
12. Champion efforts to develop integrated
2. Promote assets and opportunities in the socioeconomic data sets and metrics to
East Bay region to attract and retain a di- evaluate equity outcomes over time.
verse range of businesses and quality jobs.
The priorities chart a course for responding
to the COVID-19 pandemic’s impacts,
building on our region’s assets and
opportunities, and ensuring widely shared
future economic growth.EAST BAY FORWARD | INTRODUCTION 11
II.
INTRODUCTION
The COVID-19 pandemic has forced many
changes in the global economy, some of which
came from the rapid accelerations of existing
trends, and others of which represented new
economic patterns and ways of doing business.
This initiative, East Bay Forward, provides an
assessment of how the pandemic’s impacts have
played out in the East Bay, and what this means for
the region’s economy going forward.
Emeryville shoreline. Photo by: Rahman Hayes.EAST BAY FORWARD | INTRODUCTION 12
EAST BAY FORWARD’S plex, intersecting disasters, and future-
GUIDING PRINCIPLES proof our physical and human assets
to provide maximum resilience against
East Bay Forward is centered around six
ongoing and future challenges.
principles that are foundational to helping
our region realize a future that creates more 6. Transformational. Public and private
widely shared economic prosperity and se- investment must focus on disman-
curity. These principles underpin each of the tling structural barriers and creating
priorities outlined in this report and were opportunities for long-term and sys-
informed and developed with extensive input temic solutions; it is imperative that
from diverse East Bay stakeholders. These six we do more than promote incremental
principles compel us to be: change. Transformational leadership
and purpose-driven strategic planning
1. Connected. Many of our region’s great-
must come together to not only confront
est challenges are inextricably linked,
failures of business as usual, but also to
requiring coordinated regional advocacy,
build long-term organizational capaci-
policy actions, and investments that
ties and cultures to sustain and imple-
address multiple challenges and deliver
ment initiatives and actions.
shared benefits.
2. Equitable. An equity-first approach
ensures that current and future genera- THE PROCESS FOR SHAPING
tions will achieve meaningful economic THIS INITIATIVE
inclusion, access to opportunity, and This East Bay Forward document reflects input
upward mobility. from multiple sources. The process started with
3. Measurable. For our region to move reviewing the many recent studies and reports
forward, we must be able to measure presenting analyses of the East Bay’s economy
meaningful indicators and outcomes and workforce. Information gathered from these
showing whether we are accomplishing reports was augmented with new data analy-
our goals. Enhanced data collection by ses to provide a more nuanced view of the East
socioeconomic and geographic lenses Bay’s changing conditions spanning the 2014 to
can improve outreach, program plan- 2019 period. These new analyses also assessed
ning, and monitoring of outcomes. the transformative impacts of the COVID-19
4. Regenerative. Supporting clean and re- pandemic, which started in 2020. The analysis
newable investments and supporting the situated the East Bay within the context of the
just transition to a dynamic, healthy, and entire Bay Area economy, highlighting the ways
circular economy has immense potential in which the East Bay is both distinct from, and
to drive innovation and growth, as well integrated into, this regional powerhouse.
as yield economic, environmental, and Finally, several of the East Bay’s expert stake-
community benefits. holders weighed in through multiple channels,
5. Resilient. From destructive wildfires to including through a Strategic Advisory Com-
public health crises, there is an urgent mittee established by East Bay EDA. This group
need to mobilize and prepare for com- provided feedback and direction on the analytical
work and helped set priorities for the East Bay
Forward initiative. East Bay EDA also conducted
four focus group meetings. Three drilled more
Many of our region’s greatest challenges are deeply into East Bay EDA’s three standing focus
inextricably linked, requiring coordinated
areas: land use and infrastructure, business cli-
regional advocacy, policy actions, and
investments that address multiple mate, and education and workforce; and a fourth
challenges and deliver shared benefits. tapped into the expertise of other communityEAST BAY FORWARD | INTRODUCTION 13
the transition to producing green fuels, showing
the East Bay’s economic resiliency.
The East Bay experienced a housing boom af-
ter World War II, when cities sprawled out to the
east in conjunction with highway construction
and an expanding BART system. Today, the East
Bay is home to almost 3 million people and 1.3
million jobs. In 2019, the two East Bay counties
comprised 36 percent of the nine-county Bay
Area’s total population and 33 percent of Bay
Area jobs (see Figure 1).
While this report analyzes the East Bay
as a single area, the two East Bay counties
are distinct from each other, with different
opportunities and challenges. In 2019, Alam-
eda County accounted for approximately 67
Panorama of Berkeley skyline. Photo by: Patrick Civello. percent of the East Bay’s jobs. A large share
of those jobs were in traded1 sectors ranging
from biotechnology, creative professional ser-
leaders. As the process evolved and specific top-
vices, and information, to advanced manufac-
ics or issues arose, these were further explored
turing and logistics. In contrast, Contra Costa
with subject matter experts.
County’s economy, with only few significant
The combined findings from these sources office concentrations that emerged during
are presented in this report to fully tell the the 1980s and 1990s, is dominated by house-
East Bay’s economic and workforce story, and hold-serving sectors, such as food services,
to establish new priorities that will serve as healthcare, hospitality, and personal services.
the “roadmap” to move the East Bay forward In addition, eastern Contra Costa County,
in this decade and beyond. which has some of the Bay Area’s lowest-cost
housing, is also relatively distant from the Bay
INTRODUCING THE EAST BAY Area’s major employment centers.
Two counties, Alameda and Contra Costa, com- As Figure 1 shows, the East Bay has been
prise the East Bay. With an extensive shoreline divided into seven different economic subar-
and a direct overland connection east to the eas, for purposes of this report’s analyses.
Sierra Nevada mountains and beyond, the East Three subareas are entirely in Alameda Coun-
Bay has a rich history of indigenous occupation ty, three are entirely in Contra Costa County,
and as a strategic economic location. Much of and one—Tri-Valley—falls in both.
the East Bay’s early industrial development was In terms of economic output, the only two
fostered by the availability of land along the criti- subareas in Contra Costa County that perform
cal transportation connections of the San Fran- on par with the Alameda County subareas are
cisco Bay and the Delta Estuary, combined with Central Contra Costa and Tri-Valley (which
the terminus of the transcontinental railroads. includes Danville and San Ramon, in Contra
Some of the East Bay’s oldest legacy industries Costa County). This further highlights the dif-
still operate in their historic locations, includ- ferences between the two counties. Figure 2
ing the petroleum refineries along Contra Costa shows where the seven subareas are located.
County’s northern waterfront. And yet, these Each subarea is further described in Section
19th century industries are also poised to make VII of the report
1 “Traded” or “basic” industry sectors are those with a high concentration of business activity that exports goods and
services outside a given area, thus attracting outside spending and fueling economic activity.EAST BAY FORWARD | INTRODUCTION 14
REPORT CONTENTS
The remainder of this report is divided into five
sections:
I. The Evolving East Bay presents findings
that capture the trajectory of the East
Bay economy and workforce before the
COVID-19 pandemic, and then identifies
specific impacts of the pandemic on the
East Bay economy.
II. Looking Ahead to a Post-Pandemic
Future describes the East Bay’s primary
competitive assets, industries poised for
growth and innovation, and recent venture
capital investments to identify critical
drivers of the region’s economy as we
emerge from the pandemic.
III. Fulfilling Our Principles: Priorities for
Economic Recovery and Prosperity in the
East Bay describes the priority recom-
mendations of East Bay Forward, includ-
ing summaries of key opportunities and
Windmills at the Altamont Pass. Photo by: Dawn Humphrey. challenges identified through this effort
that are addressed by each priority.
GEOGRAPHIC REFERENCES IV. Appendices. Three of the four appendices
at the end of this report describe addi-
This report makes frequent references to the
tional detailed data analyses that may be
following geographies:
useful for the technical needs of specific
• East Bay or “the region”: Refers to Alam- readers. The fourth appendix provides an
eda County and Contra Costa County. overview of the EMSI data source used for
• Bay Area: Refers to the seven-county much of this report’s analyses. The ap-
Bay Area when used to refer to employ- pendices include:
ment analyses, including Alameda, Contra V. Economic Profiles of East Bay Subareas
Costa, San Francisco, San Mateo, Marin, describes population, employment
San Benito, and Santa Clara Counties. trends, and defining attributes in each of
General references to the Bay Area also the seven East Bay subareas.
include Sonoma and Napa Counties.
• Megaregion: Includes the San Francisco
Bay Area, Sacramento, the Northern San
Joaquin Valley, and the Monterey Bay Area.
• Subareas: Refers to the seven East Bay
subareas. See Figure 2.EAST BAY FORWARD | INTRODUCTION 15
FIGURE 1
East Bay at a Glance
Central Eastern Western
Northern Central Southern Tri Contra Contra Contra
Alameda Alameda Alameda Valley Costa Costa Costa East Bay
Population (2019) 442,504 619,541 371,878 393,015 390,924 342,156 264,838 2,824,855
Population Change (2014 - 2019) 2% 2% 4% 8% 2% 8% 2% 6%
Population (2021) 447,792 622,246 381,534 395,039 393,228 348,303 271,428 2,859,570
Population Change (2019-2021) 1% 0% 3% 1% 1% 2% 2% 1%
Employment (2019) 294,326 240,653 194,569 239,837 210,485 78,350 73,214 1,331,434
Employment Change (2014-2019) 11% 11% 15% 12% 8% 9% 10% 11%
Employment (2021) 278,981 230,313 188,907 229,189 201,782 74,739 70,595 1,274,506
Employment Change (2019-2021) -5% -4% -3% -4% -4% -5% -4% -4%
Unemployment Rate % (May 2021) 6.0% 6.1% 6.0% 6.1% 6.3% 6.3% 6.3% 6.10%
Source: EMSI, 2021; ACS 5-year Estimates, 2010-2014 and 2015-2019; Strategic Economics, 2021.
FIGURE 2
The Seven East Bay Subareas
80
Western Contra Costa
4 Antioch Central Contra Costa
Northern Alameda
Concord Central Alameda
Richmond
580
Southern Alameda
Tri-Valley
Walnut Creek
24
4 Eastern Contra Costa
Berkeley
Emeryville
80
680
Downtown
Oakland
880
580
San Leandro
580
Pleasanton Livermore
Hayward
92
Union City 84
N 0 5 10 miles
Fremont
84 880EAST BAY FORWARD | The Evolving East Bay 16
III.
THE EVOLVING EAST BAY
With over 1.3 million jobs in the region pre-pandemic,
the East Bay has a large and robust economy. However,
like the rest of the global economy, the East Bay
has been significantly disrupted by the COVID-19
pandemic. Ultimately, our region must address
both accelerated pre-existing trends and
new post-pandemic conditions to be
able to realize a better and brighter
economic future.
Public and private investment must focus on dismantling
structural barriers and creating opportunities for long-
term and systemic solutions; it is imperative that we do
more than promote incremental change.
Anti-matter experiment at the Jupiter laser facility. Courtesy of Lawrence Livermore National Laboratory.EAST BAY FORWARD | The Evolving East Bay 17
This section captures the trajectory the econ- Based on the data analyses and extensive
omy was on before the pandemic and then stakeholder input, the information below is
identifies the areas in which the pandemic had divided into three topic areas.
the greatest impacts. To some extent, these • The first topic characterizes the region’s
impacts merely accelerated trends that were pre-pandemic economy, concentrating on
already in motion. In other cases, the pan- trends from the five years leading up to
demic created changes in the economic cli- the pandemic (2014 to 2019). The analy-
mate that must be acknowledged. Ultimately, sis is quantitative and relies on standard
the East Bay Forward initiative must address measures to describe the region’s econ-
both accelerated pre-existing trends and new omy including total employment growth,
post-pandemic conditions. sectoral mix and changes in sectoral
This section combines inputs from three key composition, industry specialization, and
sources: 1) an extensive review of the many growth rate by industry.
background reports regarding the East Bay’s
• The second topic is an analysis of the East
economy; 2) input from the East Bay Forward
Bay’s pre-pandemic workforce. This sec-
Strategic Advisory Committee, four focus
tion focuses on specific workforce chal-
group meetings, and follow-up interviews with
lenges that existed prior to the pandemic
local topic area experts; and 3) original data
in terms of education and skills gaps and
analyses undertaken so that the quantita-
access to livable jobs.
tive data presented in this report specifically
reflects the topics, issues, and concerns raised • The third topic then discusses the specific
by the Strategic Advisory Committee and other impacts COVID-19 had on the East Bay
East Bay stakeholders. economy.
FIGURE 3
East Bay Jobs per Square Mile, 2018
Density of All Jobs
(jobs per square mile)
80
4 Antioch
20,000
Emeryville
80
Subarea
680
Downtown
Oakland
880
580
San Leandro
580
Pleasanton Livermore
Hayward
92
Union City 84
N 0 5 10 miles
Fremont
84 880EAST BAY FORWARD | The Evolving East Bay 18
• The final section ends with findings on eas have the lowest number of jobs in the East
the ways in which the pandemic has both Bay. Richmond (Western Contra Costa) as well
accelerated trends already underway, as Antioch and Pittsburg (in Eastern Contra
as well as the transformational changes Costa) have the strongest job concentrations
brought up by the pandemic. in these subareas, though they are not par-
ticularly large compared to concentrations in
The East Bay is more than just an economy.
the other subareas.
It is also place composed of many communi-
ties. Figure 3 provides a spatial backdrop for The spatial employment pattern is critical for
understanding how jobs are distributed across understanding the East Bay region for two rea-
the region. Jobs are not distributed equally sons: 1) It shows that the East Bay is also part of
across the two East Bay counties. Northern the larger Bay Area. Communities that are closer
Alameda has the strongest concentration of to and better connected with the rest of the Bay
jobs, as Downtown Oakland, Berkeley, and Area have historically represented the greatest
Emeryville constitute a large share of re- economic opportunity. 2) It sets the stage for
gional employment. The Interstate 880 cor- understanding how each subarea within the East
ridor, which connects Downtown Oakland Bay has been impacted by the pandemic, and
to San Jose through Alameda County, also what opportunities exist to strengthen each sub-
has sizeable job concentrations throughout. area’s employment base in the future. Profiles
Communities with strong job concentrations of the region’s seven subareas can be found in
along this corridor include Fremont, Union Section VII.
City, Hayward, and San Leandro. Within the
Tri-Valley, most jobs are concentrated either PRE-PANDEMIC ECONOMIC
at the intersection of Interstates 580 and 680 TRENDS
in Dublin and Pleasanton (both of which are in The following data captures the key ele-
Alameda County). There are also job concen- ments of the East Bay economy as defined by
trations along Interstate 580 in Livermore jobs, sectoral mix, industry growth rates and
(Alameda County) and along Interstate 680 in economic specialization. In this analysis, the
San Ramon (Contra Costa County), which is spatial differences within the East Bay were
where Bishop Ranch is located. Walnut Creek captured by comparing the two counties to
and Concord, which are in Central Contra each other. Specific implications for individual
Costa, also have strong job concentrations. subareas can be further inferred based on the
The Western and Eastern Contra Costa subar- subarea profiles.
FIGURE 4
The East Bay economy grew at a rate that was
East Bay Jobs by County, 2014 and 2019 nearly on par with the Bay Area, although
1,400,000 Contra Costa the growth was disproportionate by county.
32.6% Alameda
1,200,000
Total jobs in the East Bay grew (1.3 million) 11
33.5%
percent from 2014 to 2019. However, Alam-
1,000,000 eda County grew by 12 percent, which is on
Number of Jobs
67.4% par with the Bay Area’s growth over this same
800,000 66.5% period, while Contra Costa County only grew
600,000 by eight percent. This illustrates an increasing
divergence in economic activity across the two
400,000
counties (See Figure 4).
200,000
Overall, the East Bay economy is diverse. Fig-
0 ure 5 shows the East Bay’s 2019 employment
2014 2019
by industry using 2-digit NAICS codes. Four of
Source: EMSI, 2021; Strategic Economics, 2021.EAST BAY FORWARD | The Evolving East Bay 19
the largest individual sectors all fall into the including Information (2 percent), account for a
household-serving industry group (“Health relatively small share of total employment, but
Care and Social Assistance,” 14 percent; Public have been growing and/or represent a strong
Administration, 13 percent; Retail Trade, 9 East Bay concentration. Other sectors, such as
percent; “Accommodation and Food Service,” those typically associated with the life sciences
8 percent). These four sectors accounted for and biotech industries, are distributed across
44 percent of total East Bay employment. multiple NAICS classifications, and will there-
The largest basic or “traded” sectors include fore not stand out in a high-level sectoral analy-
Professional and Technical Services (9 percent) sis such as this. Other analytical methods have
and Manufacturing (8 percent). In total, the been used to highlight these East Bay economic
region’s traded sectors comprised about 30 strengths and will be discussed below.
percent of total jobs in 2019. The proportional
The East Bay’s recent employment growth
share between household serving and traded
varied considerably by industry sector.
industries is about on par with the way most
Figure 6 shows percent changes in employ-
diversified economies are structured. However,
ment growth over the 2014-2019 period by
these numbers are not necessarily the best
industry for the East Bay and for the Bay Area.
description of the East Bay’s overall economic
The Manufacturing industry had the greatest
strengths partly because some industries,
employment growth relative to the Bay Area,
FIGURE 5 growing by 20 percent in five years compared
East Bay Jobs by Industry Sector, 2019 to 13 percent in the region. Although the Tesla
Number Share of plant in Fremont accounted for a significant
Industry of Jobs Jobs share of the East Bay’s overall increase, other
Health Care and Social Assistance 185,148 14% industry sub-sectors including food process-
Public Administration 170,825 13% ing and biomedical devices also grew quickly.
Professional and Technical Services 121,258 9% This overall trend suggests that the East Bay’s
Retail Trade 118,780 9% legacy as a manufacturing hub for the Bay
Accommodation and Food Services 105,011 8% Area persists, while many of the processes
Manufacturing 102,590 8% and products involved represent the latest in
Construction 91,502 7% advanced manufacturing techniques.
Other Services 78,123 6% Alameda and Contra Costa counties are distinct
Administrative and Waste Services 76,604 6% from each other based on both their industry
Wholesale Trade 46,400 3% mix in 2019 and their five-year employment
Transportation and Warehousing 45,591 3% growth by industry. Figure 6 shows industry
Finance and Insurance 42,896 3% employment as a share of total employment in
Educational Services 33,397 3% each county. Alameda County has a higher share
Information 29,950 2% of jobs in traded sectors, with concentrations of
Arts, Entertainment, and Recreation 26,702 2% jobs in Manufacturing and Logistics (which in-
Management of Companies and cludes many subsectors in Wholesale Trade and
25,596 2%
Enterprises “Transportation and Warehousing”). Alameda
Real Estate and Rental and Leasing 24,092 2% County has a higher share of jobs in Professional
Utilities 5,635 0.4% Services and Information, both of which include
Agriculture, Forestry, Fishing & many subsectors that fall in the “Creative Tech-
1,750 0.1%
Hunting (a)
nology and Design” category. Alameda County
Mining (a) 221 0.02%
also has a higher share of jobs in the Biomedical
TOTAL 1,332,072 100%
cluster, which is difficult to track with NAICS
Notes: (a) These two sectors account for a very small share of employment codes but tends to fall into Manufacturing and
in the East Bay, and are not analyzed further in this report.
Source: EMSI, 2021; Strategic Economics, 2021.
Professional Services.EAST BAY FORWARD | The Evolving East Bay 20
In contrast, household-serving sectors Figure 7 shows the employment growth by
such as “Accommodation and Food Services,” industry sector in each county from 2014 to
Health Care, “Other Services,” and Retail 2019. In Alameda County, most of the sectors
Trade, account for a greater share of jobs that are driving economic growth also expand-
in Contra Costa County. These sectors tend ed their workforce from 2014 to 2019. Profes-
to constitute larger shares of employment sional Services, Manufacturing, and Informa-
in places that are predominantly residen- tion all grew by at least 10 percent in terms of
tial. Contra Costa County also has a higher employees over the period.
share of jobs in office-based sectors that are The “Transportation and Warehousing”
household-serving in the East Bay context. sector also had strong employment growth in
The Central Contra Costa subarea has a large both counties, as the rise in Ecommerce has
proportion of the East Bay’s “Finance and driven employment demand in distribution
Insurance” jobs, while the county generally centers and other logistics facilities.
has a higher share of jobs in the real estate Household-serving sectors, including
sector. Additionally, a large number of the Healthcare, “Accommodation and Food
region’s Utilities jobs are attributed to the Services,” and Construction also had strong
Eastern Contra Costa subarea because of the employment growth in both counties. Growth
presence of Pacific Gas & Electric. in these sectors is closely intertwined with
household growth.
FIGURE 6
Rate of Job Growth by Industry Sector in the East Bay and Bay Area, 2014 to 2019
Health Care and Social Assistance East Bay
Bay Area
Public Administration
Professional, Scientific, and Technical Services
Retail Trade
Accommodation and Food Services
Manufacturing
185%
Construction
Other Services
Administrative and Waste Services
Wholesale Trade
Transportation and Warehousing
Finance and Insurance
Educational Services
Information
Arts, Entertainment, and Recreation
Management of Companies and Enterprises
Real Estate and Rental and Leasing
Utilities
-20% -10% 0 10% 20% 30% 40% 50% 60%
Source: EMSI, 2021; Strategic Economics, 2021.EAST BAY FORWARD | The Evolving East Bay 21
The East Bay economy has many unique sistance,” Public Administration, Retail Trade,
industry specializations when compared to and “Arts, Entertainment, and Recreation.”
the Bay Area economy. “Economic specializa- Household-serving industries are typically tied
tion” is another way to evaluate the East Bay’s to population growth and have a low “multiplier
economic strengths. The “location quotient” effect” in terms of driving additional spend-
measure is a ratio used to indicate when an ing and generating increases in overall income
industry in the East Bay has a higher share of within the region. However, because household-
jobs than would be expected when compared serving industries are more concentrated in the
against the Bay Area as a whole.2 As shown in East Bay than in the Bay Area, this indicates
Figure 9, East Bay industries with a location that these industries are likely not just serving
quotient greater than “one” represent greater the East Bay’s resident population but are also
economic specialization in the East Bay than in drawing activity from a larger area beyond the
the Bay Area overall. two-county region. This likely reflects how well
The East Bay has multiple sectors with a the East Bay is physically connected both to
location quotient of greater than “one.” Many of other Bay Area counties and to the 21-county
these sectors are in household-serving indus- megaregion that extends both east and north
tries, including “Health Care and Social As- via Interstate 880, BART, and the four bridges
2 The location quotient is calculated by dividing the share of an industry’s employment in the East Bay by the share of
that industry’s employment in the Bay Area.
FIGURE 7
Industry Employment as Share of Total Employment in Alameda and Contra Costa counties, 2019
Health Care and Social Assistance Alameda
Contra Costa
Public Administration
Professional, Scientific, and Technical Services
Retail Trade
Accommodation and Food Services
Manufacturing
185%
Construction
Other Services
Administrative and Waste Services
Wholesale Trade
Transportation and Warehousing
Finance and Insurance
Educational Services
Information
Arts, Entertainment, and Recreation
Management of Companies and Enterprises
Real Estate and Rental and Leasing
Utilities
0 2% 4% 6% 8% 10% 12% 14% 16% 18%
Source: EMSI, 2021; Strategic Economics, 2021.EAST BAY FORWARD | The Evolving East Bay 22
connecting the East Bay to the West, North, Gross Regional Product (GRP) is another
and South Bay households and workforce. measure of which industries are contributing
The East Bay also has specializations in to the East Bay Economy. The East Bay’s total
certain traded sectors that differentiate the GRP amounts to $209.3 billion, with Alameda
East Bay’s strengths from those of the Bay County accounting for 64% of this activity and
Area’s overall economy. Such sectors include Contra Costa County making up 36% of this
Wholesale Trade and “Transportation and total. Certain traded sectors play an outsized
Warehousing,” which are both tied to the Port role in generating economic growth (i.e., dollars
of Oakland (including the major container ter- moving through the economy, as compared to
minals in Oakland, and Oakland International their share of employment). This comparison
Airport), as well as the Port of Richmond, a between GRP and employment by industry
bulk cargo port. Other sectors concentrated is especially illuminating for industries like
in the East Bay are Construction, “Administra- Manufacturing, where automation and other
tive and Waste Services,” and Utilities; these industry changes generate faster growth in eco-
sectors represent a combination of traded and nomic output relative to jobs. As Figures 10 and
non-traded activities. However, small emerg- 11 show, Manufacturing plays an important role
ing industries that are becoming increasingly as an economic driver for the East Bay. Addi-
important in the East Bay are likely to have tionally, Professional Services, Information, and
relatively low location quotients, illustrating “Finance and Insurance” sectors are contribut-
the importance of using multiple measures to ing substantial economic output, particularly in
understand the East Bay’s economic strengths. Alameda County.
FIGURE 8
Employment Growth by County and Industry Sector, 2014 to 2019
Health Care and Social Assistance Share of Jobs
Public Administration Share of GRP
Professional, Scientific, and Technical Services
Retail Trade
Accommodation and Food Services
Manufacturing
Construction
Other Services
185%
Administrative and Waste Services
Wholesale Trade
Transportation and Warehousing
Finance and Insurance
Educational Services
Information
Arts, Entertainment, and Recreation
Management of Companies and Enterprises
Real Estate and Rental and Leasing
Utilities
0% 5% 10% 15% 20% 25%
Source: EMSI, 2021; Strategic Economics, 2021. See Appendix for full GRP detail.EAST BAY FORWARD | The Evolving East Bay 23
FIGURE 9
Concentration of East Bay Industry Sector Employment in East Bay, Compared to Bay Area, 2019
(Displayed as Location Quotients)
Industry Number of Jobs Location Quotient
Health Care and Social Assistance 185,148 1.23
Public Administration 170,825 1.19
Professional and Technical Services 121,258 0.70
Retail Trade 118,780 1.19
Accommodation and Food Services 105,011 0.94
Manufacturing 102,590 0.97
Construction 91,502 1.28
Other Services 78,123 0.93
Administrative and Waste Services 76,604 1.07
Wholesale Trade 46,400 1.32
Transportation and Warehousing 45,591 1.20
Finance and Insurance 42,896 0.94
Educational Services 33,397 0.77
Information 29,950 0.39
Arts, Entertainment, and Recreation 26,702 1.08
Management of Companies and Enterprises 25,596 1.10
Real Estate and Rental and Leasing 24,092 0.96
Utilities 5,635 1.37
Total 1,332,072
Source: EMSI, 2021; Strategic Economics, 2021.
FIGURE 10
Alameda County: Share of Jobs and Gross Regional Product by Sector, 2019
Health Care and Social Assistance Share of Jobs
Public Administration Share of GRP
Professional, Scientific, and Technical Services
Retail Trade
Accommodation and Food Services
Manufacturing
Construction
Other Services
Administrative and Waste Services
Wholesale Trade
Transportation and Warehousing
Finance and Insurance
Educational Services
Information
Arts, Entertainment, and Recreation
Management of Companies and Enterprises
Real Estate and Rental and Leasing
Utilities
0 5% 10% 15% 20% 25%
Source: EMSI, 2021; Strategic Economics, 2021. See Appendix for full GRP detail.You can also read