Survey 2.0 of Policies and Programs that Promote Fuel-Efficient Transport in APEC Economies - The Alliance to Save Energy
←
→
Page content transcription
If your browser does not render page correctly, please read the page content below

Survey 2.0 of Policies and Programs
that Promote Fuel-Efficient Transport
                  in APEC Economies

             The Alliance to Save Energy

                               May 2008
                  Updated September 2009
EWG 03/2007A

Prepared by:

Judith Barry and Angela Morin Allen, Lead Authors
Update by Laura van Wie McGrory, Diana Lin, and Sally Larsen
Alliance to Save Energy
1850 M Street NW, Suite 600
Washington DC 20036 USA

For:

APEC Secretariat
35 Heng Mui Keng Terrace Singapore 119616
Tel: (65) 68919 600 Fax: (65) 68919 690
Email: info@apec.org Website: www.apec.org

© 2008 APEC Secretariat

APEC#208-RE-01.10

                                       i
TABLE OF CONTENTS
Acknowledgments ..............................................................................................................................................iii
Abbreviations and Units ....................................................................................................................................iv
Case Studies .......................................................................................................................................................... v
List of Figures and Tables ................................................................................................................................... v
Executive Summary ............................................................................................................................................. 1
     Increasing Fuel Economy of New Vehicles ............................................................................................. 1
     Encouraging Purchase of Fuel-Efficient Vehicles ................................................................................... 2
     Improving Operational Efficiency of Existing Vehicles ........................................................................ 2
     Reducing Congestion .................................................................................................................................. 3
     Boosting Efficiency and Use of Mass Transit .......................................................................................... 3
     Urban Design and Planning to Reduce Vehicular Transport ............................................................... 3
     Efficient Freight ............................................................................................................................................ 4
     Conclusions ................................................................................................................................................... 4
1. Increasing Fuel Economy of New Vehicles ............................................................................................. 6
     Fuel Economy Standards for New Vehicles ............................................................................................ 6
     Emissions Standards for New Vehicles that Improve Vehicle Fuel Economy ................................ 15
2. Encouraging Purchase of Fuel-Efficient Vehicles ................................................................................. 20
     Vehicle Efficiency Labels and Ratings .................................................................................................... 20
     Incentives to Purchase Efficient Vehicles ............................................................................................... 22
     Efficient Government Fleets ..................................................................................................................... 25
     Awareness Campaigns.............................................................................................................................. 27
3. Improving Operational Efficiency of Existing Vehicles ...................................................................... 29
     Mandatory Vehicle Emissions Inspections ............................................................................................ 29
     Retiring Old Vehicles ................................................................................................................................ 36
     Tire Pressure ............................................................................................................................................... 38
4. Reducing Road Congestion ...................................................................................................................... 40
     Congestion Pricing..................................................................................................................................... 40
     Maximizing Efficiency of Highway Lanes............................................................................................. 49
     Maximizing Traffic Flow on Surface Roads .......................................................................................... 50
     Car Sharing ................................................................................................................................................. 52
     Employee Incentives to Reduce Vehicle Traffic .................................................................................... 55
     Car Pooling ................................................................................................................................................. 55
     Van Pooling................................................................................................................................................. 56
     Telework ...................................................................................................................................................... 56
     Mass Transit ................................................................................................................................................ 56
5. Boosting Efficiency and Use of Mass Transit ........................................................................................ 59
     Bus Rapid Transit (BRT) ........................................................................................................................... 60
     Light Rail and Subways ............................................................................................................................ 68
6. Urban Design and Planning to Reduce Vehicular Transport ............................................................. 71
     ―Smart Growth‖ and Transit-Oriented Design and Development .................................................... 71
7. Promoting Fuel-Efficient Freight Transport .......................................................................................... 77
     Energy Efficient Technologies for Heavy Vehicles .............................................................................. 77
     Government Policies and Programs for the Commercial Freight Industry ..................................... 80
8. Cross-Cutting Approach: Taxes on Fuels ................................................................................................ 86

                                                                                   ii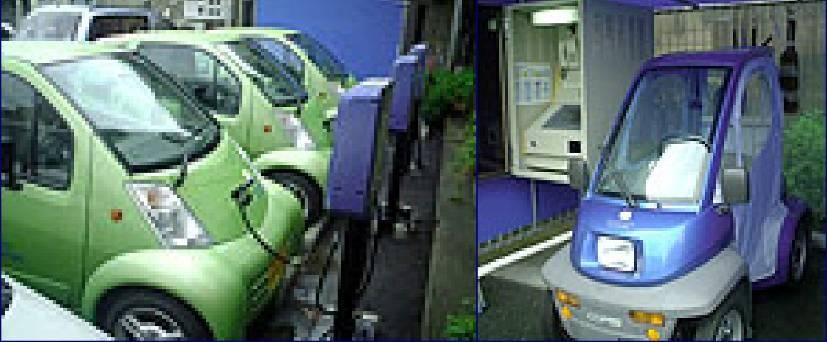
Acknowledgments
The authors would like to thank Mr. Jeffrey Skeer of the US Department of Energy and Mr. Sun Tao
of the APEC Secretariat for their thoughtful guidance and support throughout this project. We
gratefully acknowledge the contributions of many individuals and organizations throughout the
APEC region whose efforts over the years have provided the program examples we cite here – as
well as an even larger number whose work was no less important but omitted due to limited space
and resources. Last, many thanks to our colleagues at the Alliance and elsewhere who reviewed,
commented, or otherwise advised us in the preparation of this report. Energy efficiency in the
transportation sector remains an active field of innovation, and so we welcome comments,
suggestions, and additional leads from readers.

       – Judith Barry
       – Angela Morin-Allen

                                               iii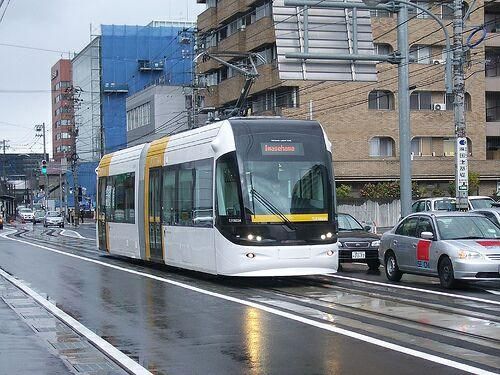
Abbreviations and Units

APEC    Asia Pacific Economic Cooperative
APU     auxiliary power unit
BRT     bus rapid transit
Btu     British thermal unit
CAFE    Corporate Average Fuel Economy
CBD     central business district
CNG     compressed natural gas
CO2     carbon dioxide
CO      carbon monoxide
cc      cubic centimeters
ERP     electronic road pricing
EU      European Union
GDP     gross domestic product
GHG     greenhouse gas
HC      unburned hydrocarbons
HOV     high occupancy vehicle
ITS     intelligent transport system
L       liter
LPG     liquefied petroleum gas
km      kilometers
mpg     miles per gallon
NOx     nitrogen oxides
psi     pounds per square inch
rpm     revolutions per minute
TOD     transit-oriented design/development
U.K.    United Kingdom
U.S.    United States
VKT     vehicle-kilometer traveled

                                        iv
Case Studies
Thailand: Using Emissions Standards and Inspections to Induce Shift from 2-Stroke to 4-Stroke
Motorcycles

Mexico: Vehicle Inspections Program in Mexico City
United States: Electronic Road Pricing for Stretch of Highway in California

Korea: Congestion Pricing for Namsan Tunnel in Seoul

Singapore: Cordon Electronic Road Pricing

Chinese Taipei: Exclusive Motorcycle Lanes

Japan: Car Sharing in Fukuoka

United States: Washington State Commute Trip Reduction Program

China: Expanding Bus Rapid Transit

Thailand: Van Transit System in Bangkok Metropolitan Region

Japan: Energy Conservation Law Improves Freight Efficiency

United States: SmartWay Transport Partnership

List of Figures and Tables
Figure i   Sustainable Road Transport Policies and Programs Identified in this Survey
Figure 1   Vehicle production in top ten APEC producers, plus the EU-27 and Brazil
Figure 2   Actual and Projected GHG Emissions for New Passenger Vehicles by Country/Region
Figure 3   Efficient transmissions: an 8-speed automatic transmission at left and a continuously
           variable transmission, both by ZF
Figure 4   Coefficient of drag (Cd) on selected vehicles
Figure 5   Smooth wheel covers reduce drag
Figure 6   Four-wheel, four-stroke kancil in Indonesia, a cleaner alternative to the two-stroke
           gasoline- or diesel-powered bajaj
Figure 7   Three-wheel Bajaj rickshaw with a two-stroke engine powered by compressed natural
           gas
Figure 8   Motorcycle sales in Thailand from 1994 to 2005
Figure 9   Vehicle fuel efficiency labels used in Canada and Singapore
Figure 10 New Zealand vehicle fuel economy label
Figure 11 The Philippines “Road Transport Patrol” logo
Figure 12 Energy Winner Award Logo
Figure 13 Verificentro testing center in Mexico City

                                                v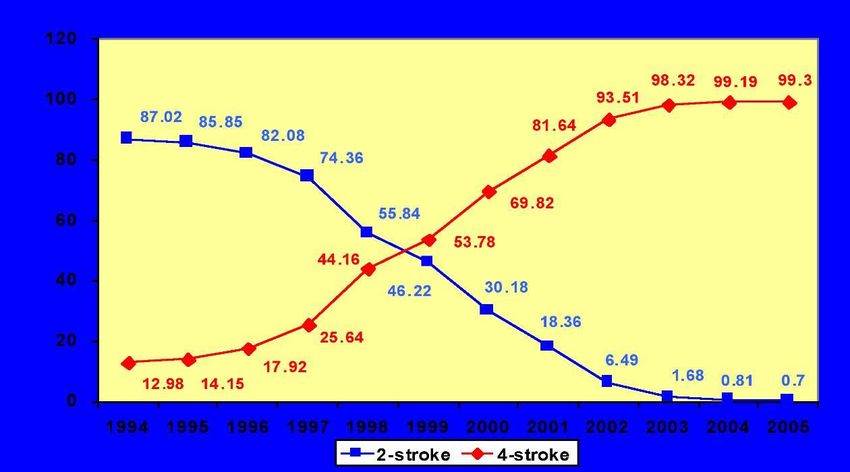
Figure 14 Measuring equipment at an emissions testing center in Manila
Figure 15 500th CNG Corsa delivery in Lima
Figure 16 On-board unit for electronic road pricing
Figure 17 Map of SR 91 express lanes
Figure 18 Express and general purpose lanes of SR 91
Figure 19 January 2008 toll card for SR 91
Figure 20 Speed and volume through Namsan #1 and #3 tunnels
Figure 21 Congestion pricing gantry to enter Singapore’s central business district
Figure 22 Parallel line pedestrian crossings in Taipei City
Figure 23 Exclusive motorcycle lanes in Taipei
Figure 24 Congestion in Tenjin central business district, Fukuoka
Figure 25 Electric cars in Fukuoka car sharing program
Figure 26 Tangle of traffic corridors in the highly congested Puget Sound area around Seattle
Figure 27 TransJakarta BRT
Figure 28 New Metrobús in Mexico City
Figure 29 Electronic sign for bus arrival in the Taipei City MRTS
Figure 30 Vancouver metro 98 bus
Figure 31 Route map for Vancouver metro 98 bus
Figure 32 BRT Station in Changzhou
Figure 33 Train on the Tsukuba Express line
Figure 34 Street car portion of the tram-train Toyama commuter system
Figure 35 Designated, paid parking for motorcycles in the Taipei central business district.
Figure 36 Riverside bicycle lane in Taipei
Figure 37 Transit Village Initiative Logo
Figure 38 Portland bike lane along-side a bus route
Figure 39 Portland planning document
Figure 40 Side skirts and rear drag device added to a truck
Figure 41 Retrofits that can be made to tractor-trailers and the approximate gains in fuel
          efficiency that result from them
Figure 42 Hybrid-electric Coca-Cola delivery truck
Figure 43 SmartWay Transport logo for display by partners meeting the SmartWay criteria
Figure 44 Relationship between fuel price and carbon intensity of selected economies
Figure 45 Comparison of gasoline prices in APEC economies in mid-November 2006
Figure 46 Comparison of diesel prices in APEC Economies in mid-November 2006

                                                 vi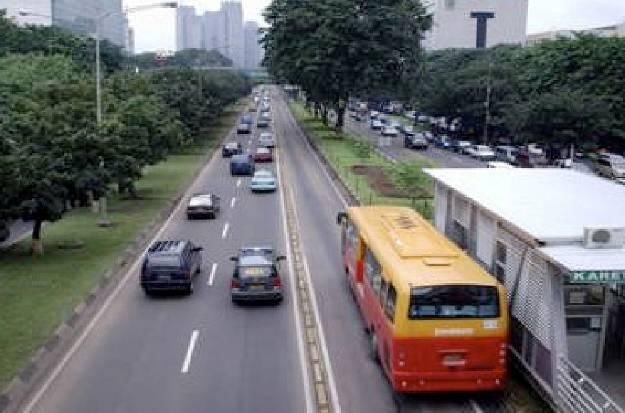
Table 1.   Overall average fuel economy for new vehicle fleets.
Table 2.   Energy used in the average long-haul trucking operation due to drag, friction and
           idling
Table 3.   Typical costs and savings from the SmartWay truck efficiency upgrade kits.
Table 4.   Retail Prices for Fuel in APEC Economies*

                                                vii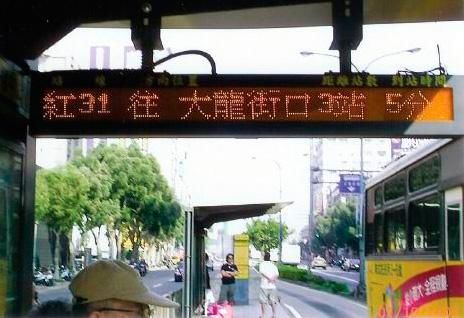
Executive Summary
This survey explores the range of policies and programs available to public sector decision makers to
maximize the efficiency of the transportation sector in their jurisdictions. For purposes of this
discussion, transportation energy efficiency encompasses approaches that either reduce the amount
of fossil fuels used per vehicle-kilometer traveled (VKT) by road or rail, or which reduce the overall
vehicle-kilometers traveled.1 Since countless volumes have been written on these topics, it is the
intent of this survey to distill the large amount of information into concise summaries that provide
APEC policymakers and decision makers with an understanding of the range of proven options for
improving transport efficiency. The authors summarize about 50 examples2 of policies and
programs undertaken by APEC economies to improve transportation energy efficiency.

Strategies for optimizing transport energy efficiency fall into two broad categories: those focused on
vehicles, and those that address urban systems and transportation infrastructure. The latter include
mass transit, toll pricing for road use and parking to discourage the use of single-occupancy vehicles
in central business districts, and land use and zoning decisions that locate mixed uses at higher
densities to help reduce the need to travel. A third category, taxes and pricing of gasoline and diesel
fuel, can influence both the efficiency of vehicles (through buyer purchase decisions) and the use of
vehicles. Examples of these proven approaches to transportation energy efficiency are summarized
below in Figure 1.

Increasing Fuel Economy of New Vehicles
With regard to new vehicles, one of the most common policy instruments for improving fuel
efficiency, and arguably the most effective option for central governments, is through fuel economy
standards imposed on vehicle manufacture or sale. Apart from the European Union, all economies
in the world with fuel economy standards are members of APEC: Australia, Canada, China, Japan,
Korea, Chinese Taipei and the United States, while New Zealand has a fuel economy labelling
scheme for new and used vehicles. With the exception of Australia, the standards are either already
mandatory or—in the case of Canada and the EU—in the process of becoming mandatory.

Automobile manufacturers have a range of technological approaches – backed in several cases by
government-sponsored research and development – for meeting increasingly rigorous standards,
including hybrid-electric drive trains, stop-start technology that automatically shuts off the engine
when the vehicle comes to a standstill, transmissions with more speeds and wider gear ratios,
reduced weight through lighter materials, reduced drag through improved aerodynamic design of
the body, low friction lubricating oil, and low rolling resistance tires. The improvements in

1 This APEC survey addresses only surface transportation, not transportation by air or water modes. In
only a few cases, where data are available, the opportunity to shift among modes (for example from road
to rail for freight) is discussed. This survey does not examine shifts in fuels used for transport, which is
the subject of a separate APEC study by the APEC Biofuels Task Force.
2The authors have endeavored to be as comprehensive as possible in showing the breadth and depth of
proven policies and programs to improve energy efficiency in transportation in all APEC economies. It
was not the authors‘ intention to attempt to catalog every example of each type of policy and program.
Some relevant programs in APEC economies might not have been mentioned in order to avoid
duplication or because information about such policies was not available to the authors. The authors
welcome additional information from readers about examples of innovative programs that might not
have made it into this survey.

                                                     1
efficiency due to hybridization vary greatly depending on the specific vehicle, but they are in the
range of 25% to 50% over corresponding non-hybrid models.

In some cases, governments can also remove inefficient vehicles from the road through tailpipe
emissions standards. This situation applies to two-stroke engines such as the three-wheelers used as
taxis in many developing economies, and to motorcycles. Four-stroke engines are more fuel-
efficient and less polluting than two-stroke, and so threshold emission standards can be set that are
not practically feasible for two-stroke engines powered by gasoline or diesel. Emissions standards
for greenhouse gas emissions can also improve fuel economy while reducing pollution that causes
climate change.
Encouraging Purchase of Fuel-Efficient Vehicles
In countries that manufacture large numbers of vehicles, a common way for policymakers to
increase the purchase of efficient vehicles is through a system that rates and labels vehicles
according to their fuel efficiency. Labels and ratings are excellent tools for helping consumers make
more fuel-efficient choices, and they could usefully be applied in all economies regardless of
whether most vehicles are manufactured domestically or imported. New Zealand—which imports
100% of its vehicles—recently developed a labeling and rating system that converts the different
standards used by different economies into a single efficiency rating on a scale from one to six stars.
The system is applied to used vehicles as well as new, and can provide a useful example for other
APEC economies.

Another common approach is to use taxes to encourage the purchase of efficient vehicles and
discourage the purchase of inefficient ones. Such ―green levies‖ or ―feebates‖ are used in several
APEC economies. The ―feebate‖ approach provides buyers of efficient vehicles with a rebate, and
imposes a surcharge or tax on the purchase of fuel inefficient vehicles, whereby the surcharge funds
the rebate. Governments can also mandate requirements regarding the purchase, maintenance and
operation of their own vehicle fleets, which is not only readily implemented since they have direct
control over these fleet vehicles, but can help drive the market for efficient vehicles.

Awareness campaigns can help influence purchasing decisions by making vehicle buyers more
conscious of the costs associated with operating a vehicle, and by calling attention to vehicle labels
in economies where they exist. Campaigns also inform drivers about ways they can improve fuel
economy through certain driving habits and vehicle maintenance.

Improving Operational Efficiency of Existing Vehicles
While fuel economy regulations combined with efficient technologies ensure that newly
manufactured vehicles are more efficient, the efficiency of vehicles erodes over time if they are not
properly maintained. At some point, the technology of older vehicles also becomes so dated that
maintenance cannot cost-effectively keep them running cleanly and efficiently, and they should be
removed from use altogether. This removal, called scrappage or accelerated retirement, may be
voluntary or mandatory, and it may be triggered by failure to pass an emission inspection, or by the
vehicle‘s age and level of use. Generally more efficient vehicles have lower emissions, but it is
important that the new technologies optimize increases in fuel economy with decreases in emissions.
An accelerated retirement program cannot be effective in the absence of a properly enforced,
mandatory vehicle inspection program that maintains efficiency and, in many cases, also controls
emissions over the life of the vehicle. Quite a few APEC economies have a mandatory annual
vehicle inspection program, but the main challenge is to design it in such a way that certifications
cannot be obtained fraudulently. The Mexico City example described in Chapter 3 provides

                                                  2
valuable lessons for other economies: prevent fraud by using regularly audited testing protocols and
by keeping testing separate from repairs; measure emissions of nitrogen oxides (NOx) using
dynamometer testing to prevent vehicles from falsely passing the test, and use equivalent protocols
and equipment of comparable quality in testing centers in overlapping jurisdictions.
Reducing Congestion
Traffic congestion increases fuel consumption through delays that keep motor vehicles on the road
longer per VKT, and through the fuel inefficiency of stop and go driving. Reducing congestion
encompasses a wide range of approaches that reduce the volume of vehicles on those roads prone to
congestion, and that improve the flow of traffic to reduce or eliminate stop and go traffic. Some
measures to reduce congestion – especially adding road capacity or allowing single-occupancy
hybrids in restricted lanes – may increase total vehicle use and VKT, so it is important that
policymakers consider the possible impact of increased VKT when choosing among approaches to
reduce congestion. Strategies for reducing congestion often focus on encouraging workers to
commute to work by means other than by solo driving, or at least to do less solo driving, and they
can be divided into two broad categories. One targets the roads themselves with regulations or
traffic management techniques such as high occupancy vehicle (HOV) lanes, tolls to discourage the
use of roads during peak traffic times, and lane restrictions that optimize flow on surface roads in
congested areas. The other category of intervention is to provide commuters with options that make
it easier for them to reduce or eliminate their motor vehicle commuting, such as allowing employees
to work from home full or part time (telework), providing employees with transit passes in lieu of a
parking space, and car sharing programs that relieve urban dwellers from the need for vehicle
ownership.
Boosting Efficiency and Use of Mass Transit
Motor vehicles are already overwhelming roads in urban areas in many APEC economies, and as
these areas continue to grow throughout the 21st century they will be utterly incapable of handling
the ever increasing travel demand. Mass transit is a critical component to any comprehensive
approach to improving the fuel efficiency of surface transportation, and it often forms the backbone
of that approach. Since fixed-rail mass transit lines often spur high density growth along them,
mass transit is also a useful planning tool to direct economic growth and density to those areas
where they make the most sense or where they are most needed. Japan, for example, strategically
built its Tsukuba Express Line from Tokyo through undeveloped areas with the vision of having the
line form the backbone of future urban development in these areas. Bus systems are an effective and
affordable option, especially bus rapid transit (BRT) systems that provide higher quality service than
regular bus service. However, bus lines – because they do offer flexibility to accommodate changing
needs – may not have the same effect on shaping urban development and densities. Many cities
throughout the APEC region rely on a combination of buses and urban rail (light and/or heavy),
and sometimes vans.
Urban Design and Planning to Reduce Vehicular Transport
Smart, transit-oriented development harmonizes transportation energy efficiency goals with the
zoning, permitting and regulations issued to developers. For example, in areas well served with
mass transit, carefully crafted zoning laws can create high-density, mixed-use zones that combine
business and housing, making it easy for people to walk or bike to work and to commercial
amenities such as shopping and restaurants. Pedestrian and bicycle paths can be strategically
located to facilitate non-motorized transport between home, work, shopping and dining. The
powerful leverage available in parking can be exploited by restricting parking spaces in areas where
the use of mass transit, biking and walking are practical options. Smart growth planning not only
3improves transportation energy efficiency and reduces pollution and greenhouse gas emissions; it
can also spur economic development and improve the quality of urban life.
Efficient Freight
The freight sector is a significant consumer of energy, and one in which the potential energy
efficiency gains remain mostly untapped in APEC economies, although there are some encouraging
examples of improvements. Fuel use can be reduced by about 25% from long-haul trucking
operations through improvements in aerodynamics, tires, auxiliary power units that minimize
engine idling, engine and drive train technologies, weight reduction, driver training, modal shifts
(for example from roads to rail and sea in Japan), and freight logistics (for example, reducing empty
return-trips). Government policies can help freight carriers take advantage of these opportunities
through regulations, incentives or voluntary programs. Some firms are taking measures on their
own due to rising fuel costs. For short distance city deliveries, for example, Coca-Cola in New York
City found that hybrid-electric trucks are cost-effective in situations where the truck‘s internal
combustion engine is rarely needed at the low speeds characterizing deliveries in urban areas.
Conclusions
A message delivered by many of the APEC examples described here is the need for a comprehensive
approach that considers the interaction among policy measures. For example, a scrappage program
to remove old, inefficient vehicles from the road cannot be effective without a well functioning
emissions inspection program that is free of corruption. Smart growth design and planning is by
definition comprehensive, starting with a vision for a better approach to urban living and then
designing the transportation infrastructure to support that vision. In all APEC economies,
regardless of their level of economic development, transportation energy efficiency policies need to
address the realities of those with low incomes and the trends toward increased driving as incomes
rise. Policies that will have the best results are those that improve access to cleaner, more
sustainable and fuel-efficient mobility options, and that influence travelers to choose the more
energy-efficient option available to them. In all approaches to improve transportation efficiency, it is
vital that the public be made aware of the rationale for the policies and programs, and their benefits.
The many examples highlighted in this study demonstrate that economies throughout the Asia-
Pacific region are taking constructive measures to optimize the efficiency of transportation. Many of
these measures, especially those targeting vehicle efficiency and mass transit, span economies in
varying levels of economic development. Implementation of other measures, most notably
employee incentives to reduce single occupancy vehicles, congestion pricing, car-sharing programs,
smart growth, and efficient freight systems, has so far only been documented in the most developed
economies, but these measures are also within reach of less developed economies. Congestion
pricing generates revenues that can be used to improve transportation systems and provide
assistance to the poor. Smart growth planning and efficient freight necessarily involve the private
sector and their resources, and car sharing programs are being run profitably around the world by
the private sector. It is the authors‘ objective that the information provided by this Survey of Policies
and Programs in APEC Economies will provide the knowledge of practical strategies being
implemented by others in the region to inspire all APEC economies to adopt proven strategies for
promoting energy efficiency in surface transport.
4Figure i. Examples of Sustainable Road Transport Policies and Programs Highlighted in this Survey
Papau New Guinea
Hong Kong, China
Chinese Taipei
United States
New Zealand
Darussalam
Philippines
Singapore
Indonesia
Australia
Malaysia
Thailand
Canada
Mexico
Russia
Brunei
Japan
Korea
China
Chile
Peru
Viet Nam
APPROACHES
Vehicle Fuel Economy Standards • • • • • • • •
Labelling Vehicles for Fuel Efficiency • • • • • • •
Incentives to Purchase Efficient Vehicles • • • • • •
Emissions Standards & Inspections • • • • • • • • • • • • • • •
Vehicle Retirement or Scrappage • • • •
Government Fleets (efficiency in) • • •
Awareness Campaigns • • • • •
Efficent Vehicle Technology (R&D) • • • •
Congestion Pricing • • • • •
Maximizing Flow in Highway Lanes • •
Car Sharing • • •
Employee Incentives to Reduce SOVs •
Bus Rapid Transit • • • • • • • • • • • • • •
Light Rail • • • • • • • • •
Smart Growth and TOD • • • •
Efficient Freight Initiatives • • • •
Retail Gasoline (premium grade) Prices
(US$/L)* 0.93 0.34 0.84 1.09 0.69 1.69 0.57 1.08 1.65 0.53 0.74 0.98 0.94 1.22 0.76 0.77 0.92 0.83 0.70 0.63 0.67
Retail Diesel Prices (US$/L) 0.94 0.21 0.78 0.86 0.61 1.06 0.44 0.9 1.33 0.4 0.52 0.7 0.64 0.86 0.67 0.66 0.63 0.71 0.65 0.69 0.53
* Average prices from November 2006.
51. Increasing Fuel Economy of New Vehicles
Transportation has a fundamental relation to many of the
pressing challenges facing the APEC economies—including 0 5 10 15 20
health, national security, the environment and prosperity—a
topic that has been discussed at length in numerous EU-27
publications.3 Although APEC consists of onlyonly Japan
21economies, the region is home to a large portion of the U.S.
world‘s people: over half of the world‘s most populous 100
cities are in the APEC region with urbanization and demand China
for mobilization still on the rise in developing economies.4 Korea (So.)
Not only does the APEC region represent a significant Brazil
portion of the world‘s new and existing vehicle stock, but the
region also produces many of the world‘s vehicles, placing it Canada
in a position to profoundly affect the efficiency of the world‘s Mexico
vehicles in the future. Apart from the EU-27, which leads India
global vehicle production with 18.6 million in 2006, the next
Russia
four largest vehicle manufacturing economies are Japan, the
United States, China and Korea. These four economies make Thailand
up almost half of the world‘s production of motor vehicles, Malaysia
and 62% of the world‘s vehicles originate from the APEC
economies (Figure 1).5 The main approaches to improving
Figure 1. Vehicle production
fuel economy of new vehicles are fuel economy standards, in top ten APEC producers,
emissions standards and development of efficiency vehicle plus the EU-27 and Brazil (2006,
technology. millions). (Source: ref. 6)
Figure ii
Table 1. Overall average fuel economy for Fuel Economy Standards for New Vehicles
new vehicle fleets.
The most universal policy instrument for
Economy Miles per gallon (year) improving the fuel efficiency of new vehicles, and
Japan 37.9 (2004) arguably the most effective option at the level of
central government, is through specific fuel
Korea 30.8 (2007) economy standards imposed on vehicle
China 28.4 (2006) manufacturers. Apart from the European Union,
all economies in the world having fuel economy
Canada 25.4 (2004)
standards are members of APEC: Australia,
U.S. 24.7 (2004) Canada, China, Japan, Korea, New Zealand,
Chinese Taipei and the United States. With the
3See for example: ―Bellagio Memorandum on Motor Vehicle Policy Principles for Vehicles and Fuels in
Response to Global Environmental and Health Imperatives: Consensus Document‖, June 2001, Energy
Foundation (www.theicct.org/documents/bellagio_english.pdf); and ―Urban Transport Energy Use in
the APEC Region: Trends and Options‖, Asia Pacific Energy Research Centre, 2007
(www.ieej.or.jp/aperc/2007pdf/2007_Reports/APERC_2007_Urban_Transport.pdf).
4"The Principal Agglomerations of the World", Th. Brinkhoff, data as of 2007-09-30
(http://www.citypopulation.de).
5World Motor Vehicle Production by Country, International Organization of Motor Vehicle
Manufacturers, http://oica.net/wp-content/uploads/2007/06/worldprod_country-revised.pdf.
6exception of Australia, the standards in all of these economies are either already mandatory or—in
the case of Canada and the EU—in the process of becoming mandatory.
One way of comparing the fuel efficiency of vehicles in different economies is through the overall
average fuel economy for the entire fleet of vehicles manufactured in a given year, shown in Table 1
for five APEC economies. Looking at the overall fleet is useful because it represents the fuel
efficiency of what was actually manufactured and sold, which can be more informative than a set of
different standards for different classes of vehicles (e.g. passenger cars, light duty trucks, and heavy
duty vehicles), especially since the classifications vary among economies.
Figure 26 looks at the situation differently, charting current and projected greenhouse gas emissions
for new passenger vehicles that result from rising stringency of fuel economy standards, which are
inversely related to greenhouse gas emissions.7 The more stringent Japanese standards have not
damaged the competitiveness of Japanese vehicles in the world market. In 2006, the top two
Japanese makers (Toyota and Honda) combined produced 10.35 million cars (defined as up to 8
passenger seats in addition to the driver), compared to 9.5 million for the two largest U.S.
manufacturers (General Motors and Ford), and Toyota and Honda continue to be competitive even
during a world economic slowdown.8
6―Passenger Vehicle Greenhouse Gas and Fuel Economy Standards: A Global Update, Feng An, Deborah
Gordon, et al. The International Council on Clean Transportation‖, July 2007
(http://www.theicct.org/documents/ICCT_GlobalStandards_20071.pdf); “Comparison of Passenger
Vehicle Fuel Economy and Greenhouse Gas Emission Standards Around the World‖, Feng An and
Amanda Sauer, Pew Center on Global Climate Change, December 2004
(http://www.pewclimate.org/global-warming-in-depth/all_reports/fuel_economy); Updated 2009,
Michael Walsh, International Council on Clean Transportation, May 2009.
7Accurate comparisons among economies require that all standards be normalized to one testing
procedure used to measure fuel economy. The importance of the test cycle can be illustrated by
comparing the fuel efficiencies calculated from different tests for a selected model. For example, a Toyota
Corolla would rate at 32.4 mpg using the New European Drive Cycle (NEDC), 34.8 using the U.S.
Corporate Average Fuel Economy (CAFE) procedure, and 27.6 using the new Japanese JC08 test cycle.
8―World Motor Vehicle Production Ranking of Manufacturers‖, International Organization of Motor
Vehicle Manufacturers, 2006. (http://oica.net/wp-content/uploads/2007/07/ranking06.pdf)
7Figure 2. Actual and Projected Fuel Economy for New Passenger Vehicles by Economy, 2002–2018
[1] The relative stringency of Europe’s CO2-based standards is enhanced under a fuel
economy standard because diesel vehicles achieve a boost in fuel economy ratings due to
the higher energy content of diesel fuel.
[2] For Canada, the program includes in-use vehicles. The resulting uncertainty of this
impact on new vehicle emissions was not quantified.
[3] Shaded area under the California trend line represents the uncertain amount of non-
fuel economy related GHG reductions (N2O, CH4, HFCs, and upstream emissions related to
fuel production that manufacturers will generate from measures such as low-leak, high
efficiency air conditioners, alternative fuel vehicles, and plug-in hybrid electric vehicles).
Source: “Passenger Vehicle Greenhouse Gas and Fuel Economy Standards: A Global
Update”, Feng An, et al., The International Council on Clean Transportation, July 2007.
8Actual and Projected GHG Emissions for New Passenger Vehicles by Country/Region, 2002-2020
270
Dotted line: Proposed or contested
GRAMS CO 2 PER KILOMETER (NEDC TEST
Solid lines: Enacted
250
230
AUSTRALIA
210
UNITED STATES
S. KOREA
190
170 CHINA
CALIFORNIA
150
130
EUROPEAN UNION
JAPAN
110
90
2002 2004 2006 2008 2010 2012 2014 2016 2018 2020 2022
Source: Passenger Vehicle Greenhouse Gas and Fuel Economy Standards: A Global Update,
ICCT. May 2009 update.
The United States‘ Energy Independence and Security Act (EISA) of 2007 increased the economy‘s
fuel economy standards for the first time in thirty years. By the year 2020, new cars and light trucks
must meet a fleet average of 35 mpg, and medium- and heavy-duty vehicles must make ―maximum
feasible‖ and ―cost effective‖ fuel economy improvements. The EISA CAFE standards start to take
effect in 2011 and are projected to achieve cumulative savings of carbon dioxide in the order of 700
million metric tons according to the Natural Resources Defense Council.9
On May 19, 2009, President Obama further proposed a national fuel efficiency plan to adopt uniform
federal standards that regulate both fuel economy and greenhouse gas emissions to cover model
years 2012-2016 that will move average fuel economy to 35.5 miles per gallon by 2016—making it
more stringent than the statutory fuel economy standards passed in EISA 2007. This joint rule-
making process between the U.S. Environmental Protection Agency (EPA) and the Department of
Transportation (DOT) would result in a projected reduction in oil consumption of approximately 1.8
billion barrels during that period and reduce greenhouse gas emissions by approximately 900
million metric tons.10 Furthermore, the plan provides the auto industry with uniformity and
9Barratt-Brown, Liz, ―New fuel economy savings marred by tar sands,‖ posted on Liz Barratt-Brown‘s
Blog, 5 February 2008 (http://switchboard.nrdc.org/blogs/lizbb/beauty_new_fuel_efficiency_sta.html).
10White House Press Release, May 19, 2009 (http://www.whitehouse.gov/the_press_office/Fact-Sheet-
and-Particpants-at-Todays-Rose-Garden-Event/).
9certainty through 2016, by means of a national standard, while preserving the rights of states such as
California to continue to set their own more stringent regulations if desired.11
China is also considering increased stringency in their fuel economy standards, which would require
Chinese automakers to improve fuel economy by an additional 18% by 2015, with a possible average
fuel economy of 42.4 miles per gallon in 2015.12
Efficient Vehicle Technology
The myriad of available technologies
to optimize the efficiency of motor
vehicles can fill volumes, and this
paper will not attempt to do the topic
justice. This section provides a brief
overview of some of the recent
efficiency innovations that are
already being adopted by automobile
manufacturers. It also references Figure 3. Efficient transmissions: an 8-speed automatic
some of the research and transmission at left and a continuously variable transmission,
development (R&D) programs within both by ZF. (Photos from ZF Batavia LLC)
APEC that provide funding for the
high-risk, pre-competitive research needed to create vehicles for the future. Fuel efficient
technologies and R&D programs for heavy trucks are discussed in Chapter 7 on Efficient Freight.
Hybrid electric drive trains use an electric motor in conjunction with a petroleum-fueled internal
combustion engine. The full hybrid system developed by Toyota, and now used by Ford and
Chrysler as well, can drive the wheels of the vehicle with the engine or the electric motor, either in
concert or separately. Power assist hybrids, also called medium hybrids, mainly rely on the engine.
Most cannot run on electric power alone, although some can do so once the vehicle has reached a
certain cruising speed. The improvements in efficiency due to hybridization vary greatly depending
on the specific vehicle, but they are in the range of 25% to 50% over corresponding non-hybrid
models. Yet another class of vehicle is variously known by phrases such as ―mini hybrids,‖ ―micro
hybrids‖ and ―hollow hybrids.‖ These are not hybrid vehicles because the electric motor does not
provide additional torque to power the drive train, but they do use an electric motor to boost
efficiency through regenerative braking13 and by allowing the engine to automatically turn off when
Broder, John M., ―Obama to Announce New Mileage and Emissions Standards,‖ The New York Times, 18
11
May 2009 (http://www.nytimes.com/2009/05/19/business/19emissions.html).
12Bradsher, Keith, ―China Is Said to Plan Strict Gas Mileage Rules,‖ The New York Times, 27 May 2009
(http://www.nytimes.com/2009/05/28/business/energy-environment/28fuel.html?_r=1).
13Regenerative braking is now available in hybrid vehicles. It takes energy normally wasted during
conventional braking and turns it into usable energy that is typically transferred into the vehicle‘s
chemical storage battery that powers the car at city speeds. At slower speeds in stop-and-go traffic, the
electric motors in hybrids help the vehicle stop by reversing their direction when the driver applies the
brakes. The torque created by this reversal counteracts the vehicle‘s forward momentum and eventually
stops the car. Traditional brakes, on the other hand, use friction to counteract a car‘s forward movement,
creating excess heat energy that dissipates into the air and wastes up to 30 percent of a car‘s generated
power.
10the engine is not needed (i.e., when coasting, braking or stopped) then smoothly turn back on again.
Efficiency improvements in the ―mini hybrids‖ are on the order of 10%. Plug-in hybrids have the
potential to further reduce fuel consumption and increase efficiency.
Idle stop or stop-start technology automatically shuts off the engine when the vehicle comes to a
standstill, then starts it again when the accelerator is pressed. The resulting reduction in fuel
Figure 4. Coefficient of Drag (Cd) on Selected Vehicles. From left to right:
Mercedes-Benz concept car (0.19), Toyota Prius (0.29), and Ford Ranger ( 0.4).
(Photos courtesy of DaimlerChrysler AG, Toyota Motor Corporation, and Ford Motor Company, respectively.)
consumption is in the range of 5% to 7%, although some manufacturers have claimed more
compelling results. Daimler Chrysler, for example, claims that the idle stop feature in the 2008
micro hybrid version of the Mercedes Benz Smart Car improves fuel economy by up to 8% for a
combination of highway and urban driving, but shaves up to 20% from fuel usage when driving is
confined to the city.14 Similar fuel savings are possible with electric regenerative braking—in the
range of 5% to 10%15—so that vehicles combining regenerative braking and idle stop will see an
improvement in fuel efficiency of at least 10%.
For a given engine size and type, one of the main opportunities for improving the overall efficiency
of the drive train is in the transmission. There are two factors that can improve transmission
efficiency: a larger number of speeds and a wider ratio transmission. Six-speed transmissions are
rapidly becoming more common, and 7- and 8-speed automatic transmissions are now available in
some luxury cars. The schematic in Figure 3 shows an 8-speed automatic transmission by ZF. The
company cites a 14% improvement in fuel efficiency over a typical automatic 5-speed transmission.16
Another innovation in transmission technology is a long transmission ratio gearbox that provides
greater spread between the low and high gears. This gives the engine a wider range of speeds
(revolutions per minute, or rpm) in which to operate at its highest efficiency, providing improved
fuel economy even at high speeds. General Motors finds that their six-speed automatic improves
fuel economy up to 4% over a four-speed version, in part because it allows the engine to run at
lower rpm at highway speeds, and in part because the overall transmission ratio is 6:1 rather than
―Less Gas And More Style: Smart To Launch Exclusive For Two Micro Hybrid Drive Model,‖
14
DaimlerChrysler AG, September 2007
15―Effectiveness and Impact of Corporate Average Fuel Economy (CAFE) Standards,‖ National Research
Council, National Academy Press, 2002
(http://www.nap.edu/openbook.php?record_id=10172&page=31).
16 ―The Automatic Transmission Development and Their Contribution to the Overall Emissions
Reduction,‖ Herbert Mozer, ZF Batavia LLC , March 2003.
(ftp://ftp.arb.ca.gov/carbis/cc/techsem/final_presentations/mozer_autotrans.pdf)
11the 4:1 ratio found in most four-speed
automatics.17 Making a relatively recent
appearance in new vehicles is the
continuously variable transmission, which
has two features that optimize efficiency.
One is that it transitions smoothly between
gears to keep the engine at the optimal
torque where it runs most efficiently, and
the other is that it has a high transmission
gear ratio, typically 6:1.18
In the body of the car, there are two routes Figure 5. Smooth Wheel Covers Reduce Drag
for improving fuel efficiency: reducing (shown on a GM Opel Corsa Eco)
weight through lighter materials, and (Photo courtesy of General Motors)
reducing drag through improved aerodynamic design of the body. In passenger vehicles, body
shape is critical to reducing drag, as illustrated by Figure 4 showing three different body shapes and
their corresponding coefficient of drag. Drag can further be reduced by streamlining the flow of air
underneath and around the car and through the engine compartment, using underbody panels,
smooth wheel covers (Figure 5), and modified air intakes on the grille, respectively. According to
some manufacturers of advanced aerodynamic technologies, reducing drag of light trucks can
increase fuel economy by up to 10%, saving about US$300 per truck per year in fuel costs; savings
for heavy and medium trucks are estimated at 20% and US$10,000 annually.19
Finally, further gains are possible in the tires and oil. A field test of 2,116 passenger cars of 21
different models found that the use of low friction lubricating oil shaved 5.5% from fuel
consumption.20 Low rolling resistance tires also provide fuel savings, with estimates ranging from
an average of 2% (conservatively) to 4%.21 Greater savings in the range of 5% are possible with the
lower speeds and frequent stopping and starting of city driving.22
By implementing such proven technologies, the total energy-efficiency gains that can be made in
new vehicles are estimated by the Pew Center on Global Climate Change to be over 30% within the
next decade and as much as 100% by 2030. As noted in a Pew Center report on transportation in the
United States, it will take time before the older and less efficient vehicles are retired, so the average
17―GM Pushing Hard on Six-Speed Automatics; Introduces Three More,‖ Green Car Congress, June 2006
(http://www.greencarcongress.com/2006/06/gm_pushing_hard.html).
18―New Transmission Technologies,‖ Shahed Hussain, Velocity Automotive Journal, April 2006
(http://www.velocityjournal.com/articles/2006/614.html).
19Wood, Richard M. ―Advanced Energy Efficiency Technologies for the Transportation Industry,‖
SOLUS – Solutions and Technologies LLC, presentation for The Commonwealth of Virginia Energy &
Sustainability Conference, 16-18 October 2007, at Virginia Military Institute, Lexington, Virginia USA.
20Friedrich, Axel, ―Addressing Energy Efficiency in the Transport Sector,‖ GTZ, 2007
(http://siteresources.worldbank.org/INTTRANSPORT/Resources/336291-1171658979314/3465102-
1175712029532/Dr_Friedrich_Fuel_taxation260307.pdf).
21American Council for an Energy-Efficient Economy. ―Tire Standards Would Save Energy Without
Adversely Affecting Safety,‖ July 2005 (http://www.aceee.org/transportation/tire.pdf).
22 Friedrich 2007.
12efficiency of all vehicles in use in 2015 will possibly increase by 10% to 15%, with corresponding
reductions in GHG emissions of 11%.23
In a report published by a new initiative aimed at making cars 50% more fuel-efficient by 2050
worldwide, or the 50 by 50 Global Fuel Economy Initiative (GFEI), the initiative‘s founding partners,
UN Environment Programme (UNEP), International Energy Agency (IEA), International Transport
Forum (ITF) and FIA Foundation, cite numerous analyses demonstrating the potential to achieve up
to 50% savings in fuel consumption per 100 km by 2030-2035 that can be achieved with the wider
adoption of existing and commercially available technologies. Advanced technologies such
hydrogen fuel cell vehicles can offer further efficiency improvements but should not be necessary to
achieve 50% fuel economy improvement. In order to stay on track to achieving the 50 by 50 goal, the
GFEI has set interim targets of 30% fuel economy improvement in new cars by 2020 and 50% by
2030, with the remaining efficiency improvements to be achieved in on-road and operational
efficiency of existing fleets. 24
Despite the growing awareness and attention surrounding hybrid vehicles, their market penetration
remains relatively low. In the U.S. market, hybrid sales have risen from 1.6% of new vehicle sales in
2006 to a little over 2% in 2007 and 2008, with sales from January to June in 2009 totaling about 2.6%
of new light-duty vehicle sales.25 This relatively low level of market penetration for a highly-
publicized vehicle type indicates the need for increased consumer awareness and efforts to
overcome market barriers to spur adoption and market penetration of existing technologies -- while
research, development, and innovation continues for advanced technologies that can move
economies to a high-efficiency, low-carbon mobility.
Canada’s ecoTECHNOLOGY for Vehicles Fund
In Canada, a new program called ecoTECHNOLOGY for Vehicles (eTV), is one of six initiatives
under the Government of Canada‘s ecoTRANSPORT strategy. eTV funds testing and evaluation of
emerging technologies for vehicles in Canada. The program aims to foster partnerships with the
automobile industry to identify and overcome barriers to the introduction and adoption of advanced
vehicle technology. eTV also engages in outreach to raise awareness for these technologies and
provide Canadians with information that incorporates environmental impacts to better inform
Canadians‘ decisions about vehicles they purchase.26
China’s New R&D Centers for the Economy’s Growing Automobile Industry
As a step toward fulfilling Chinese ambitions of designing and manufacturing cars that will not be
tied to foreign intellectual property, China‘s largest automobile company – the Shanghai
Automotive Industry (Group) Corporation (SAIC) – is in the process of establishing a technology
R&D center in Anting, one of Shanghai‘s municipalities. In February 2008, Chinese automaker BYD
Auto opened another R&D center in Shenzhen. The new center will be used to test core components
23Greene, David L. and Andreas Schafer, ―Reducing Greenhouse Gas Emissions From U.S.
Transportation,‖ prepared for the Pew Center on Global Climate Change, May 2003.
24―50 by 50 Global Fuel Economy Initiative,‖ Joint initiative of FIA Foundation, International Energy
Agency, International Transport Forum, UN Environment Program,
(http://www.fiafoundation.org/50by50/Documents/50BY50_report.pdf), 2009.
25Correspondence with Jennifer Watts, Senior Manager of Marketing & Communications, Electric Drive
Transportation Association, 13 July 2009.
26―ecoTECHNOLOGY for Vehicles,‖ Transport Canada, 20 Aug. 2009,
(http://www.tc.gc.ca/programs/environment/etv/menu-eng.htm), Oct. 2009
13of the automaker‘s electric vehicle. 27 Non-Chinese automakers, e.g. Toyota, Honda, GM, Peugeot
Citroen, have also stated plans to open R&D centers in China in the near future. The center
developed in partnership with GM is to focus on alternative energy and environmentally friendly
technologies.28
Japan: Vehicle R&D Programs
The Japanese government has sponsored research on electric vehicles and other clean, energy-
efficient technologies for over two decades. According to interviews that the U.S. Office of
Technology Assessment conducted with Japanese ministries and auto industry engineers, the
Japanese work on advanced technologies was allowed to lapse until the U.S. state of California
adopted its zero emissions vehicle regulations that went into effect in 1998.29 The reasons given for
the lapse were the problems with achieving sufficient battery performance, and doubts that there
would be broad consumer interest in electric vehicles. Furthermore, automobile manufacturers felt
that the best environmental and efficiency gains would be made through more aerodynamic design,
lighter vehicles, and intelligent vehicle-highway systems. 30
Over the past decade, Japanese automakers have established strategic alliances directly with non-
Japanese companies. For example, Toyota and GM have an agreement to exchange fuel cell
technology, and Nissan is working with Renault on fuel cell vehicles running on gasoline. Toyota
and GM have also teamed with Exxon-Mobil on the development of clean hydrocarbon fuel and
reformers for fuel cell vehicles.31
United States: Vehicle Technologies Program32
Under its Vehicle Technologies Program, the U.S. Department of Energy (DOE) has established the
FreedomCAR and Fuel Partnership to support and fund high-risk research that will help develop
the technologies and fueling infrastructure needed to make affordable, clean personal vehicles that
minimize pollution and the dependence on petroleum imports. The partners conducting the
research examine new applications of the above-mentioned technologies, as well as the development
of systems for fuel cells and hydrogen storage, for electric propulsion and electrical energy storage,
as well as for advanced combustion and emission controls for internal combustion engines using a
variety of fuels. While the partners – including the U.S. DOE, energy companies and the U.S.
27 Joanne Jiu, ―BYD Auto opens R&D center in Shenzhen,‖ Gasgoo.com, 22 February 2008 at
http://www.gasgoo.com/auto-news/5797/BYD-Auto-opens-R-D-center-in-Shenzhen.html. BYD group
is the world‘s largest manufacturer of batteries for cellular phones, and the company entered the
automobile market in 2003.
28―GM Planning a Clean-Tech R&D Center in China,‖ 29 October 2007 at
http://www.edmunds.com/insideline/do/News/articleId=123214.
29Office of Technology Assessment, Advanced Automotive Technology: Visions of a Super-Efficient Family Car,
September 1995, OTA-ETI-638, GPO stock #052-003-01440-8, p. 248. The OTA analysis did not offer an
explanation as to why the California policy spurred the Japanese automakers to jump-start their R&D
programs, or if the timing was coincidental. One could speculate that the policy change was viewed by
the automakers as a way to stimulate the market for electric vehicles.
30 Ibid.
31Avadikyan, Arman, et al, ed., The Economic Dynamics of Fuel Cell Technologies, Bureau d‘Economie
Théorique et Appliquée, Institut Française de l‘Energie, Institut d‘Economie et de Politique de l‘Energie,
Association Française de l‘Hydrogène, 2003, p. 196.
32For more information see the Vehicle Technologies Program website for the U.S. DOE at
http://www1.eere.energy.gov/vehiclesandfuels/.
14Council for Automotive Research (USCAR)33 – conduct research independently, they work jointly on
road-mapping, setting priorities and monitoring activities needed to achieve the Partnership‘s goals.
The road-mapping involves identification of barriers, setting technology-specific R&D goals and cost
targets, and determining milestones for evaluating progress.
In June 2009, DOE and the National Renewable Energy Laboratory (NREL) launched TransAtlas, a
comprehensive mapping tool to help industry and government planners implement alternative fuels
and advanced vehicles. Sponsored by DOE‘s Clean Cities initiative, a government-industry
partnership through the Vehicle Technologies Program which aims to reduce petroleum
consumption in the transportation sector, the interactive Google Maps tool maps out alternative
fueling stations (such as hydrogen, electric, CNG, or biodiesel), vehicle density, production facilities,
and existing road infrastructure in a user-friendly and customizable format.34 This tool can be used
to assess current infrastructure, delivery capacity, and market penetration by vehicle type and
region, providing a basis for future planning and expansion. Additionally, to facilitate adoption of
alternative fuels, the Vehicle Technologies Program‘s Mobile Alternative Fueling Station Locator
allows consumers to locate and navigate to their needed alternative fueling station on their cell
phones at anytime.35
Emissions Standards for New Vehicles that Improve Vehicle Fuel Economy
While APEC economies with major automobile manufacturing industries stress fuel efficiency
standards as a way of regulating vehicle efficiency, sometimes the same result can be obtained by
regulating new vehicle emissions instead, which have the effect of forcing fuel economy
improvements.36 As presented in the following case study, Thailand set such strict criteria pollutant
emissions standards on new motorcycles that it forced manufacturers to stop making motorcycles
with two-stroke engines, which have poorer fuel economy than four-stroke engines. It is worth
noting that the Thai approach combines two strategies: emissions standards and inspections. (A
more detailed discussion about mandatory vehicle emissions inspections is found in Chapter 3.)
Another example from Indonesia shows how emissions standards forced an Indian manufacturer
and exporter of auto-rickshaws to use more efficient engine technology to make a model that runs
more efficiently and use relatively cleaner fuel. These regulations were driven by the desire to
33Energy companies are BP America, Chevron Corporation, ConocoPhillips, Exxon Mobil Corporation,
and Shell Hydrogen. USCAR partners are DaimlerChrysler Corporation, Ford Motor Company, and
General Motors Corporation.
―Customizable Interactive Map Shows U.S. Alternative Fuel Data,‖ National Renewable Energy Lab
34
News Release, 9 June 2009 (http://www.nrel.gov/news/press/2009/697.html).
35―Alternative
Fuel Station Locator Goes Mobile,‖ U.S. Department of Energy, Energy Efficiency and
Renewable Energy, 9 February 2009,
(http://www.afdc.energy.gov/afdc/progs/ddown.php?afdc/WHATS_NEW/872/).
36It is worth noting that some of the newer vehicle technologies such as hybridization have a trade-off
between fuel economy and emissions. Tests run and analyzed by the Argonne National Laboratory
found that ―hybridization without changing the engine size can increase fuel economy (18% in the
example), but increase NOx emissions (25% in the example). However, if the engine had ideal
characteristics for a hybrid vehicle with larger islands of high efficiency and low emissions (originally
developed for the PNGV program), the result could be a fuel economy increase of about 13%
accompanied by a NOx decrease of almost 40%.‖ Source: Rousseau, Aymeric et al, ―Trade-Offs Between
Fuel Economy and NOx Emissions Using Fuzzy Logic Control With a Hybrid CVT Configuration,‖
Center for Transportation Research, 2002. http://www.transportation.anl.gov/pdfs/HV/433.pdf.
15You can also read