From tents to no tenants - Managing development when the Gladstone housing market radically changes from shortage to saturation - Trudi Smith and ...
←
→
Page content transcription
If your browser does not render page correctly, please read the page content below
From tents to no tenants - Managing development
when the Gladstone housing market radically
changes from shortage to saturation.

   Trudi Smith and Matt Kelly

   Gladstone Regional Council
   Development Services Department
   Planning Services Section

                                           Page | 1
Abstract
Gladstone City is located approximately 530 kilometres North of Brisbane and is home to
Queensland's largest multi-commodity deep sea shipping port. The local government
amalgamations resulted in the Gladstone City Council amalgamating with Calliope and
Miriam Vale Shire Councils to give a total area of 10,488km2 and a population of
approximately 57,000 in 2008.
Less than two years later, the Coordinator General approved several significant projects
which resulted in Gladstone and the surrounding area experiencing astronomical growth
within the short period of time between 2010 and 2014. All of a sudden, the world was
interested in this small Central Queensland city and everyone wanted their piece of the
action. The lodgement of Development Applications increased along with innumerable
telephone and counter enquiries from potential developers and investors.
The Gladstone community moved rapidly from a close knit family orientated environment into
a transient population, with an influx of over 15,000 workers arriving. Although Development
Permits were in place for subdivisions and residential development, the construction of these
developments became problematic due to the lack of accommodation for the indirect
workers as well as obtaining and retaining a work force in existing businesses. The
population boom drained the housing rental market with a vacancy rate of 0.8% and the cost
of living soared. People were living in caravans and in their cars, with motels and hotels ‘hot
bedding’ the shift workers. People were also sharing Dwelling Houses with up to 12 people
reported to be living in a single residence.
Development Applications were lodged and approved (some by Court Order) over sites that
were located on the periphery of the City where significant infrastructure was required to
service development. These Development Permits, along with the approval of large scale
residential developments prior to the Council amalgamations have resulted in intensification
of residential uses in areas that, under different circumstances, may not have been
supported. By the end of 2015, Gladstone was left with an oversupply of residential lots,
Dwellings Houses and Units (12% vacancy rate) and a burgeoning urban footprint.
Gladstone has since returned to 'pre boom' and consideration to managing future impacts of
rapid population growth followed by more stable phases of development needs to be
addressed to ensure the viability of the region. The proposed development of sites outside of
the urban area (zoned Emerging Community) and the lack of and then oversupply of units
and residential lots, now requires Applicants to address community need in their planning
application.
This paper highlights the reasoning behind the requirement to protect the economic viability
and long term function of the Gladstone region as well as ensuring that residential
development occurs in step with community need.
Page | 2Introduction
Peaks and troughs in Gladstone have for decades evolved around industrial and port based
industry, with Auckland Point port commencing operations in 1880 (Gladstone Ports
Corporation, 2013). Currently, Gladstone is one of Australia's key resource hubs with a
throughput of 115.9 million tonnes of product in the 2015-2016 year between the Gladstone
Port Authority's wharves (Gladstone Ports Corporation, 2013).
Development in Gladstone is directly linked to resource activities which results in complex
interactions and cumulative impacts that are, at times, difficult to manage and predict. It was
predicted by the Office of Economic and Statistical Research (OSER) during the most recent
boom, that Gladstone will be the third fastest growing local government area in Queensland
by 2021 with an average growth rate of 3.1% (Akbar, D. Rolfe, J. Kabir, SM, 2013).
Gladstone's history of boom and bust
“The greatest tragedy would be to accept the refrain that no one could have seen this
coming, and thus nothing could have been done. If we accept this notion, it will happen
again” (Financial Crisis Inquiry Commission, 2011).
The peaks and troughs relating to industry in Gladstone first occurred with the construction
of Queensland Aluminium Limited in 1967. The influx of people required for the construction
of the aluminium smelter transformed a small quiet town that had unsealed roads, no
sewerage and limited community facilities (Barker, 1981).
In an article titled 'Multinational Gladstone: Developers’ feast, social famine’, Tom Barker
stated that in 1967, "when the population began to increase at a rapid rate, the city was
caught without the funds or the lead time to provide essential services" (Barker, 1981; p103).
It is interesting to note that whilst the above was written about the influx of people in 1967
the reference could also have been written about Gladstone in 2010 ‘there were not enough
houses to accommodate the influx of construction workers’, and ‘families with children slept
in their cars until they could find proper accommodation’ (Barker, 1981; p103). "Caravan
parks did a roaring trade until they became overcrowded and could not handle the demand
and caravans in backyards became commonplace, although against Council policy", 43
years later history was repeated (Barker, T. 1981, p103).
There have been several other major construction projects in Gladstone since 1967 which
include:
Gladstone Power Station, referred to as NRG is a coal fired power station which was first
conceived in 1969 and was constructed by the Government designated State Electricity
Commission of Queensland (Gladstone Power Station, 2008). In October 1988, the coal-
fired power station underwent a $42 million refurbishment program to improve the
operational and environmental performance and in 1994, (following the sale of the station), a
$180M capital works program was undertaken, half of which was for environmental
improvements (Gladstone Power Station, 2008).
Awoonga Dam, has a history dating back to Gladstone’s first year of settlement in 1843
however with the advent of Queensland Aluminium Limited (QAL) in the mid 60’s, it became
necessary to construct the first stage of a concrete weir to ensure an adequate water supply
to the new industries within the region (Placestories, 2017). In 1966, the Awoonga Weir
Stage 1 was constructed in the Boyne River and shortly after in 1970, the Awoonga Weir
Stage 2 was constructed (Placestories, 2017). Demand for water resulted in the weir being
raised in 1970 with bulk excavation for Awoonga High Dam commencing in 1975, and a 1
metre extension to the existing dam completed as an interim measure in 1976 (Gladstone
Page | 3Area Water Board, u.d.). Stage 1 for the construction of the Awoonga High Dam was
completed in 1984 and commissioned in 1985 however demand for water resulted in
discussions on raising the dam wall a second time. Discussion occurred in 1998 / 1999 and
the works commenced in 2001 and were completed in 2002 (Gladstone Area Water Board,
u.d.). More recently the Gladstone Area Water Board (GAWB) gained approval in June 2016
for the construction of an offline storage reservoir which is proposed to reduce the risk of
lack of water supply in the event that the Awoonga Dam fails to provide water supply to the
Gladstone region.
Cement Australia was constructed in 1981 and is Australia’s largest cement plant with a
production capacity of over 1.7 million tonnes of cement per annum (Cement Australia, u.d.).
Boyne Smelter Limited (BSL) opened in 1981 and produced 210,000 tonnes of aluminium
per year (Boyne Smelter Limited, u.d.). In 1997 Boyne Smelter Limited expanded, doubling
in size to be Australia’s largest aluminium smelter, producing in excess of 570,000 tonnes of
quality aluminium per year and contributing $1.4 billion annually to Australia’s Gross
Domestic Product (Boyne Smelter Limited, u.d.),
Orica was constructed in 1990 as a Chlorine and Sodium Cyanide manufacturing complex
and supplies critical products to the mining, infrastructure, agriculture and water supply
sectors. The plant produces 95,000 tonnes per annum (TPA) of Sodium cyanide and more
than 500,000 TPA of Ammonium Nitrate (Orica, 2015).
Rio Tinto (Yarwun 1) an alumina refinery, commenced construction in 2002 and was the first
greenfield refinery to be built in the western world in 20 years (Rio Tinto, u.d.). Yarwun Stage
2 occurred in 2007 – 2008 and doubled production to 3.4 million tonnes of alumina per year
(Rio Tinto, u.d.).
Whilst these major projects were significant, the impacts from the influx of people was not
quite as significant as the construction of Queensland Aluminium Limited in 1967. The
Yarwun Stage 2 project was closely followed by the Global Financial Crisis (GFC) in 2008 -
2009 which temporarily eased some of the pressure on housing markets in Gladstone.
However this quickly changed with the approval of three Liquefied Natural Gas (LNG) plants
on Curtis Island which occurred in 2010. This massive industry development resulted in the
rental vacancy rate in the Gladstone urban area dropping to approximately 0.8%, indicating
tight availability (Akbar, D. Rolfe, J. Kabir, SM., 2013).
Supply vs demand
Deciphering the real estate market when there is a false market and false demand is difficult
to manage. In Gladstone's instance, the demand created by the LNG construction was not
real, but was driven by investment spruikers from outside the region who were keen to make
a ‘fast buck’. In Gladstone's perspective, the demand was instant and even though there
was a land bank, the time taken to lodge applications, gain approval, construct and bring the
product to market took years, missing the peak demand period. This time lag alone was
almost three years in some instances which, was well after the demand first started.
The LNG boom was different to other major projects within the region as previously, large
scale projects in Gladstone have proceeded from construction to operational stage in a
curve type transition, with employees and sub-contractors migrating to the next large scale
project. This transition smooths out the peaks and troughs for the industries sourcing
employees, sub-contractors and tradespeople. The LNG boom which occurred in 2011 -
2013 was unprecedented with the approval of all three projects, resulting in a massive spike
in demand for services and skills as well as competition between each of the LNG projects to
complete particular milestones.
Page | 4To give some perspective of the spike in demand vs supply, the median Dwelling House
price in Gladstone peaked at $434,500 in the third quarter of 2012 and dropped to $290,000
in the first quarter of 2017. The Unit median price dropped from a peak of $427,500 in the 4th
quarter of 2013 to a low of $245,000 in the last quarter of 2015. Unit sales fluctuated from
2015 to 2017 and are currently sitting at $265,000 in the first quarter of 2017 (Ray White
Gladstone, 2017). Vacant residential land fluctuated from $221,000 in the third quarter of
2013 to a current low of $138,000 in the first quarter of 2017 as illustrated below (Ray White
Gladstone, 2017).
500000 Gladstone Regional (LGA) House, Unit and Vacant Land Value
450000 September 2013 to March 2017
400000
350000
300000
250000 House
200000 Unit
Vacant Land
150000
100000
50000
0
Q3/2013
Q4/2013
Q1/2014
Q2/2014
Q3/2014
Q4/2014
Q1/2015
Q2/2015
Q3/2015
Q4/2015
Q1/2016
Q2/2016
Q3/2016
Q4/2016
Q1/2017
Source: Ray White
Figure 1 - Gladstone Region (LGA) House, Unit and Vacant Land Value
The housing crisis issues in Gladstone also prompted the provision of affordable housing in
the region by the Urban Land Development Authority (ULDA) now known as Economic
Development Queensland (EDQ). The introduction of ULDA was significant as it represented
the first time that Queensland planning saw the introduction of planning-related legislation
that could require the provision of affordable housing on extremely small lots in a resourced
based city (Greenhalgh and Bosman, 2016). Economic Development Queensland (EDQ)
developed Hillclose Estate in Clinton and Tannum Blue Estate in Tannum Sands in the
Gladstone region which comprised a total of more than 400 lots for each development.
Construction of these sites has only been partially completed with sales now occurring for
Stage 5 and 6 of Hillclose Estate, and Stages 1 and 1A currently at Tannum Sands
indicating a reduction in sales.
Calm before the storm
Just prior to the commencement of the most recent boom, the Council amalgamation had
been in place for less than two years, there were four Planning Schemes in place (including
one superseded Planning Scheme) and only a few Planning Officers. Each of the previous
Council regions were approving developments to stimulate growth within their respective
Local Government areas rather than considering development as a region wide outlook as is
Page | 5currently occurring with the Gladstone Regional Council. As a result, substantial
developments were approved on the periphery of the city. Residential developments
included Riverstone Rise Estate (Boyne Island), which had been lodged but not decided and
located on land that was zoned Urban Expansion and mainly Rural. The Sands Estate
(Tannum Sands) which had been approved in 2006 but not yet constructed was located
entirely on land that was zoned Urban Expansion. Several satellite residential estates along
Kirkwood Road (Gladstone) were also approved including Glen Eden development,
Brookview, Stockwood, Marist Fathers development, Forest Springs, Little Creek, Vantage
and Oasis Estates.
Although these estates were on the periphery of the city and would not meet the overall
outcomes under the current Planning Scheme with regard to zoning, and location, there was
a considerable land bank that at the commencement of the boom put the Gladstone Region
in a good position for land availability, particularly since construction in most cases had been
deferred as a result of the GFC and a reduction in demand (Bird, 1991, p22). The ability to
manage the gap between theoretical demand and real demand however was severely tested
in the following years.
Living in tents
The quote: ‘take nothing but memories leave nothing but footprints’ could describe the pre
and post development boom in Gladstone (Chief Seattle, 1854). Critical housing issues
emerged as a result of the influx of people prior to and during the construction stage of the
LNG plants, with the result mirror imaging the housing crisis in 1967, only on a larger scale.
People were living in tents, bedrooms were being rented out by the week and every type of
accommodation option was filled to capacity. Some motels 'hot bedded' to alleviate the
crisis. Existing rental contracts were reduced to three month agreements with the rent rising
on renewal of contract, often resulting in the long term tenants leaving the region to seek
cheaper rent. Land sales in some instances increased by $50,000 overnight for a single
block of Residential zoned land.
Whilst there were Development Permits in place that in reality, should have shortened the
long lead times for the provision of housing options (vacant lots and units), the skilled
workforce to construct these developments had to be sourced outside of the Gladstone
Region. Local civil works construction companies, electricians, builders and painters were all
working on Curtis Island. This increased influx of people further compounded the housing
issues. Demand for accommodation was instant, there was no lead in time.
The city was bustling 24/7 and the pace quickened, as out of town developers and
construction crews arrived to 'make a quick buck' with the focus on filling the void and
alleviating the critical housing issues. As a result the 'knock it up quick' solution became
apparent in most developments. Cheap and quick options for building products were utilised
such as waffle pod slabs, with houses constructed in 6 to 8 weeks. Works proceeded from
slab to start of construction in two days. Reconfiguration works that usually took up to six
months were now taking three months due to the pressure for quick construction. Failure
rates on construction infrastructure were high.
Building Permits for the construction of units/year peaked in 2012 with 28/year approved
developments commencing construction whilst applications for Dual Occupancies peaked at
31/year in both 2013 and 2014, well after the peak demand in 2010 / 2011 had passed. A
graph illustrating the Building Applications lodged for Unit developments (per development)
and Dual Occupancies (per development) is illustrated below with the LNG announcement
highlighted at 2010.
Page | 635
Building Applications 2009 - 2017
31 31
30 28 28
25 24
21 21
20 18
Units
15 14
Duplex
10 9
5 5
5 3
2 2
1
0 0
0
2009 2010 2011 2012 2013 2014 2015 2016 2017
Figure 2 – Building Applications Lodged for Unit and Dual Occupancies (per DA)
Lodgement of Building Applications for Dwelling Houses peaked in 2011, 2012 and 2013
with 2,771 applications for Dwelling Houses (annual average of 924) lodged over the three
year period compared with 627 Dwelling House applications in 2010 and 340 Dwelling
House applications in 2014.
Figure 3 – Building Applications Lodged for Dwelling Houses (per DA)
Competition among developers for a few areas of appropriately zoned land forced raw land
prices up to unaffordable levels and therefore, applications for reconfigurations were lodged
over sites that were on the periphery of the city, in some cases on land that was zoned rural.
These developments would ultimately require the provision of significant infrastructure and
therefore, the limitations on construction capacity slowed construction and increased costs
(Bird, 1991 p23). The location of these developments were also fragmented and contributed
Page | 7to urban sprawl. Whilst Council was not supportive of these ‘out of sync’ developments,
appeals were lodged in the Planning and Environment Court and were overturned because
the Planning Scheme did not support Council’s recognised obligation by the community to
regulate sustainable development and economic viability.
Economists and Real Estate professionals have commented that should the gap between
product availability and demand become too great, it will take a greater period of time to
restore the balance between supply and demand (Bird, 1991). Gladstone is currently in this
position given that it has been two years since the decampment of LNG workforce.
The housing crisis somewhat abated when Workers Accommodation was provided on Curtis
Island. These camps sprung up almost overnight with the provision of ‘dongers’ which could
be removed after the projects had gone from construction to operation stage. This temporary
fix which somewhat alleviated the impacts of the housing, left no infrastructure when
decommissioned and therefore no benefit for future sustained development or reuse. For
example, if the construction of short term accommodation had been provided in the form of
units and apartment high rise buildings, the permanency of these structures would support
the new tourism business that is currently being promoted, or in the case of workers
accommodation, sites being reused as caravan or RV parks, depending on the location.
Social issues from fly in fly out employees often impact on the community as was the case in
Gladstone. The benefits vs impacts of this accommodation preference would need to be
researched and considered.
Gladstone city is small compared to other regional cites in Queensland and whilst managing
impacts from a large influx of residents may not impact as fiercely on cities with larger
populations, Gladstone was blindsided by the full impact.
Where are our Tenants
Everyone wanted a piece of the action and once the housing crisis abated and the
construction of the LNG slowly progressed to operational stage, the competition waned and
the city began to return to post boom. Those businesses that had up scaled to meet demand
were now down scaling or in some instances closing, as victims of drastic economic change.
Mortgagee repossessions (until recently) were still occurring and retail shops had shut their
doors.
There is now an oversupply of units and a large ‘land bank’ of approved reconfigurations
where Stage 1 has been signed and sealed to ensure that the reconfiguration approval does
not lapse. New reconfigurations are turned out in smaller stages without committing
significantly more funds (Bird, 1991). The ‘roll forward provisions’ were also utilised by
developers where possible however these provisions are not included within the new
Planning Act 2016. These factors will have a considerable impact on land supply projections
(Bird, 1991).
For other approvals, requests for extensions to the Relevant Period for Material Change of
Use applications is now occurring. The decision to extend will depend entirely on whether
the sites, under the current Gladstone Regional Council Planning Scheme comply with
regard to zoning, location and need.
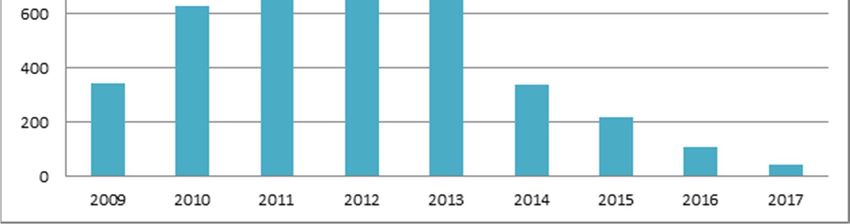
During the 1st quarter of 2012 in the peak demand period, there were 679 building searches
(i.e. potential purchases of the property) undertaken compared to 227 undertaken in the first
quarter of 2017, a total of 2,487 searches in total were undertaken in 2012 as illustrated
below.
Page | 8MONTH 2008 2009 2010 2011 2012 2013 2014 2015 2016 2017
Jan 47 165 187 198 170 103 84 61 102
Feb 69 165 213 221 175 118 98 84 97
Mar 80 184 289 260 141 137 104 73 28
Apr 72 140 188 161 163 86 90 58
May 55 223 222 216 189 102 106 86
Jun 83 181 225 208 142 107 120 91
Jul 63 151 170 242 227 146 150 114 75
Aug 52 164 175 336 230 140 98 108 83
Sep 55 167 154 302 176 126 125 94 91
Oct 75 174 157 266 207 168 121 90 89
Nov 59 219 265 265 222 241 125 88 161
Dec 67 131 301 232 161 131 100 77 93
TOTAL 371 1412 2280 2967 2487 1932 1372 1173 1045 227
Figure 4 – Property Searches Undertaken Between the 3 Quarter of 2008 and 1st
rd
Quarter of 2017
A search of property transfers undertaken during the peak period of 2010 to 2014
highlighted that more than 68% of the property sales were from outside of the Gladstone
region (postcode of 4680) signalling rental properties purchases rather than for residential
purposes by the owner.
Number of Property Transfers by State
1 January 2010 to 31 December 2014
12000 11214
10000
8000
6784
6000
4000
2000 1435
862 703
202 283 35
0
NT NSW Vic Qld other QLd 4680 SA WA Tas
Figure 5 – Property Transfers by State/Region
In the 2nd quarter of 2017, the Gladstone property market experienced the biggest fall in
median house prices in the State which has resulted in an 11.6% drop to the annual median
sale price of $270,000 and a March 2017 quarterly median sale price of $260,000 which
makes Gladstone the second most affordable market amongst the local government areas
Page | 9analysed in the Queensland Market Monitor (Real Estate Institute Queensland, u.d.). This
affordable market may give rise to a more stable growth period in the region in the future.
Lessons learnt
During the year 2012, 76 planning applications were lodged and approved for Units and
Duplex Units. There was a lot of feedback from existing operators that the new approvals
were flooding the market and undermining their economic viability and the long term function
of the region. This may have been the case, however if a Development Application for Units
met the requirements of the Planning Scheme, then the application was approved. The
graph below illustrates the number of planning applications lodged after the LNG
announcement.
60
Planning Applications 2009 - 2017
49
50
45
40
30 27 Units
Duplex
20 17 16 16 15
10 10
10 8 7
5
0 1 0 0 1 0
0
2009 2010 2011 2012 2013 2014 2015 2016 2017
Figure 6 - Planning Applications Lodged - Units and Duplex Units 2009 to 2011
The main objective when developing the current Planning Scheme was to better manage the
situation so that the economic viability of the city would not be in the same position should a
boom happen again. The challenge of trying to manage fluctuating economic and social
demands is enormous and had not yet been tried and tested. Firstly, zoning and location of
existing development and whether approvals were likely to be constructed was considered.
Then opportunities for development were investigated and the likelihood of the development
of additional sites, taking into consideration the usual suspects of flooding, steep land,
coastal impacts and the ability of the site to be serviced with infrastructure. Development of
the current Planning Scheme entailed serious consideration on how the amalgamated
Council could deliver one vision for the region. Consideration was also given to incorporating
the existing and partially developed large scale developments of the three previous Local
Government regions into the urban footprint whilst managing economic peaks and troughs
was a challenge.
The key items considered when drafting the Planning Scheme was to manage the impacts of
rapid population growth and the phases when growth plateaus, but in particular, the ability to
refuse applications for out of sync master planned communities. The current Planning
Scheme has been developed with a 'Top Down' approach, if the proposed development
does not meet the Strategic Framework than the development will not be supported. If an
application for a Material Change of Use or Reconfiguration of a Lot is lodged on land that is
Page | 10zoned Emerging Communities, then the applicant must lodge a Community and Economic
Needs Assessment. This assessment is to be provided when the demand for the desired
development outcome may not be known or exist at the time of lodgement. The needs
analysis provides Council with the documentation to determine whether sufficient grounds
exist to support the development application, but only where the proposal is inconsistent with
the Strategic Framework.
The current Planning Scheme in this instance is attempting to protect the economic viability
and long term function of existing and future centres as well as to ensure that residential
development occurs in step with community need (Gladstone Regional Council, 2015).
Impacts that are to be addressed in the assessment includes whether the proposed
development may negatively impact on an existing centre to the point where it may become
economically unsustainable, or whether it will enhance the viability of an existing centre. The
assessment must also consider whether the proposal may create unnecessary community
and economic hardship or alleviate existing or emerging issues, and whether the proposal
may result in adverse market conditions due to the scale of the proposed development.
Whilst the current Planning Scheme has been designed to manage economic viability in the
region during ‘boom’ situations, the Planning Scheme is yet to be tested through the
assessment and refusal of an application that is out of sync, through the Planning and
Environment Court.The new Planning Act 2016 acknowledges that bringing a product to
market can be problematic and prolonged and focuses on streamlining of the development
processes and reducing holding costs to allow a quick response to demand (Greenhalgh and
Bosman, 2016). This new Act in conjunction with the current Planning Scheme is hoped to
achieve the strategic framework objectives to manage economic viability and the long term
function of the city.
In attempting to manage supply however, is it more prudent to provide temporary workers
accommodation rather than on ground stock, with the remaining infrastructure preserved for
other suitable uses? This scenario has also been implemented within the current Planning
Scheme to further manage supply vs demand scenarios by ensuring that any future workers
accommodation is provided within the city rather than in rural locations. Managing need
when there are so many factors involved is a difficult task.
Rising from the gas flumes
More recently, the dynamics of the Central Business District (CBD) is changing, there are
retail shops opening and the cafes and restaurants are readjusting their opening hours and
diversifying to suit the new market. The current Planning Scheme promotes development
within the CBD as being accepted development if utilising an existing building. This provides
the opportunity to start a new business, or relocate an existing business into the CBD. To
further support this relaxation, the reduction of ‘red tape’ and the exemption to pay permit
fees for on street dining, busking and the display of goods for sale on a footpath was
implemented in December 2016. The Gladstone Regional Council also developed an urban
renewal strategy to ‘Jump Start the City Heart’ that is incorporated into the current Planning
Scheme. The initiative guides future development and new social, economic and
environmental opportunities to reinvigorate the city centre. It is about re-establishing
Goondoon Street as Gladstone’s main street by creating a unique identity and a sense of
arrival, and by converting grey space to green space and improving connectivity with East
Shores.
The forerunner to the urban renewal strategy was the ‘Streetscape Project’. This project was
approved in 2016 and reflects the community’s concept and design ideas to provide extra
seating, vegetation and garden beds along Goondoon Street within the CBD. Another key to
enabling the above initiatives was the 7 Day Makeover Challenge which was run by the
Page | 11community and assisted by volunteers. This challenge inspired residents to transform tired
public spaces into vibrant community nerve centres on a shoestring budget, and gave the
participants the skills and the direction to continue the valuable transformation process to
encourage people to linger longer.
Whilst it is only early days, these three projects have mobilised the community, kick started
adaption strategies and highlighted how resilient the Gladstone community is following
adversity. The expansion of tourism opportunities through the cruise industry which
commenced in March 2016 is focused on encouraging tourists to return and stay a while.
The $17M proposed construction of the Cruise Ship Terminal at East Shores, which forms
part of the Stage 2 of the Gladstone Port Authority development, will assist in fostering these
adaption strategies within the CBD (Real Estate Institute Queensland, u.d.).
Conclusion
Although major projects have tested the resilience of the Gladstone community over several
decades, the astronomical growth which occurred between 2011 and 2013 as a result of the
Liquified Natural Gas boom severely impacted on the region. In six years, Gladstone has
been bursting at the seams to the extremes, with residents living in tents due to a housing
shortage to no tenants with rental rates, housing stock and developed land dropping to
unprecedented lows.
Gladstone city however is resilient and operates differently to other regions. Managing
impacts of rapid population growth followed by more stable phases and the radically
changing housing market from shortage to saturation is something that needed to be
addressed. Ensuring the viability of the region and retention of residents is important,
particularly since Gladstone first experienced this situation in 1967. The region may well
experience the same situation again.
The reasoning behind Council’s decision to prepare a Planning Scheme that attempts to
retrospectively manage community need for product was highlighted, along with adaption
strategies currently occurring in the CBD. This Planning Scheme will be tested over the
coming years, particularly by ensuring that residential development occurs in step with
community need whilst managing fragmentation and promoting infill development. This
framework was proposed to ensure that the economic viability of both the community and
the developers is protected and to promote resilience and rejuvenation following adversity,
now it is a wait and see situation.
Page | 12Bibliography
Akbar, D. Rolfe, J. Kabir, SM., (2013), Predicting impacts of major projects on housing prices
in resource based towns with a case study application to Gladstone, Australia. Resources
Policy, 38, pp 481 - 489.
Barker, T. (1981), Multinational Gladstone: developers' feast, social famine, Royal Australian
Planning Institute Journal, 19:3 p102-104.
Bird, N. (1991), A Developer's Perspective on Supply of Residential Land, 29:1, p22-23.
Boyne Smelter Limited, (u.d.), retrieved from http://www.boynesmelters.com.au/8/History
Cement Australia, (u.d.), retrieved from
http://www.cementaustralia.com.au/wps/wcm/connect/website/cement/home/local-
communities/gladstone/
Chief Seattle, (1854), retrieved from http://www.halcyon.com/arborhts/chiefsea.html
Financial Crisis Inquiry Commission, United States of America. (2011). The Financial Crisis
Inquiry Report. Retrieved from https://fcic.law.stanford.edu/report
Gladstone Ports Corporation (2013), retrieved from http://www.gpcl.com.au/home
Gladstone Regional Council, (2015), Gladstone Regional Council Planning Scheme,
retrieved from http://www.grcplanningscheme.com.au/
Greenhalgh, E. and Bosman, C. (2016), Planning for the supply of more affordable housing:
the case of the Queensland Urban Land Development Authority, Australian Planner, 53:3,
p211-220
Gladstone Area Water Board, (u.d.), retrieved from http://esvc000457.wic040u.server-
web.com/texttimeline.html
Gladstone Power Station, (2008), retrieved from
http://www.nrggos.com.au/page/About_Us/History/
Orica, (2015) retrieved from http://www.orica.com/News---Media/orica-yarwun-celebrates-25-
years-of-production#.WVItx2iGPIU
Ray White Gladstone, (2017), Region Comparison Charts, Property Data Solutions Pty Ltd
2017
Real Estate Institute Queensland, (u.d.), Research, Queensland Market Monitor, retrieved
from https://www.reiq.com/REIQ/Research/Research_Queensland_Market_Monitor.aspx
Page | 13You can also read