FUCHS GROUP Capital Market Day 2019 - | June 25, 2019
←
→
Page content transcription
If your browser does not render page correctly, please read the page content below
FUCHS GROUP
Capital Market Day 2019

| June 25, 2019
Disclaimer

The information contained in this presentation is for background purposes only and is subject to amendment, revision and updating. Certain
statements and information contained in this presentation may relate to future expectations and other forward-looking statements that are
based on management’s current views and assumptions and involve known and unknown risks and uncertainties. In addition to statements
which are forward-looking by reason of context, including without limitation, statements referring to risk limitations, operational profitability,
financial strength, performance targets, profitable growth opportunities, and risk adequate pricing, other words such as “may, will, should,
expects, plans, intends, anticipates, believes, estimates, predicts, or continue”, “potential, future, or further”, and similar expressions identify
forward-looking statements.
By their very nature, forward-looking statements involve a number of risks, uncertainties and assumptions which could cause actual results
or events to differ materially from those expressed or implied by the forward-looking statements. These factors can include, among other
factors, changes in the overall economic climate, procurement prices, changes to exchange rates and interest rates, and changes in the
lubricants industry. FUCHS PETROLUB SE provides no guarantee that future developments and the results actually achieved in the future
will match the assumptions and estimates set out in this presentation and assumes no liability for such. Statements contained in this
presentation regarding past trends or activities should not be taken as a representation that such trends or activities will continue in the
future.
The company does not undertake any obligation to update or revise any statements contained in this presentation, whether as a result of
new information, future events or otherwise. In particular, you should not place undue reliance on forward-looking statements, which speak
only as of the date of this presentation.

l2
FUCHS2025
An Exciting Journey

| June 25, 2019
| Stefan Fuchs, CEO
FUCHS2025 Journey
Why?
We reached a size of 2.5 bn EUR with a complex organization
but we are missing some global standards.
To continue being successful means:
We will maintain the successful elements of the FUCHS DNA.
To a certain extent, we have to leave our comfort zone to explore new opportunities.
We aim to become more agile, communicate free of hierarchies, have an open feedback culture
and share more information.
l4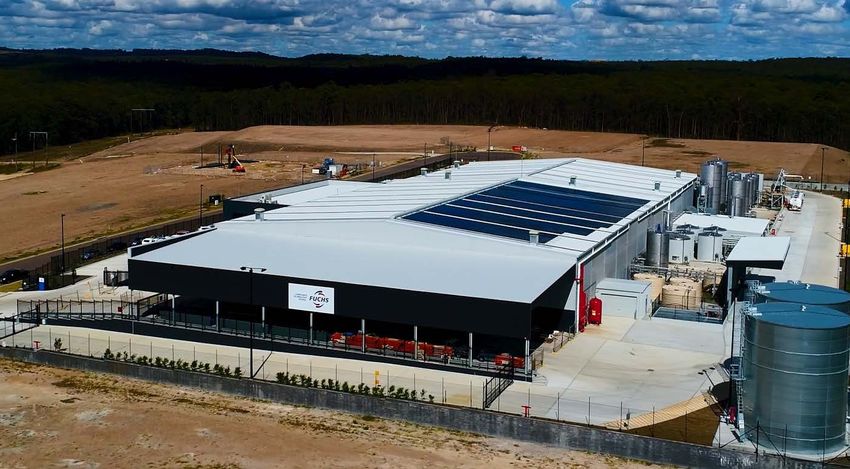
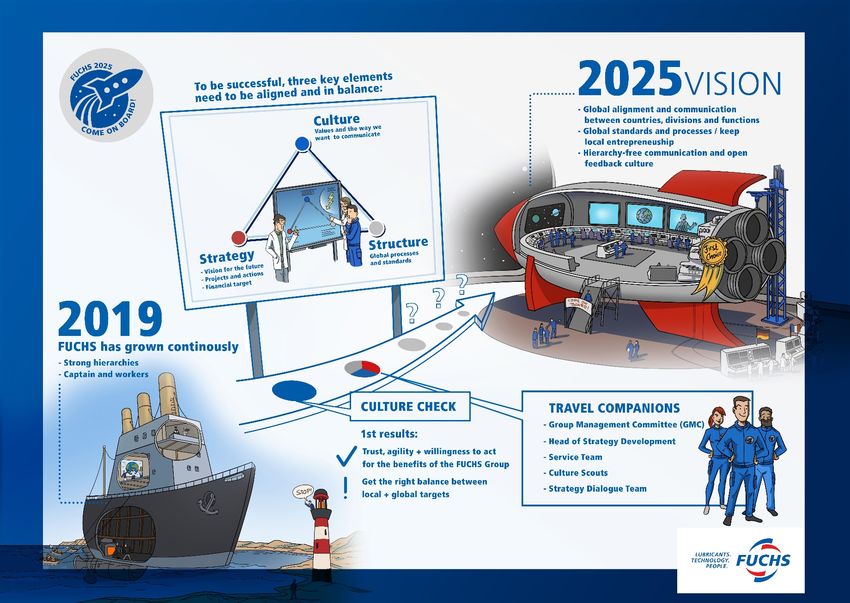
Three Key Elements

             CULTURE needs strong

             − Leadership – put words into action!
             − Compelling change story
             − Collaboration

     2018                ACT GLOBAL!                                  2025
             STRATEGY needs a clear           STRUCTURE needs robust
             − Vision                         − Standard processes
             − FUCHS2025 roadmap              − IT & SC integration
             − Local implementation           − Global organization

l5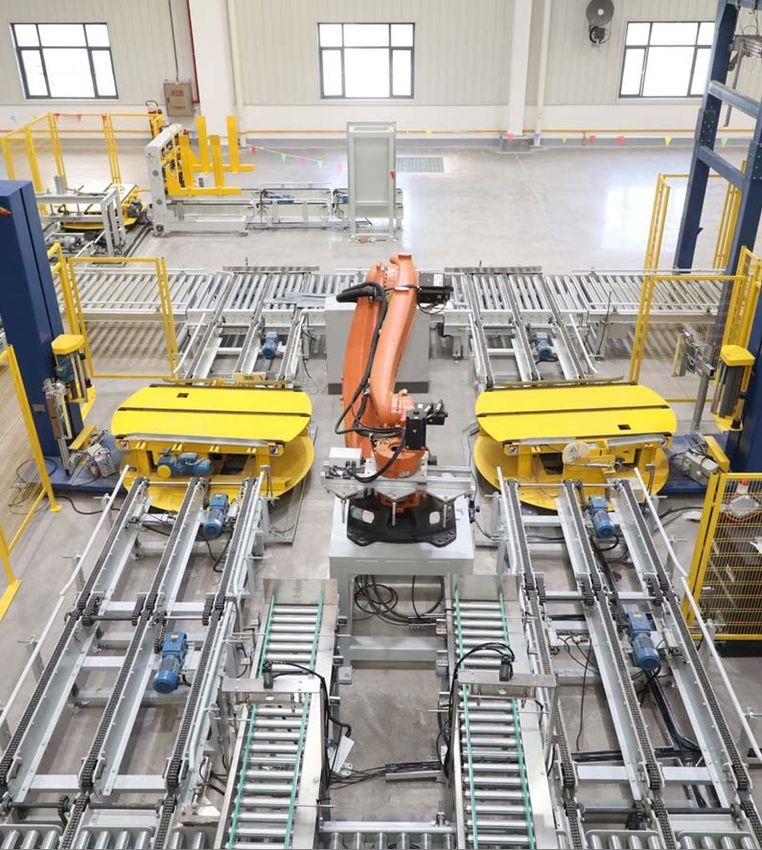
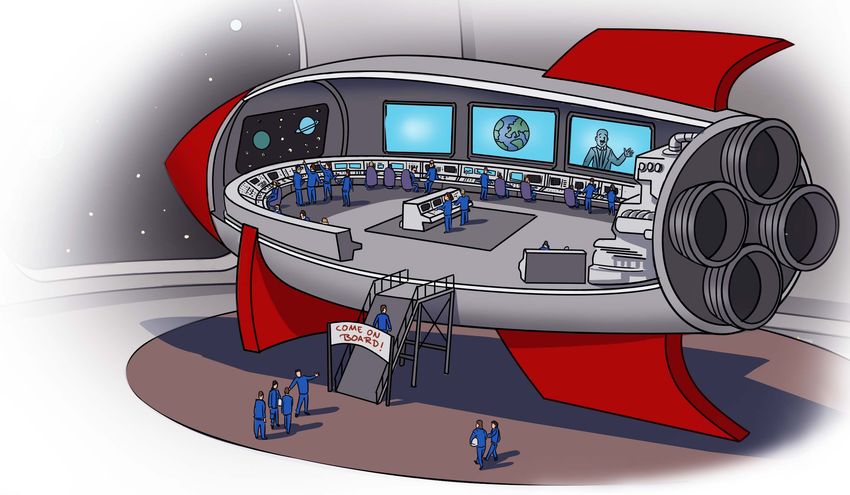
FUCHS2025 – Poster #1
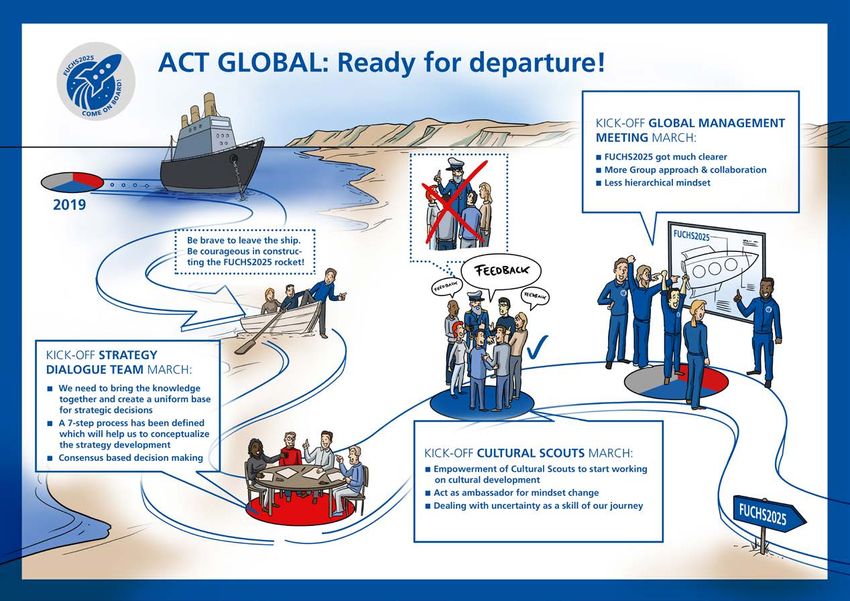
FUCHS2025 – Poster #2
FUCHS2025 – Vision

l8
FUCHS GROUP
Investment Initiative

| June 25, 2019
| Dagmar Steinert, CFO
Growth initiative

                                                             Global IT
                                                             processes
                                                 € 700+ mn
                                                 capex
                         € 50+ mn R&D            2016-2021
                         expenses p.a.
       5,500             x2 during the last 10
                         years
       employees
       +50% during the
       last 10 years
l 10
Investment initiative
Regional breakdown
20% 20%
2016 - 2018 2019 - 2021
~ €320 mn 55% > €400 mn 55%
25% 25%
Europe Asia-Pacific, Africa Americas EMEA Asia-Pacific Americas
l 11Investment initiative
Larger projects overview 2016 - 2018
Europe Asia-Pacific, Africa
Mannheim production expansion China new plant in Wujiang
test field Australia new plant in Beresfield,
land acquisition Newcastle
Kaiserslautern production expansion South Africa grease plant
office space
high rack warehouse
UK production expansion Americas
office space
Poland storage USA 3C Greases Plant Chicago
production expansion Chicago production expansion
and modernization
Sweden start of construction of new plant Kansas City plant upgrade
Huntington plant upgrade
l 12Investment initiative Australia: Beresfield (Newcastle) - New plant (2018) l 13
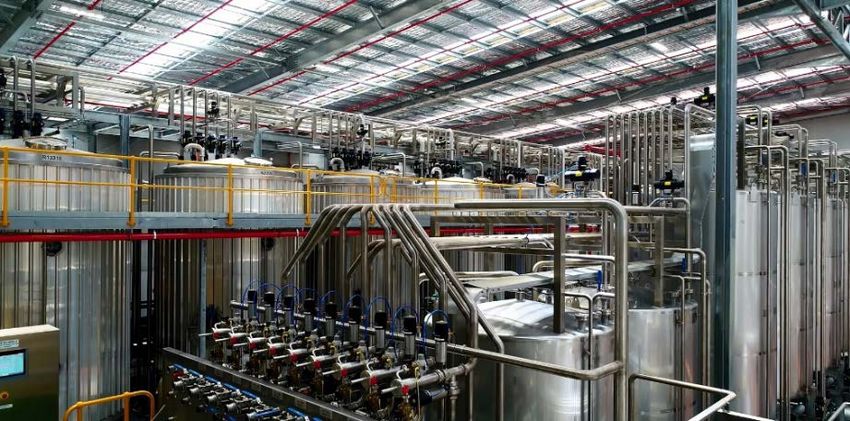
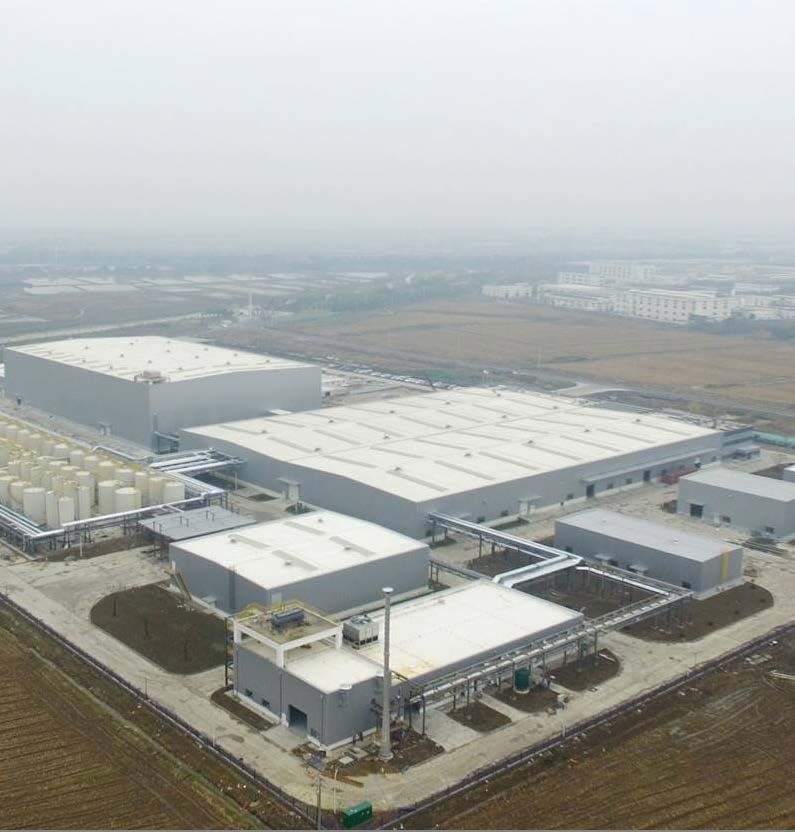
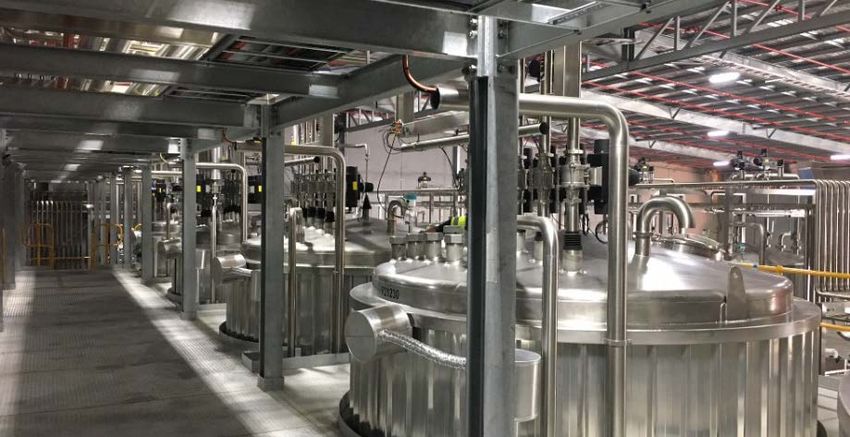
Investment initiative
China: WuJiang (Shanghai) - New plant (2019)

l 14
Investment initiative
Larger projects overview 2019 - 2021

                      EMEA                                    Asia-Pacific

 Mannheim          production expansion          China       Shanghai office building,
                   new office building holding               Yingkou grease production
                   high rack warehouse                       expansion
 Kiel              production expansion                      Yingkou 3C grease plant
                   warehouse                     Australia   Melbourne plant expansion
 Kaiserslautern    PU grease plant               India       production expansion
 Sweden            new plant
 Russia            production expansion
                                                               Americas
 UK                raw material warehouse
 Poland            grease production expansion   USA         Chicago prod. upgrade & expansion
                                                             Kansas City upgrade,
                                                             Huntington plant upgrade

l 15
Investment initiative
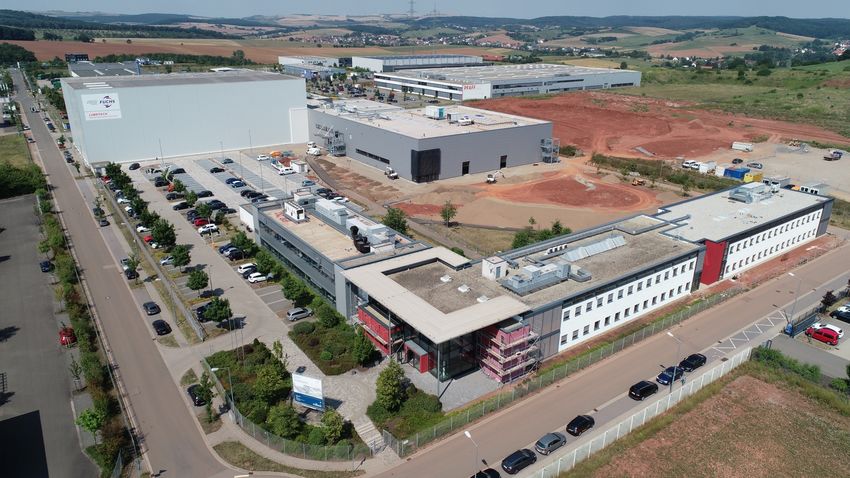
Germany: Mannheim (2019 - 2021)
FUCHS PETROLUB SE
Office building
FUCHS SCHMIERSTOFFE GMBH
High rack warehouse for raw
materials
l 16Investment initiative Germany: Kaiserslautern - Plant expansion (2019) l 17
Investment initiative
      Capex 2016-2021 €700+ mn

€ mn 200

    150

    100

     50

                                                                                                             Estimated level of depreciation (excl. PPA)

      0
             2008   2009   2010   2011   2012   2013       2014     2015       2016         2017   2018    2019        2020         2021          2022
                                                       Capex      Scheduled depreciation*

                             In 2022 maintenance capex amounting to the level of depreciation
      l 18                                                                                                * Depreciation figures excluding PPA from M&A
Development amortisation PPA*
€ mn 20
15
10
5
0
2015 2016 2017 2018 2019 2020 2021 2022 2023 2024 2025 2026 2027
PPA
l 19 * Figures not considering potential additional M&AInvestment Initiative Financial Highlights € mn 2015 2016 2017 2018 2019 Sales 2,079 2,267 2,473 2,567 EBIT 342 371 373 383 CAPEX 50 93 105 121 Capex in % of sales 2.4 % 4.1 % 4.2 % 4.7 % D&A (w/o PPA) 34 37 42 47 D&A (w/o PPA) in % of sales 1.6 % 1.6 % 1.7 % 1.8 % R&D 39 44 47 52 R&D in % of sales 1.9 % 1.9 % 1.9 % 2.0 % Personell expenses 259 279 290 302 Average number of employees 4,368 4,990 5,147 5,339 l 20
Outlook 2019

2018      Q1                 Q2         Q3                    Q4
                                                                   FY 2018:
EBIT      92                 101      104 (92)                86
                                                                   Sales: 2,567
                                                                   EBIT: 383

                 Strong H1                   Weakness in Q4

2019       Q1                 Q2                  H2
                                                                   FY 2019 Guidance:
EBIT       77              < Q2 /18
                                                                   Sales: +2% to +4%
                                                                          2,618 - 2,670

                                         Expected recovery to      EBIT:   -8% to -5%
                 Weak H1
                                       compensate for weak H1              352 - 364
  l 21
You can also read