INVESTORS PRESENTATION - July 2019

Page created by Debbie Juarez
 
CONTINUE READING
INVESTORS PRESENTATION - July 2019
INVESTORS PRESENTATION
       July 2019
INVESTORS PRESENTATION - July 2019
The presentation is dated the day it is given. The delivery of this presentation shall not,
under any circumstances, create any implication that there has been no change in the
affairs of the Company since such date. The third party information and statistical data in
this presentation have been obtained from sources the Company believes to be reliable
but in no way are warranted by the Company as to accuracy or completeness. This
presentation may not contain all material information concerning the Company and the
information set forth in this material is subject to change without notice.

These materials included herein that are not historical facts are forward-looking
statements. Such forward looking statements involve a number of risks and uncertainties
and are subject to change at any time. In the event such risks or uncertainties materialize,
AAV’s results could be materially affected. The risks and uncertainties include, but are not
limited to, risks associated with the inherent uncertainty of airline travel, seasonality
issues, volatile jet fuel prices, world terrorism, perceived safe destination for travel,
Government regulation changes and approval, including but not limited to the expected
landing rights into new destinations.

This presentation is strictly not to be distributed without the explicit consent of Company’s
management under any circumstances.

                                                                                                1
INVESTORS PRESENTATION - July 2019
Others
          US 4%    5%

                            E.Asia 65%
   S.Asia 5%                                  EXPECTED OVER 40 MILLION VISITORS IN 2019 OR 5% YOY
                                               1H19 International Tourists Achieved 20 Million or Up 2% YoY
 EU 21%

                  million                                                                      LCC penetration 1

                                                                                     36% 36%

OVERALL
                                                                                      Europe
 Visitors will grow by 7% to 20 mil in 2H19                  31% 30%
                                                                                                                   55%
                                                                                                                           52% 52%
                                                                                                               51%                        49%
CHINA                                                                                                                                  48%
                                                           North America
 Edged down 3% YoY and 29% contribution

ASEAN
                                                                                                              South Asia   Thailand    SE Asia
 Grew 6% YoY and 23% contribution
EUROPE
Edged down 2% YoY and 21% contribution
SOUTH ASIA                                                                                                             2018     2019
Rocketed 23% YoY and 5% contribution
                                                                           1 source: CAPA                                                        2
INVESTORS PRESENTATION - July 2019
1

            Countries 1
                            1

                                    1

Note: 1 As of 30 May 2019
INVESTORS PRESENTATION - July 2019
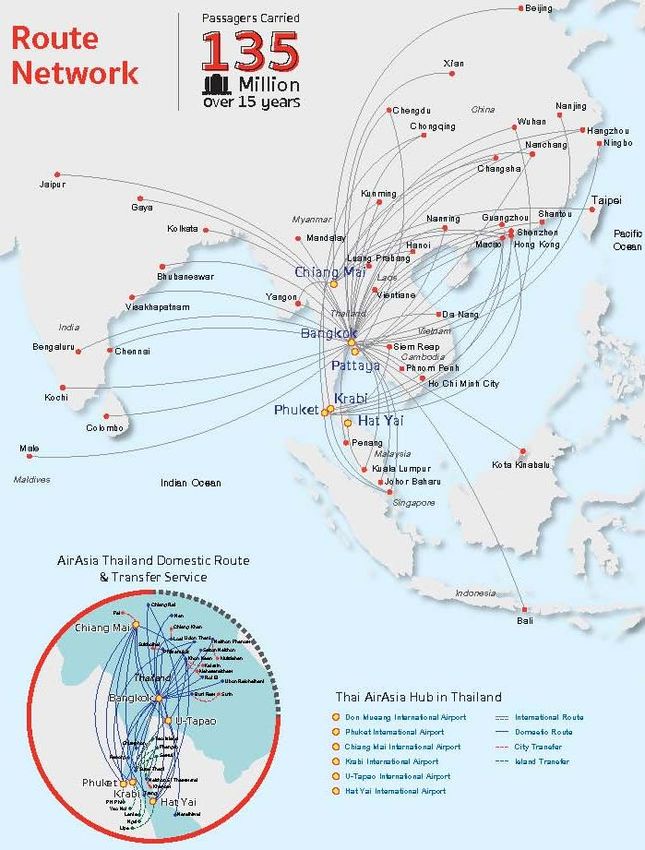
► Passengers grew by % in line with capacity growth.
► TAA unveiled its Seventh-flight hub in Chiang Rai
► ASK rose by        as launching 4 new routes.
                                                                                    2.4 mil (+14%)
► Average fare was at Baht         per pax, down by 7%, resulted
  from the sluggish recovery of tourism.
                                                                    3.5 mil (-2%)
► Ancillary revenues were Baht         million up 9% or
  Baht       per pax up 5% YoY, while dynamic pricing and
  value pack enhanced seat selection and inflight revenues.
► CASK was       Baht unchanged YoY, while CASK ex-fuel was
      Baht, inched up 1%.
► Core Revenues were             MB with       EBITDAR Margin.
► TAA & AAV reported Net profit of Baht           million and
  Baht       million, respectively.
► Net gearing at        with a cash balance at Baht       Billion

                                                                                                     4
INVESTORS PRESENTATION - July 2019
Q1/2019 achieved 2,060 mb (+9%YoY) or Bt 351 per pax (+5% YoY)

                                           • Fee structure adjustment; 1Q19 rocketed by 34% YoY
                                           • Fly-Thru lounge access

                                           • 1Q19 rocketed by 41% due to an increase in AirAsia
                                             Group flights, reflected 26% growth in traffics
                                           • Fly-Thru pax was at 6% of total pax

                                           • 1Q19 up by 24% YoY
                                           • Emphasis on dynamic pricing and Value Pack,
                                             Government and Premium Flex with travel protection

                                           • 1Q19 up by 2% YoY
                                           • Continue promoting pre-book In-flight combo set
                                           • Enhance house-brand on F&B

                                           • 1Q19 up by 2% YoY, relating to international
                                             passenger growth
                                                                                                  5
MARKET
SHARE1 BY
   PAX
 FLOWN

            6
7
1Q19                                             CEI – Macao

                                                 CEI – Kuala Lumpur*

                                                 CEI – Singapore
                                                 CEI – Phuket

2Q19    DMK- Roi Et                              CNX – Danang
                                                 DMK – Nha Trang

                                                 DMK – Can Tho

                                                 CEI – Shenzhen

                                                 CNX – Shenzhen

                                                 DMK – Ahmedabad

                                                 HKT – Phnom Penh

3Q19                                             DMK – Sihanoukville

                                                 HKT – Jakarta

       * Suspended its operation during 2Q2019                         8
•

•

    9
SOUTH
                 ASIA, 10%

           ASEAN ex
           CLMV, 10%

                             DOMESTIC,
                               45%
          CLMV, 15%

CLMV
               CHINA, 20%

  ASEAN

                                         10


                                              
           Jaipur

                                Gaya
                                              
                                    KOLKATA

                              Bhubaneswar
                          Visakhapatnam
                                              

                          CHENNAI             
                    BENGALURU

                Kochi
                                              
                         Colombo
         Male

BOLD : Tier 1

                                                  11
100%   91%
                                                Baht   Fixed

Hedge Position

                                            •
                                            •
                                            •
                                            •

Note: Information as of July 1, 2019
      * Excluding D Factor and Excise Tax                      12
13
•   •

•   •

•

•   •

        14
Impact -> Modified retrospective method
                        ->Processing fee (2% of Revenues) to be recorded on the flown date was 133.5 MB

             Impact -> Recorded 111 MB in 2Q19

             Impact -> Comprehensive income statement

             Impact -> Modified retrospective method
                        -> Increased EBITDA and Debt to Equity Ratio

            Operating Exp.                       -                     Rental Expense                      -
            EBITDA                               -                           -
STATEMENT

            Deprecation Exp.             Depreciation Exp                    -                     Depreciation Exp
INCOME

            Finance Cost             Interest of Finance Lease               -                Interest of Lease Agreement
            EBT                                  -                           -
            Asset                       Right of Use Asset                   -                    Right of Use Asset
  B/S

            Liability                     Lease Liability                    -                      Lease Liability
                                                                                                                            16
   
   

   
   
   
You can also read