FX QUARTERLY: PATIENT REFLATION BUT FEARING CONTAGION - GREG ANDERSON, CFA, PHD - GLOBAL HEAD OF FX STRATEGY STEPHEN GALLO - EUROPEAN HEAD OF FX ...
←
→
Page content transcription
If your browser does not render page correctly, please read the page content below

FX Quarterly: Patient Reflation but Fearing Contagion
Greg Anderson, CFA, PhD – Global Head of FX Strategy
Stephen Gallo – European Head of FX Strategy

                                                       January 18, 2019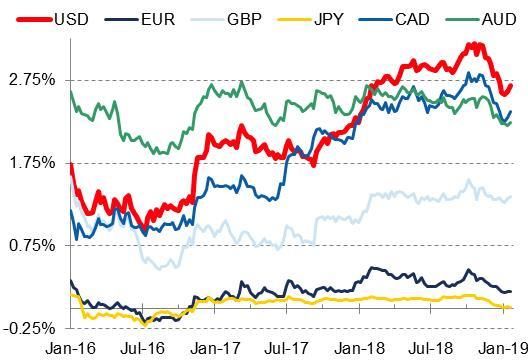
Contents

      Introduction & forecast tables                    3-5

      Global macro factors                              6-11

      FX market conditions                             12-16

      USD factors and outlook                          17-21

      CAD factors and outlook                          22-26

      RMB factors and outlook                          27-30

      FX majors (EUR, GBP, JPY)                        31-36

      G10 next tier (AUD, CHF, NOK, NZD, SEK)          37-42

      Select LM currencies (BRL, INR, MXN, KRW, ZAR)   43-50

      FICC macro strategy contacts                      51

      Disclosures                                      52-53

                                                               2
Introduction: Patient reflation but fearing contagion
The USD gained in 2018 after hitting both corners of its ‘smile’ pattern. Gains in Q2 were due to vigorous growth causing markets to price in
additional Fed rate hikes, while gains in Q4 were due to global risk aversion driving capital out of emerging markets and into USD-denominated cash.
The first half of January has been a partial reversal of December’s risk-off trade due in part to the Fed emphasizing it will be “patient” in raising rates
in 2019. The USD has faded a little on the Fed-induced ‘reflation’ trade, but we wouldn’t trust that move to extend past January. In theory, March
should bring end-games to the US-China trade war cease fire and Brexit. In practice, both deadlines are likely to get pushed, but reflation is still likely
to run out of steam as March approaches. With that in mind, we have the broad USD index rallying by about 0.5% over the next 3 months, even
though our base case scenario is for twin extensions to negotiations.
The outlook for CAD has become highly dependent on one’s oil outlook as that correlation has accelerated. Oil should continue to be a more
important driver than Poloz for the foreseeable future with the Fed and BoC on hold. With as hard as crude fell in Q4, we think that aspect of the
reflation trade may run longer and prove more durable than the tiny slide in the USD index. As a result, CAD should continue to outperform most
other G10 currencies—particularly EUR and GBP. We have a 3M outlook of 1.32 for USDCAD.
The outlook for the EUR is at best shaky. Amidst a fraught political backdrop, a slowing Eurozone economy and less ECB support for Eurozone
credit markets, we expect EURUSD to drift down to 1.12 in 3M. Brexit risks are likely to extend beyond the current March 29th deadline and the EU
faces parliamentary elections in late-May. We anticipate those election results will make governing the Eurozone even more unwieldy, and our
extended EURUSD outlook curve contains a persistent risk discount for this reason.
Parliament is now in full control of Brexit. There is no majority amongst MPs for a “no deal Brexit” and a “plan B” will be very difficult to settle,
so an extension of the Article-50 window leading to multiple permutations is now our baseline scenario. While a Brexit delay is a short-term positive
for the GBP, the risks of a future Brexit cliff edge or snap elections will still impair the currency. As such, our 3M GBPUSD view is 1.25. Under our
baseline scenario, GBPUSD will find it difficult to advance north of 1.30 unless the USD falls sharply.
China has used a range of tools to slow the pace of RMB weakness since early-December. But it would be wrong to confuse recent RMB strength
with an improvement in fundamentals. China tends to park the RMB when domestic or global economic risks are elevated. In the context of a
declining basic balance surplus and the US/China trade impasse, we think PBoC will be satisfied with USDRMB in a 6.80/6.95 range. Our 3M target
for the pair is 6.90. We do not expect an escalation of the trade impasse in the 3M window, but we also don’t expect the more intractable issues to be
rectified either. We therefore think China will leave the option of a further RMB decline on the table.
Other major local market currencies should continue to settle after last year’s steep declines. The bottoming of oil prices in December and a
continued partial recovery over the next several months should help currencies like MXN and RUB but low absolute prices are still a tailwind for
importers like INR and TRY. China is also anchoring the LM currency bloc through its support of RMB. So barring a no-deal Brexit or US-China
trade war escalation that leads to contagion into emerging markets, we look for positive returns from investing in LM carry strategies.
No single document can adequately explore all the intricacies of markets as complex as FX. We readily admit that we are only scratching the surface in
this report. Space has constrained us to leave many fundamentals and scenarios under-discussed. We would be delighted to go through them with you.

Greg Anderson – Global Head of FX Strategy (New York) +1 212 605 1409                  gregory.anderson@bmo.com
Stephen Gallo – European Head of FX Strategy (London) +44 20 7664 8124 stephen.gallo@bmo.com

                                                                                                                                                              3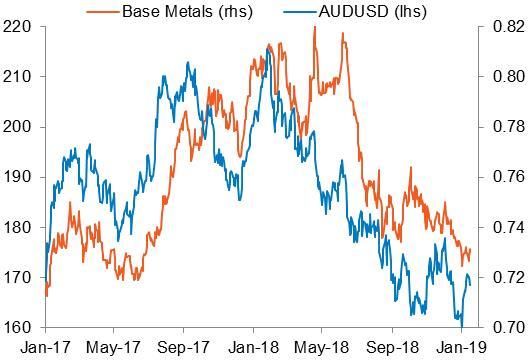
FX Strategy Team’s currency market outlook

                           BMO FX Strategy views

           Pair     3M           6M                 9M     12M

          USDCAD   1.32         1.28               1.29    1.27
          EURUSD   1.12         1.16               1.17    1.18
          USDJPY   103           106               106     104
          GBPUSD   1.25         1.29               1.32    1.32
          EURGBP   0.896        0.899              0.900   0.893
          AUDUSD   0.72         0.73               0.74    0.76
          USDCHF   0.96         0.96               0.96    0.96
          EURCHF   1.10         1.12               1.13    1.14
          USDNOK   8.60         8.55               8.45    8.23
          NZDUSD   0.68         0.70               0.71    0.72
          USDSEK   8.95         8.80               8.65    8.49
          USDCNH   6.90         6.80               6.75    6.67
          USDBRL   3.65         3.70               3.65    3.65
          USDINR   72.00        72.00              69.00   68.50
         USDKRW    1,135        1,128              1,110   1,100
          USDMXN   19.00        18.70              18.60   18.40
          USDRUB   68.30        67.50              66.50   64.50
          USDTRY   5.60         5.55               5.50    5.40
          USDZAR   13.90        13.55              13.45   13.38

                                                                   4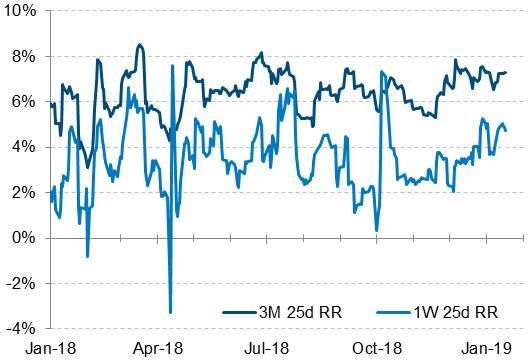
BMO’s economic forecasts
                                          Economic Forecast Summary for January 11, 2019
                                                   BMO Capital Markets Economic Research

                                          2018                               2019                            Annual
                                          Q1       Q2       Q3       Q4      Q1      Q2      Q3      Q4      2016   2017     2018    2019
UNITED STATES
Real GDP (q/q % chng : a.r.)              2.2      4.2      3.4      2.6     1.9     2.4     2.0     1.9     1.5     2.2     2.9     2.4
Consumer Price Index (y/y % chng)         2.3      2.6      2.6      2.2     1.8     2.0     2.0     2.1     1.3     2.1     2.4     2.0
Unemployment Rate (percent)               4.1      3.9      3.8      3.8     3.7     3.6     3.5     3.5     4.9     4.4     3.9     3.6
Current Account Balance ($blns : a.r.)    -487     -405     -499     -509    -535    -547    -563    -573    -452    -449    -475    -555
Interest Rates
Fed Funds Target Rate                     1.46     1.71     1.96     2.21    2.38    2.46    2.63    2.71    0.50    1.00    1.83    2.54
3-month Treasury Bill                     1.58     1.87     2.08     2.36    2.45    2.65    2.70    2.90    0.49    0.95    1.97    2.65
10-year Note                              2.76     2.92     2.93     3.03    2.75    2.80    2.90    2.95    1.25    2.33    2.91    2.85

CANADA
Real GDP (q/q % chng : a.r.)              1.7      2.9      2.0      1.5     1.0     2.5     2.2     1.9     1.4     3.0     2.1     1.8
Consumer Price Index (y/y % chng)         2.1      2.3      2.7      1.9     1.4     1.7     1.6     2.0     1.4     1.6     2.2     1.7
Unemployment Rate (percent)               5.8      5.9      5.9      5.7     5.6     5.7     5.7     5.7     7.0     6.3     5.8     5.7
Current Account Balance ($blns : a.r.)    -69.3    -66.7    -41.4    -55.7   -53.6   -54.6   -55.6   -56.1   -65.4   -60.1   -58.3   -56.5
Interest Rates                            (average for the quarter : %)
Overnight Rate                            1.25    1.25      1.50     1.75    2.00    2.25    2.50    2.50    0.50    0.71    1.44    1.90
3-month Treasury Bill                     1.14    1.21      1.47     1.66    1.70    1.95    2.15    2.15    0.49    0.69    1.37    1.85
10-year Bond                              2.24    2.28      2.28     2.32    2.60    2.65    2.75    2.80    1.26    1.78    2.28    2.10

Gray areas represent forecasts from BMO Capital Markets' Economics Team

                                                                                                                                             5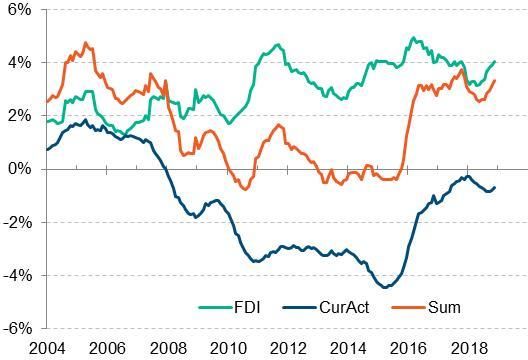
Section 1: Global macro factors

                                  6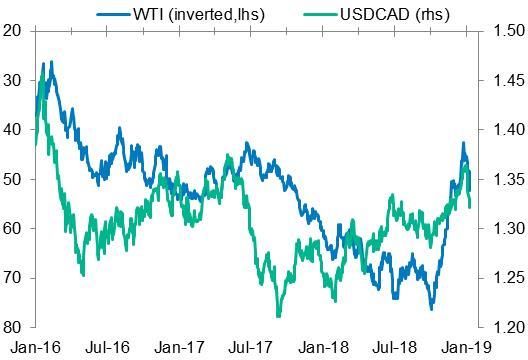
Global growth seems to have slowed
IMF world real GDP growth less 10Y moving avg                            Major Economy Composite PMIs

     Sources: BMO CM, IMF, Bloomberg                             Sources: BMO CM, Markit, Bloomberg

•   The IMF will update its outlook for World GDP next week at Davos. It is widely expected to trim its forecast of 2019
    global growth from the 3.7% outlook it gave in October. A slight downgrade to the IMF’s 3.7% estimate for 2018
    growth is also likely. However, even if 2018 growth were to come in at 3.5% instead of 3.7%, it would still mark the
    2nd straight year that global growth was above the 10Y trend (so the global output gap presumably closed a bit).
•   Looking at composite (includes both manufacturing and service sector) PMIs, every major economy has shown a
    deceleration in Q4 of 2018 relative to the first three quarters except Japan. The drop in the composite PMIs was
    sharpest in the Eurozone and UK—presumably due to Brexit angst.
•   Chinese and US PMIs only tailed off slightly in Q4, which probably suggests that most producers expect some type
    of reasonably positive evolution of the trade war. US PMIs have also mostly shrugged off the government
    shutdown thus far, but increased angst could show up if that event continues for another few weeks.

                                                                                                                           7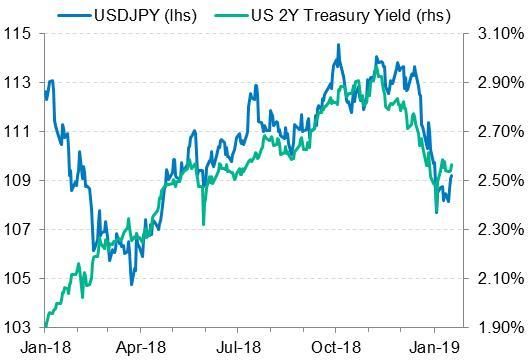
Commodities remain depressed but may have bottomed
                  Gold and oil prices                              Base metal and agricultural commodity indices

    Bloomberg                                                       Bloomberg indices

•   Brent crude ended 2018 down 20% for the year, after a chaotic collapse in Q4. It has rebounded a bit in the first
    two weeks of 2019 and is up 13% YTD, but that is partially due to the low base price on 31-Dec-2018.
•    Even with a 5% rally in December, gold still lost 2% in 2018. However, gold is up 1% in the first 12 trading days of
    2019. For most of 2018, the strong USD seemed to be the driving factor until risk aversion surged in December.
•   The Bloomberg industrial metals index is up 3% YTD through 14-Jan after falling 21% in 2018. Steel tariffs and
    fears of a China-led global economic slowdown have punished base metals prices. The strong USD in 2018 was
    also undoubtedly a factor. A reversal of those factors is probably necessary for base metals to fully recover.
•   The Bloomberg agricultural commodity index is up 2% YTD after falling 13% in 2018. Most of the past two years
    has been marked by largely neutral El Niño/La Niña conditions, which has led to unusually plentiful harvests in both
    hemispheres for two years. As with base metals and gold, the USD also seems to be a key factor.

                                                                                                                            8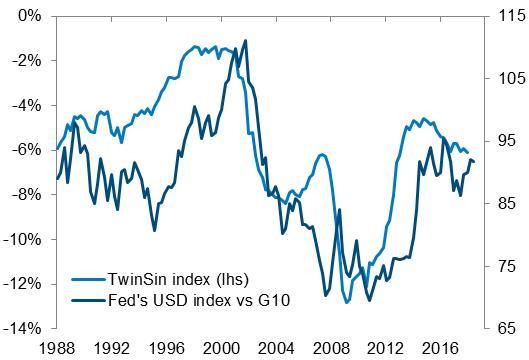
Interest rates took a tumble in all major currencies
          5Y swap rates in select currencies                                     5Y swap rates at key dates

       Bloomberg                                                        Bloomberg, BMO FX Strategy

•   Global interest rates peaked in October of last year and then fell hard in December. As would be expected, rates fell
    the most in the currencies where there was most room to do so (USD and CAD).
•   The USD-denominated 5Y swap rate fell 49bps in Q4 of 2019. It has rebounded by 12bps in early 2019 (through 18-
    January). For the whole of 2018, the 5Y swap rate rose by 33bps (most in the G10).
•   The EUR 5Y swap rate fell 19bps in Q4 and a total of 12bps in 2018. It is basically unchanged in early 2019.
•   The JPY 5Y swap rate fell 12bps in Q4 and a total of 8bps in 2018. It is back to trading just barely above 0.00%.
•   The GBP 5Y swap rate fell 15bps in Q4 but was still up by 27bps for the totality of 2018. It is up 4bps in early 2019.
•   The AUD 5Y swap rate fell by 25bps in Q4 and a total of 27bps in 2018. It is UP 2bps more thus far in 2019.
•   The CAD 5Y swap rate fell by 42bps in Q4 but was nevertheless up by 4bps in 2018. It is up 8bps YTD.

                                                                                                                             9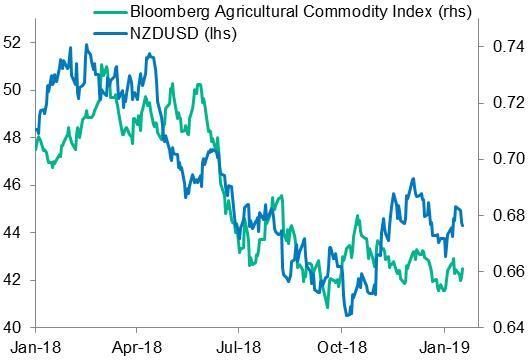
Equities mounting a comeback after a volatile 2018
MSCI World (in USD) daily and YTD returns                          Returns of MSCI indices (denominated in USD)

      Bloomberg, MSCI, BMO FX Strategy                           Bloomberg, MSCI, BMO FX Strategy

•   The MSCI World index denominated in USD fell by 11% in 2018 and the local-currency version fell by 9%. Thus far
    in early 2019 (through 17-Jan), MSCI World-USD is up 4.8% while World-local is up 4.7%.
•   Calendar 2018 saw a massive increase in equity volatility. MSCI World USD had 49 days with an absolute return
    (positive or negative) greater than 1.00% in 2018 vs just 3 such days in 2017. Two of 8 sessions in early 2019
    have seen an absolute return greater than 1.00%.
•   US equities outperformed in 2018 by declining ‘only’ 6% according to the MSCI country index. The China index
    had the worst country return among the big equity markets. There was no meaningful distinction among the
    returns of Canada, Australia, the UK and the Eurozone. The LatAm regional index outperformed MSCI World a bit.
•   The first 12 sessions of 2019 has seen uniformly positive returns with two standouts: Canada and LatAm. Both of
    those indices are heavily weighted by natural resource companies.

                                                                                                                      10
Central bank “QT” has become more discernable
Central bank balance sheet growth rates vs 1Y ago Central bank balance sheets (% GDP, to Q3)
Sources: BMO CM, Haver Sources: BMO CM, Haver
• The annual growth rates of major central bank balance sheets are drifting lower, and it appears as if most balance
sheets have peaked as a share of their respective GDPs.
• The Fed is at the head of the “QT pack” with an annual decline in its balance sheet of 8% in December.
• The ECB’s balance sheet growth rate has undergone a stunning drop. It stood at 4% in December but was above
20% a year ago. The SNB’s growth rate was flat in Nov-2018 vs nearly 20% 1Y prior.
• The growth rate of the PBoC’s balance sheet has also trailed off substantially. It was just 3% in late-2018 vs more
than 30% in late-2017. The central bank has likely been shadowing the Fed to a degree in order to keep the RMB
stable, but it is also using other tools to keep policy somewhat stimulative.
11Section 2: FX market conditions
12The return spectrum is flipping in early 2019
Calendar year 2018 spot returns (against the USD) YTD returns (against the USD) as of 17-Jan-2019
Bloomberg Bloomberg
• The Bloomberg index of the USD (BBDXY) rose by 3.1% in 2018 but is down 0.8% in 2019 through 17-Jan. Eight
of the other 9 G10 currencies fell in 2018 but 6 of 9 are up in early 2019. Noteworthy exceptions to the flip rule are
EUR and SEK (fell in 2018 and is down again in 2019) and JPY (up against the USD in both 2018 and 2019).
• In local markets, the only currency of the G10-20 group to hold its ground against the USD in 2018 was MXN. Half
that group was down double digits. Most of the currencies that had setbacks bigger than 5% in 2018 are up in
2019, but there are exceptions: INR, PLN and TRY. MXN is exceptional as a double-gainer.
13FX volatility tame relative to other asset classes
2018 realized volatility (daily returns from US closes) 3M implied vol on 18-Jan (vs USD, atmf, mid)
Sources: BMO CM, Bloomberg Sources: BMO CM, Bloomberg
• Realized volatility in FX was tame in 2018 (unlike equities and commodities). No G10 currency had realized
volatility above 10% and all G10 currencies had realized volatility below the average of the previous five years. The
only G20 currencies with realized vol in 2018 above the 2013-2017 average were CNH, MXN, TRY and ZAR.
• Current 3M option prices generally imply an expectation that volatility will remain subdued in Q1 of 2019. The big
exception is GBP, where implied vol is on an 11-handle vs a realized reading of 8.3% in 2018. Options vols in TRY
& BRL are well below 2018 realized, while implied vols in JPY and INR are well above 2018 realized volatility.
14FX managers lost big in 2018 but are flattish in early 2019
BTOP FX Investor Index returns Parker-Blacktree FX Investor Index returns
Bloomberg, Barclay’s, Citi, BMO FX Strategy Bloomberg, Parker-Blacktree, Citi, BMO FX Strategy
• The BTOP index of leveraged FX-specialty investors fell by 5.5% in 2018. This came after two straight losing years
in 2016 and 2017. The BTOP had a mildly positive return for December and is +0.03% thus far in 2019 (through
17-January). The volatility of the index faded in December and has been unusually low in January.
• The Parker-Blacktree index (P-B) of unlevered FX-specialty investors fell by 3.4% in 2019. This comes after three
straight losing years in 2015, 2016 and 2017. Like the BTOP, the P-B index had a mild recovery in the latter half of
December (a period of USD weakness). The index is -0.08% thus far in 2019 with very low volatility.
• Low volatility and the decline of LM currencies relative to the hard currencies have been a toxic combination for FX-
specialty investors. This has caused FX –specialty managers to shrink or disappear. Multi-strategy funds seem to
be allocating less capital to the FX category. Paradoxically, this could cause FX volatility to accelerate the next time
there is a sharp swing or divergence in underlying fundamentals.
15Central banks have been unusually inactive in FX
Reserve sum: Brazil, Russia, India, Turkey, Mexico Reporting central bank currency weights
Sources: BMO CM, various central banks, Bloomberg Sources: BMO CM, IMF COFER survey
• BRITM (Brazil, Russia, India, Turkey, Mexico) reserves rose by 0.7% in 2018. BRITM reserves rose by 7.5% in
2017, so reserve growth slowed dramatically. By our estimates, portfolio evaluation effects should have caused
those reserves to decline by about 1.5%, so reserve accumulation was a bit more than that 0.7% growth rate might
indicate. Russia’s reserves rose by USD35bn (+8%) in 2018 while India’s reserves declined by USD16bn (-4%).
• China is the world’s biggest reserves holder with USD3,073bn in its portfolio. Its reserves fell 2.1% in 2018, which
is a tiny bit more than our estimate of the valuation loss—suggesting that China spent a tiny amount of reserves.
• Japan’s FX reserves rose by 0.6% in 2018 to 1,209bn while Switzerland’s reserves were down 1.1% to USD742bn.
• The IMF reports that ‘allocated’ central bank FX reserves are invested as follows: USD 61.9%, EUR 20.5%, JPY
5.0%, GBP 4.5%, CAD 1.9%, AUD 1.7%, RMB 1.8%, CHF 0.2%, ‘Other’ 2.5%. These weights have been fairly
constant, although it appears that reserve managers were net buyers of a small amount of EURUSD.
16Section 3: USD factors & outlook
17Our spot in the big dollar cycle is in the eye of the beholder
Federal Reserve’s broad real trade-weighted dollar index since Bretton Woods
Sources: BMO CM, Federal Reserve, Bloomberg
• The Fed’s broad real trade-weighted USD index has shown three distinct cycles in the modern period of floating
exchange rates. Whether we’re in the initial USD down leg of the 4th cycle is now questionable.
• In early 2018, it looked obvious that December 2016 was a peak and that the USD had entered a downtrend. Now
it looks just as likely that we are in an incomplete USD uptrend, although it would be the longest in history if so.
• At present, this USD index is about 9% above its 30Y average and 7% above its post Bretton Woods average.
• Powell seemed to reference this chart when he deflected an accusatory question about Fed hikes driving up the
dollar in his September press conference. He said the USD was still lower than its 2016 peak. With the USD
nearly matching that peak when the November reading printed, Powell became much less hawkish.
18Under the radar (for now), the US’s twin sins are worsening
US fiscal and current account deficits % of GDP Sum of US twin deficits and Fed’s narrow nominal USD
Sources: BMO CM, Treasury, BEA, Bloomberg Sources: BMO CM, Federal Reserve, Bloomberg
• The US’s fiscal balance is deteriorating rapidly. For the 12M period ending with Nov-18, nominal federal
government revenues grew at a 0.2% YoY clip while outlays grew at a 5.1% rate. As a share of GDP, federal
revenue has dropped from 18.1% of GDP in 2015 to 17.2% in 2017 and 16.4% for the 12M period ending with Nov-
18. Federal outlays were 20.7% of GDP over that period, yielding a deficit worth 4.3% of GDP.
• The resurgence in domestic oil production has kept the US current deficit constant at about -2.3% of GDP, but the
non-oil current trade deficit is wider than ever.
• The ‘Twin Sin Score’ (TSS) is computed by summing the US deficits (in % of GDP). The TSS improved in the 2011-
2015 period to reach -4.7% of GDP in Q2 2015. Since then, it has deteriorated. It was -6.1% in Q3 of 2018 and
probably a bit worse in Q4. The consensus forecast is -7.3% for calendar 2019. The 30Y average is -5.7%, so the
TSS is substantially worse than average while the USD is above average. The TSS leads the USD index by 1-4Y.
19US rates may have paused but carry remains a factor
Fed funds rate, its forward rate implied by OIS Fed’s narrow USD index and a similarly-
and the Dec-18 FOMC median end-2019 dot weighted 2Y interest rate differential
Sources: BMO CM, Bloomberg Sources: BMO CM, Bloomberg
• The market has moved completely past the last set of FOMC dots published on 19-Dec. The median dot from that
FOMC had the Fed hiking twice in 2019. The OIS curve is pricing in a Fed pause that lasts for all of calendar 2019.
• With the market’s change in Fed expectations, the USD’s carry advantage over other G10 currencies has faded
slightly. At the 2Y tenor, the USD’s carry over a basket weighted the same as the Fed’s narrow USD index has
backed off by 25bps. So ‘carry momentum’ may not boost the USD in 2019 like it did in 2018.
• While carry momentum may not do much for the USD at least through Q1, raw carry still provides the USD with
considerable gravity. At the 1Y tenor, shorting the USD against either EUR or JPY costs 3.1%. If one believes the
USD will just hold still, 3% carry provides a strong argument for remaining long-USD and not hedging.
• After 18 months of chatter, the Trump Administration has gone silent on exchange rate over the past 6M months.
20We expect the USD to gain modestly in Q1 but fade in H2
USD index outlook Economic Surprise indices – US vs Global
Sources: BMO CM, Bloomberg Sources: BMO CM, Citi ESIs, Bloomberg
• USD index outlook: 1M: flat, 3M: +0.5%, 6M: +1.5%, 9M: -0.5%, 1Y: -1.5% from today.
• 2018: BBDXY gained 3.1% (2nd among G10 currencies behind JPY). The Fed hiked 4 times in 2018 and reduced
its balance sheet by USD373bn or about 1.8% of GDP (most aggressive monetary policy tightening in the G10).
• We expect the Fed to be on pause in terms of rate hikes through at least May. And we expect the Fed to continue
QT (although the juxtaposition will be less severe with the ECB having ended its bond purchase program). This
means the primary source of uplift to the USD in Q1 would come from it safe haven status—not policy divergence.
• We expect markets to begin to fret about the US’s twin deficits again and to begin to worry about USD strength.
• After the December turn pressure are fully reversed in January, we think markets will settle a bit. Risk appetite
should be a neutral factor. The USD could see a mild benefit as FX investors re-lever long-USD carry trades.
21Section 4: CAD factors & outlook
22CAD likely to remain range-bound as oil settles
USDCAD outlook relative to forward curve USDCAD and spot WTI crude
Sources: BMO CM, Bloomberg Sources: BMO CM, Bloomberg
• USDCAD outlook curve: 1M 1.33, 3M 1.32, 6M 1.28, 9M 1.29, 12M 1.27
• 2018: CAD spot return was -8.1% (2nd worst in the G10 ahead of only AUD), despite the fact that the BoC hiked 3
times for a total of 75bps in 2018 (2nd most in the G10 behind the Fed).
• The BoC has retained a tightening bias but emphasized that it will be cautious and data-dependent in its approach.
Poloz has emphasized that he is closely watching the oil sector, which helps cement oil as the #1 factor for Q1.
• We expect oil to stabilise in the $50-60 range. That’s not particularly supportive for the Canadian economy, but it’s
not disastrous. We think the BoC’s 1.7% GDP growth forecast for 2019 is about right.
• We have a small uptick in our USDCAD outlook curve in Q4. We assume foreign investors will increase their FX
hedges to cover the Canadian election in October. This impact should wear off by the year’s end.
23Volatility is exceptionally low in USDCAD
USDCAD 1W and 3M risk reversal
USDCAD realized and implied 3M volatility divided into atmf implied vol
Sources: BMO CM, Bloomberg Sources: BMO CM, Bloomberg
• Realized 3M vol dropped to 5.6% at the end of 2018. The CAD surge in the first week of January moved it briefly
back above 6.0%, but it is back down to 5.7%. This is exceptionally low by historical standards.
• Implied 3M vol has not followed realized volatility through 6.5. It spiked a bit for yearend and then remained
elevated through the CAD surge. But even with spot having traded in a very narrow range during the second full
week of January, there appears to be technical support in implied vol around 6.5. As a result, there is presently an
exceptionally large markup of implied vol over realized volatility.
• Risk reversals have been extremely tame over the past year. The 1W risk reversal has been drifting a bit higher—
at least after normalization for the level of atmf implied vol. The 3M has retained a fairly stable skew for the past
year and isn’t in a particularly noteworthy spot.
24USDCAD and a few of its most correlated ‘factors’
USDCAD vs the 2Y interest rate differential USDCAD vs the DXY US dollar index
USDCAD vs the S&P 500 index USDCAD vs the CRB commodity price index
25Our model saysand
Correlatedaking thatour
commodities are ‘driving’
USDCAD model’s USDCAD
‘fair value’
3M out of sample R-squared of single factors
Spot USDCAD and BMO model fair value bands
used to forecast USDCAD 1 day ahead
Sources: BMO CM, Bloomberg Sources: BMO CM, Bloomberg
• Ten of the twelve variables we track improve day-ahead USDCAD forecasts relative to simply using the previous
day’s USDCAD close as the forecast for the next day. The CRB commodity index improves forecasts the most.
• Using a correlation approach yields similar results. Nine of the 12 correlations (using 3M of data) have the expected
sign with the CRB having the highest correlation followed closely by WTI-grade oil and other commodity variables.
• The relationship between USDCAD and interest rate differentials (of any tenor) is almost non-existent. This is a big
change from the first 9M of 2018, when relative interest rate movements dominated other USDCAD factors.
• The model also shows a fairly strong relationship between risk appetite and USDCAD, with the level of the equity
market being the most correlated and most predictive variable in that category.
• Our model has fair value at 1.3347 (close of 17-Jan). Fair value is trending lower so the model wants to sell spikes
in USDCAD above fair value. The +/- 2 SE band around fair value is 1.3171 to 1.3523.
26Section 5: RMB factors & outlook
27The RMB should tread water as growth deteriorates
USDCNH FX Strategy outlook USDCNH spot vs Shanghai Composite
Sources: BMO CM, Bloomberg Sources: BMO CM, Haver
• Outlook curve: 3M – 6.90 , 6M – 6.85 , 9M – 6.78 , 12M – 6.68
• 2018: the CNH fell 5.2% vs the USD as the US/China trade impasse started and Fed/PBoC policies diverged.
• On a 2-3M basis, our USDRMB bias would be to look for one more opportunity to get long. We expect US &
Chinese trade negotiators to snatch the “low-hanging fruit” in the discussions first by looking for “handshake
moments” related to minor infringements in the bilateral relationship.
• This will leave the more intractable issues lingering until well into the future, and we think the 90-day deadline
(March 1st) imposed in early-December will come and go without a clear resolution.
• However, we do not expect Trump to raise tariffs at the end of the deadline. As long as Trump refrains from
erecting new trade barriers, the FX market will lose interest in the trade war as 2019 progresses.
28The RMB needs Trump’s trade measures to be reversed
Select BoP data vs USDCNY spot Broad REER vs 20Y avg. & basic balance
Sources: BMO CM, Haver Sources: BMO CM, Haver
• As its economy buckles under the weight of the earlier deleveraging push and the trade impasse, the BoP is
deteriorating. This deterioration in the BoP makes it look like the 2017 rally in the RMB was the aberration in the
medium-term trend lower, which appears to have started in 2014/2015.
• The twin problems that China faces are the worsening domestic and international growth environments, which are
making it harder for the PBoC to engineer a smooth devaluation of the RMB.
• Given the December reserve bleed (see following slide), it looks as if China is making a greater effort to park the
RMB as the growth outlook deteriorates so as to prevent a rehash of the pernicious style of outflows experienced in
2015/16. But we have pencilled in only a 1.3% rally in the RMB vs the USD over the coming 12M, on our
expectation that China still needs a weak RMB and chooses to delay a further devaluation.
29China probably sold FX to stabilize the RMB in Dec.
SAFE adjusted FX reserve account flows CFETS CNY Index (trade-weighted mid-rate)
Sources: BMO CM, Haver Analytics Sources: BMO CM, CFETS
• The officially reported data recorded a modest FX reserve build for the month of December, but on a valuation-
adjusted basis, we believe SAFE actually bled reserves.
• Our hypothetical portfolio shows a $44 billion bleed (accounting for bond and FX market changes), which would be
the largest such flow since early 2016. But the actual amount is more a matter of conjecture. The main point is that
PBoC probably intervened to halt RMB weakness in December, and it had help from the outcome of the US/China
trade “truce” at the start of the month (see right chart).
• This does not necessarily mean that PBoC is adverse to more RMB weakness, however. Indeed, the central bank
often keeps the RMB steady when financial market tensions are high (the MSCI World Index fell 8% in December).
Since the start of 2019, PBoC has allowed the CFETS CNY Index to drift lower.
30Section 6: FX majors (EUR, GBP, JPY)
31EUR may barely escape outright catastrophe in 2019
EURUSD FX Strategy outlook EURUSD spot vs GE/IT 10Y credit spread
Sources: BMO CM, Bloomberg Sources: BMO CM, Bloomberg
• Outlook curve: 3M – 1.12, 6M – 1.16, 9M – 1.17, 12M – 1.18
• 2018: EURUSD declined 4.4% due to slowing growth and geopolitical tensions. The ECB concluded its QE program.
• We expect another small leg lower in the EUR in the build-up to the EU parliamentary elections in May. A risk
discount should also remain embedded in the EUR until it is clear that 1) Eurozone growth deceleration has bottomed
out, 2) Brexit is resolved and 3) the Chinese economy starts to recover.
• We expect the EUR to receive some support in H2 from a more hawkish successor to Draghi. But that is a long way
off. Draghi’s increased dovishness has already started to support some asset prices at the expense of a weaker
EUR (i.e. the “Draghi put” as shown in the right chart).
• Macron’s disastrous presidency, Italy’s debt woes, and financial fragmentation will remain legacy issues for the bloc.
32EMU does not facilitate the necessary adjustments
Select Eurozone current account data Credit to non-financial corporations
Sources: BMO CM, Haver Sources: BMO CM, Haver
• The Eurozone features an enormous current account surplus, which is more than 3% of gross output. Germany
accounts for the largest share of the total, but it’s the periphery (GIIPS) that is responsible for the majority of the
swing in the C/A balance from -0.2% of GDP in 2011 to where it is today.
• This is because the Eurozone lacks the necessary mechanisms to reduce financial fragmentation and support growth
in economically weak segments of the bloc (i.e. fiscal policy or fiscal transfers). In other words, the GIIPS’ current
account surplus is a function weak demand and remaining economic slack.
• The other problem is that the EUR is too weak for Germany, which is why its surplus will not materially decline. As
such, the EUR adds to global imbalances in a big way. A more hawkish ECB policy would cause the EUR to
appreciate, but would also increase the stranglehold on the GIIPS.
33GBP’s extend and pretend moment (probably)
GBPUSD FX Strategy outlook GBPUSD spot vs EURUSD spot
Sources: BMO CM, Bloomberg Sources: BMO CM, Haver
• Outlook curve: 3M – 1.25, 6M – 1.27, 9M – 1.32, 12M – 1.32
• 2018: the broad GBP fell 1.4% as UK political tensions increased and European economic growth slowed.
• We think Brexit will result in either a “no deal” scenario on March 29th or an extension of Article-50 leading to 1) a
modified deal which Parliament votes in favour of (“soft Brexit”), 2) new elections and/or a new referendum or 3) a
second extension of Article-50. It’s theoretically possible for MPs to approve a modified deal before March 29 th
but we think the odds of that are quite low (10%).
• We assign the “no deal” scenario a 40% probability and an Article-50 extension leading to one of the three
additional permutations a 50% probability. No deal by March 29th would see GBPUSD fall to 1.20. Under the 50%
scenario, the GBP could fall sharply if there are new elections or if Parliament cannot approve a modified deal.
34JPY likely to stay strong even in risk-on
USDJPY outlook relative to forward curve USDJPY and the US 2Y Treasury yield
Sources: BMO CM, Bloomberg Sources: BMO CM, Bloomberg
• USDJPY outlook curve: 1M – 106, 3M - 103, 6M - 106, 9M - 106, 1Y – 104
• 2018: JPY spot return against the USD was (best in the G10). The BoJ maintained its -0.10% base rate and made
no formal adjustments to its QQE balance sheet expansion policy, although it did let the 10Y yield rise to +0.10%.
• There is a distinct seasonality in USDJPY. The pair tends to fall in Q1 and then rally in April and May. This is due
to Japanese investors hedging their US bond holdings ahead of Japanese financial yearend and then letting those
hedges roll off afterwards.
• The Q1 seasonality overpowered the impact of rising US interest rates during Q1, but USDPJY has tracked the US
2Y Treasury yield since April of 2018. We don’t view this correlation as trustworthy—particularly Jan through Mar.
• There was a 4% ‘flash crash’ in USDJPY on 03-January. This event probably stopped out any speculators that had
remained long USDJPY but it probably didn’t stop in Japanese investors exposed to USDJPY downside.
35Japan’s twin virtue fundamentals should support JPY
Japan core balance of payments flows (JPYtrn) Japan Gross Debt and Fiscal Deficit (% of GDP)
Sources: BMO CM, Japan MoF, Bloomberg Sources: BMO CM, Japan MoF, OECD, Bloomberg
• Although it declined slightly, Japan still ran a current account surplus in Q3 worth 3.8% of GDP. With oil
prices so much lower and US interest rates higher, Japan’s current account surplus is likely to be above
4.0% of GDP in 2019. Unless it is counteracted by investment outflows, this big of a surplus leads to a
stronger currency over time.
• Japan foreign direction investment outflows (investment in property, plant and equipment) accelerated to
about 3.0% of GDP in 2018, but the ‘net core flow’ is still positive by about 1.0% of GDP, so JPY should
appreciate unless speculators substantially increase their JPY shorts.
• The OECD estimates that Japan ran the lowest budget deficit in 2018 in ten years. But calling that 3.2% deficit a
deficit is a bit inaccurate. Net government debt has been falling by about 1% of GDP per quarter due to the BoJ’s
QQE purchases of JGBs running above MoF issuance.
36Section 7: G10 next tier
(AUD, CHF, NOK, NZD, SEK)
37AUD appears undervalued relative to most fundamentals
AUDUSD outlook AUDUSD and the Bloomberg base metals index
Bloomberg, BMO CM Bloomberg
• Outlook curve: 1M – 0.72, 3M - 0.72, 6M – 0.73, 9M - 0.74, 1Y - 0.76
• 2018: AUD lost 10% against the USD (worst in the G10). The RBA kept its base rate at 1.50% all year.
• AUDUSD is typically thought of as the base metals currency. AUDUSD is presently trading at a discount to what
base metals prices would suggest. When base metals were at this level in 2017, AUDUSD was at 0.77 (see chart).
• One reason for the AUD discount is an extremely dovish (given the macroeconomic backdrop) of the RBA.
Australia has almost no output gap, but the RBA has held onto a negative real base rate. Another reason is the
market trading AUD as a proxy for Chinese industrial production.
• Australia’s macro fundamentals are much stronger than the currency has been. GDP growth averaged 3.0% YoY in
the first 3 quarters of 2018 and the consensus forecast for 2019 is 2.7%. With a 1.9% YoY reading for Q3, inflation
is hotter than most of the G10. Australia’s ‘twin sins’ sum to about -2.6% for 2018—best since 2002.
38CHF could surge against European peers again
USDCHF FX Strategy Outlook EUR Narrow TWI vs SNB sight deposits
Sources: BMO CM, Bloomberg Sources: BMO CM, SNB, Haver
• Outlook curve: 3M – 0.96, 6M – 0.96, 9M – 0.96, 12M – 0.95
• 2018: CHF fell 1% vs the USD but outperformed EUR due to risk aversion. The SNB didn’t touch its base rate.
• The USD has rolled over during a period where the Eurozone growth outlook has worsened, European political
risks are elevated and EUR strength is restrained. This is a recipe for a broadly firm CHF.
• The SNB will probably need to be more active in restraining EURCHF weakness until downside EUR risks
dissipate. But due to its large B/S, SNB intervention will probably put a bid into global asset markets.
• Increased SNB activity is already visible in the right chart, which demonstrates how domestic sight deposits have
crept up as the narrow value of the EUR has declined. The SNB is unlikely to let its balance sheet contract for now.
Given global risks and other factors, Switzerland has a huge recycling problem with a 10% of GDP C/A surplus.
39NOK reflects global growth and European risk premia
USDNOK FX Strategy Outlook USDNOK spot vs Brent crude oil
Sources: BMO CM, Bloomberg Sources: BMO CM, Bloomberg
• Outlook curve: 3M – 8.44, 6M – 8.59, 9M – 8.50, 12M – 8.06
• 2018: NOK fell 5.1% vs the USD as energy prices slumped. The Norges Bank made one 25bp rate hike.
• Judging by the reversal in EURNOK, we are past the worst of NOK weakness as a number of factors (including a
more dovish Fed) have a positive impact on global financial conditions. Brent is currently the lead driver of
USDNOK, which speaks to a global growth risk discount embedded in the NOK.
• In terms of the domestic political landscape, the country seems to be gradually moving in a “greener” direction, with
a number of key politicians openly supporting reductions in oil production tax incentives. This should create a
barrier on NOK strength, unless a specific oil factor drives Brent back to $80/bbl or above.
• Ex-fossil fuel exports, Norway features a sizeable merchandise trade deficit.
40NZD is cheap by design
NZDUSD outlook NZDUSD and agricultural commodity prices
BMO CM, Bloomberg Bloomberg
• Outlook curve: 1M – 0.68, 3M - 0.68, 6M - 0.70, 9M - 0.71, 1Y - 0.72
• 2018: NZD lost 5.5% against the USD (6th in the G10). The RBNZ kept is base rate at 1.75% all year.
• The recovery in NZDUSD may seem to be running ahead of the recovery in agricultural commodity prices (see
chart), but it’s important to keep in mind that as an energy importer, New Zealand benefits from low oil prices. New
Zealand’s commodity terms of trade (CToTs) were hammered in Q2 and Q3 of 2018. However, the sharp decline in
oil in Q4 caused New Zealand’s CToTs have risen sharply, which should show up in the Q4 balance of payments
data and in the commercial FX flows seen in at least Q1 of 2019.
• China is New Zealand’s biggest trade partner, but RBNZ officials manage monetary and FX policy with a keen
focus on AUDNZD. The 5% decline in that cross in 2018 should keep the RBNZ from raising rates in 2019, even if
inflation is running at 1.9% and the country has no output gap. RBNZ forward guidance is no rate hikes until 2020.
41SEK weakness may be partially structural
USDSEK FX Strategy Outlook Broad NEER vs current account balance
Sources: BMO CM, Bloomberg Sources: BMO CM, Haver
• Outlook curve: 3M – 9.10, 6M – 9.00, 9M – 8.87, 12M – 8.75
• 2018: SEK fell 8% against the USD. The Riksbank maintained a very stimulative -0.50% base rate all year.
• Sweden’s real GDP growth rate has been tracking the Eurozone’s lower in recent quarters and its BoP has been
deteriorating consistently over the past 5-10 years. We see EURSEK trading above 10.00 in 12M (10.10).
• The SEK has become a de facto “target” for monetary policy. The broad level of the SEK influences domestic
inflation, which the Riksbank officially targets, but EUR weakness appears to be an added complication for the
central bank. Sweden also faces a declining services trade surplus which looks like it could swing to a deficit soon.
• Germany is Sweden’s single-largest trading partner, and the EUR is too weak vs its external fundamentals. We
look for a prolongation of ultra-loose Riksbank policy until at least late-2019.
42Section 8: Select local market currencies
(BRL, INR, KRW, MXN, RUB, TRY, ZAR)
43BRL back to being backed by a large core flows surplus
USDBRL outlook Brazil core flows (% of GDP)
Sources: BMO CM, Bloomberg Sources: BMO CM, Bloomberg
• Outlook curve: 1M – 3.70, 3M – 3.65, 6M - 3.70, 9M - 3.65, 1Y - 3.65
• 2018: Spot BRL return was -15.8% (only ARS was worse among LatAm majors). Bacen implemented two 25bp rate
cuts in H1 and didn’t reverse them with inflation running above the 4.0% inflation target in H2.
• Despite falling commodity prices in 2018, Brazil’s current account deficit remained under 1% of GDP. Foreign direct
investment slowed in H1 2018 but accelerated in October and November. With the election now over, it is likely that
FDI will be at least 4% of GDP in 2019, which would leave Brazil with a core flows surplus of 3% of GDP or greater.
This big of a core flows surplus has historically allowed Brazilian policymakers to manage BRL to where they want it.
• Bolsonaro’s new government has riled the media in Trump-like fashion, but markets have been generally pleased
with the reforms that Economy Minister Guedes has promoted—especially the pension reform. Markets are similarly
comfortable with incoming Bacen head Roberto Campos Neto.
44INR is in election mode (and so are its fundamentals)
USDINR FX Strategy Outlook 10Y sovereign yield vs USDINR spot
Sources: BMO CM, Bloomberg Sources: BMO CM, Bloomberg
• Outlook curve: 3M – 72.00, 6M – 72.00, 9M – 71.00, 12M – 69.00
• 2018: INR fell 8.5% as India’s BoP worsened. The RBI made two 25bp rate hikes and kept reserve ratios constant.
• The INR featured a persistent risk discount in 2018 given the government’s consistent inability to reach its fiscal
targets and a gradual deterioration in the BoP. India’s REER fell 7.7% amidst the steady decline in net exports.
• Even with the decline in oil, India’s merchandise trade deficit rose to 7.4% of GDP by Q3 2018 (up from a deficit of
5.2% of GDP one year prior). The culprits have been a relaxation of fiscal policy and a steady uptick in credit
growth in preparation for this year’s spring parliamentary elections. “Low-flation” could trigger an RBI rate cut.
• Modi’s BJP has been trailing the INC in the polls, and the former underwent heavy state election defeats during
December. Most surveys point to a hung parliament. Such a result will further cloud the reform outlook for India.
45KRW will continue to reflect a soggy global outlook
USDKRW FX Strategy Outlook SK/China trade balance vs USDKRW
Sources: BMO CM, Bloomberg Sources: BMO CM, Haver, Bloomberg
• Outlook curve: 3M – 1,135, 6M – 1,128, 9M – 1,110, 12M – 1,100
• 2018: KRW fell 4.0% vs the USD (slightly less than RMB) as exports slowed. The BoK had one 25bp rate hike.
• The growth rate of South Korea’s economy is decelerating. It will likely be south of 2.0% in 2019 unless there is a
material shift in the US/China trade impasse or Chinese officials aggressively stimulate growth.
• Samsung’s latest profit warning corroborates the signals coming from the trade data; exports of cell phone parts fell
nearly 50% YoY in November and December of last year, and semiconductor receipts were down by 8% (the most
since Q2 2016. South Korea’s goods trade surplus with mainland China has fallen sharply.
• CNYKRW has broken out above KRW164.00 in recent sessions after spending a number of months generally
below that level. We expect both sides to work towards keeping the pair in the KRW160.00/170.00 range.
46MXN should continue to outperform
USDMXN outlook Banxico base rate relative to the Fed’s
Sources: BMO CM, Bloomberg Sources: BMO CM, Bloomberg
• Outlook curve: 1M – 19.10, 3M – 19.00, 6M – 18.70, 9M – 18.60, 1Y – 18.40
• 2018: Spot MXN return was +0.01% vs the USD (best among LatAms). Banxico hiked its base rate 4 times (a total
of 100bps) to match the Fed and demonstrate the most hawkish stance among the major LatAm central banks.
• The peso weakened in Q4 when oil fell below $50, but it arguably fared better than might have been expected during
December’s turmoil. One reason is that the transition to the AMLO government was smooth and that government
has reiterated that it doesn’t want peso weakness.
• Mexico is likely to capture FDI as US-based multinationals re-shore from China.
• MXN is still very cheap relative to its PPP equilibrium. We have it about 20% undervalued by that metric. Mexico’s
twin deficit fundamentals are better than the US’s and are strong relative to those of most EM economies.
47RUB remains remarkably stable despite weak oil
USDRUB FX Strategy Outlook USDRUB 1Y fwd points vs USDRUB spot
Sources: BMO CM, Bloomberg Sources: BMO CM, Bloomberg
• Outlook curve: 3M – 68.30, 6M – 67.50, 9M – 66.50, 12M – 64.50
• 2018: RUB fell 17% vs the USD, but most of the weakness was sanction-related as opposed to oil or the BoP.
CBR executed two 25bp rate cuts in H1 and then took them back with two 25bp rate hikes in H2.
• It appears as if CBR bled few reserves during the Q4 decline in the price of oil. This is partly due to Russia’s
current account surplus, which improved consistently throughout 2018, to stand at more than 5.5% of GDP by Q3.
Core CPI inflation has also remained low and stable at rates below 4.0%. Real growth would be better in the
absence of sanctions, but a 1.6% rate for all of 2018 is respectable, all things considered.
• Russia’s main problems are structural in nature. The reliance on energy exports will see growth slow by 0.1-0.3%
in 2019. Despite this and the threat of further US-imposed sanctions, the steady decline in external debt and
Putin’s attempts to reduce the country’s “dollar dependence” will keep the RUB insulated from sharp weakness.
48TRY is past the worst of the BoP tension (for now)
USDTRY FX Strategy Outlook TRY NEER vs goods trade balance
Sources: BMO CM, Bloomberg Sources: BMO CM, Haver
• Outlook curve: 3M – 5.60, 6M – 5.55, 9M – 5.50, 12M – 5.40
• 2018: TRY fell 28% as Erdogan sought to prevent CBRT from lifting rates. To thwart speculative attacks, CBRT
ended up having to hike the one-week repo rate from 8.0% to 24.0% through a series of rate hikes.
• The improvement in Turkey’s BoP is putting a lid on USDTRY, even as the economy continues to slow and
US/Turkey relations remain at a low point. The improvement in the BoP has come at the expense of a sharp
slowdown in domestic demand. Not only has household consumption slowed, but businesses remain reluctant to
invest due to the uncertain political climate as well as a softer global growth outlook.
• Non-resident investors will turn a bit more confident following the Fed’s decision to shift to a more neutral/dovish
monetary policy stance, but Turkey will still struggle to sustain a healthy pace of non-debt capital inflows. Upside
risks to the outlook stem from EU-related talks over Turkey’s customs union membership and reform.
49ZAR gains should be tepid
USDZAR FX Strategy Outlook Basic balance vs broad NEER
Sources: BMO CM, Bloomberg Sources: BMO CM, Haver
• Outlook curve: 3M – 13.90, 6M – 13.55, 9M – 13.45, 12M – 13.38
• 2018: ZAR fell 17% vs the USD given commodity price declines and South Africa’s weak BoP. SARB made one
25bp rate cut early in the year.
• Despite the weakness in energy prices, ZAR weakness seems unable to cause a persistent improvement in the
BoP. Given massive structural issues in the domestic economy, a persistent rebound in net FDI is also unlikely.
• Eskom problems look likely to continue until well into 2019. On this factor, the ZAR is probably priced for a
prolonged period of intermittent power outages and other difficulties. Neither a sustained improvement nor a full
collapse of the energy supplier is currently reflected in the price.
• Fed dovishness all but completely removes the threat of an immediate external debt crisis for the ZAR, but the
former is also a symptom of a weak global backdrop. ZAR suffers indirectly from the US/China trade impasse.
50FICC Macro Strategy Team
CONTACTS
Margaret Kerins, CFA MD Head of FICC Strategy margaret.kerins@bmo.com +1 312 845 2687
Ian Lyngen, CFA MD Head of US Rates Strategy ian.lyngen@bmo.com +1 212 702 1703
Greg Anderson, CFA PhD Director Global Head of FX Strategy gregory.anderson@bmo.com +1 212 605 1409
Stephen Gallo, Director European Head of FX Strategy stephen.gallo@bmo.com +44 20 7664 8124
Benjamin Reitzes, Director, Canadian Rates & Macro Strategist benjamin.reitzes@bmo.com +1 416 359 5628
Dan Krieter, CFA Director - Fixed Income Strategy dan.krieter@bmo.com +1 312 845 4015
Dan Belton, PhD Associate - Fixed Income Strategy dan.belton@bmo.com +1 312 845 5068
Ben Jeffery, Analyst - Fixed Income Strategy ben.jeffery@bmo.com +1 212 885 4135
51Disclosure
This material has been prepared with the assistance of employees of Bank of Montreal, BMO Nesbitt Burns Inc. and BMO Capital Markets Corp. (together, “BMO”) who are involved in
fixed income and foreign exchange sales and marketing efforts. Accordingly, it should be considered to be a solicitation of the fixed income and foreign exchange businesses generally
and not a research report that reflects the views of disinterested research analysts.
Notwithstanding the foregoing, this material should not be construed as an offer or the solicitation of an offer to sell or to buy or subscribe for any particular product or services
(including, without limitation, any commodities, securities or other financial instruments).
We are not soliciting any specific action based on this material. It is for the general information of our clients. It does not constitute a recommendation or a suggestion that any
investment or strategy referenced herein may be suitable for you. It does not take into account the particular investment objectives, financial conditions, or needs of individual clients.
Nothing in this material constitutes investment, legal, accounting or tax advice, or a representation that any investment or strategy is suitable or appropriate to your unique
circumstances, or otherwise constitutes an opinion or a recommendation to you. BMO is not providing advice regarding the value or advisability of trading in commodity interests,
including futures contracts and commodity options or any other activity which would cause BMO or any of its affiliates to be considered a commodity trading advisor under the U.S.
Commodity Exchange Act. BMO is not undertaking to act as a swap advisor to you or in your best interests and you, to the extent applicable, will rely solely on advice from your qualified
independent representative in making hedging or trading decisions. This material is not to be relied upon in substitution for the exercise of independent judgment. Any recipient of these
materials should conduct its own independent analysis of the matters referred to herein, together with its qualified independent representative, if applicable. Any discussion of tax
matters in these materials (i) is not intended to be used, and cannot be used or relied upon, for the purposes of avoiding any tax penalties and (ii) may have been written in connection
with the “promotion or marketing” of the transaction or matter described herein. Accordingly, the recipient should seek advice based on its particular circumstances from its own
independent financial, tax, legal, accounting and other professional advisors (including, without limitation, its qualified independent representative, if applicable).
These materials are confidential and proprietary to, and may not be reproduced, disseminated or referred to, in whole or in part without the prior consent of BMO. Information presented
in this material has been obtained or derived from sources believed by BMO to be reliable, but BMO does not guarantee their accuracy or completeness. BMO assumes no responsibility
for verification of the information in these materials, no representation or warranty is made as to the accuracy or completeness of such information and BMO accepts no liability
whatsoever for any loss arising from any use of, or reliance on, these materials. BMO assumes no obligation to correct or update these materials. These materials do not contain all
information that may be required to evaluate any transaction or matter and information may be available to BMO and/or its affiliates that is not reflected herein.
These materials do not contain all information that may be required to evaluate any transaction or matter and information may be available to BMO and/or its affiliates that is not
reflected herein.
BMO and its affiliates may have positions (long or short), and effect transactions or make markets, in securities mentioned herein, or provide advice or loans to, or participate in the
underwriting or restructuring of the obligations of, issuers and companies mentioned herein. Moreover, BMO’s trading desks may have acted on the basis of the information in these
materials.
BMO Capital Markets is a trade name used by BMO Financial Group for the wholesale banking businesses of Bank of Montreal, BMO Harris Bank N.A. (member FDIC), Bank of Montreal
Ireland p.l.c, and Bank of Montreal (China) Co. Ltd and the institutional broker dealer businesses of BMO Capital Markets Corp. (Member SIPC) in the U.S., BMO Nesbitt Burns Inc.
(Member Investment Industry Regulatory Organization of Canada and Member Canadian Investor Protection Fund) in Canada and Asia and BMO Capital Markets Limited (authorised and
regulated by the Financial Conduct Authority) in Europe and Australia.
® Registered trademark of Bank of Montreal in the United States, Canada and elsewhere.
™ - “BMO (M-bar roundel symbol) Capital Markets” is a trade-mark of Bank of Montreal, used under licence.
52Disclosure - continued
TO U.K./E.U. RESIDENTS: In the UK, Bank of Montreal London Branch is authorised and regulated by the Prudential Regulation Authority and the Financial Conduct Authority
(“FCA”) and BMO Capital Markets Limited is authorised and regulated by the FCA. The contents hereof are intended solely for clients which satisfy the criteria for classification as
either a “professional client” or an “eligible counterparty”, each as defined in Directive 2014/65/EU. Any U.K. person wishing to effect transactions in any security discussed
herein should do so through Bank of Montreal, London Branch or BMO Capital Markets Limited; any person in the E.U. wishing to effect transactions in any security discussed
herein should do so through BMO Capital Markets Limited.
TO PRC RESIDENTS: This material does not constitute an offer to sell or the solicitation of an offer to buy any financial products in the People’s Republic of China (excluding Hong
Kong, Macau and Taiwan, the “PRC”). BMO and its affiliates do not represent that this material may be lawfully distributed, or that any financial products may be lawfully
offered, in compliance with any applicable registration or other requirements in the PRC, or pursuant to an exemption available thereunder, or assume any responsibility for
facilitating any such distribution or offering. This material may not be distributed or published in the PRC, except under circumstances that will result in compliance with any
applicable laws and regulations.
TO HONG KONG RESIDENTS: This material has not been reviewed or approved by any regulatory authority in Hong Kong. Accordingly the material must not be issued, circulated
or distributed in Hong Kong other than (1) except for "structured products" as defined in the Securities and Futures Ordinance, in circumstances which do not constitute it as a
“Prospectus” as defined in the Companies Ordinance or which do not constitute an offer to the public within the meaning of that Ordinance, or (2) to professional investors as
defined in the Securities and Futures Ordinance and the Securities and Futures (Professional Investor) Rules made thereunder. Unless permitted by the securities laws of Hong
Kong, no person may issue in Hong Kong, or have in its possession for issue in Hong Kong this material or any other advertisement, invitation or document relating to the
products other than to a professional investor as defined the Securities and Futures Ordinance and the Securities and Futures (Professional Investor) Rules.
TO SINGAPORE RESIDENTS: This document has not been registered as a prospectus with the Monetary Authority of Singapore and the material does not constitute an offer or
sale, solicitation or invitation for subscription or purchase of any shares or financial products in Singapore. Accordingly, BMO and its affiliates do not represent that this
document and any other materials produced in connection therewith may lawfully be circulated or distributed, whether directly or indirectly, to persons in Singapore. This
document and the material do not and are not intended to constitute the provision of financial advisory services, whether directly or indirectly, to persons in Singapore.
TO THAI RESIDENTS: The contents hereof are intended solely for the use of persons qualified as Institutional Investors according to Notification of the Securities and Exchange
Commission No. GorKor. 11/2547 Re: Characteristics of Advice which are not deemed as Conducting Derivatives Advisory Services dated 23 January 2004 (as amended). BMO
and its affiliates do not represent that the material may be lawfully distributed, or that any financial products may be lawfully offered, in compliance with any regulatory
requirements in Thailand, or pursuant to an exemption available under any applicable laws and regulations.
TO KOREAN RESIDENTS: This material is not provided to make a recommendation for specific Korean residents to enter into a contract for trading financial investment
instruments, for investment advising, for discretionary investment, or for a trust, nor does it constitute advertisement of any financial business or financial investment
instruments towards Korean residents. The material is not provided as advice on the value of financial investment instruments or any investment decision for specific Korean
residents. The provision of the material does not constitute engaging in the foreign exchange business or foreign exchange brokerage business regulated under the Foreign
Exchange Transactions Act of Korea.
In Asia, Bank of Montreal is licensed to conduct banking and financial services in Hong Kong and Singapore. Certain products and services referred to in this document are
designed specifically for certain categories of investors in a number of different countries and regions. Such products and services would only be offered to these investors in
those countries and regions in accordance with applicable laws and regulations. The Information is directed only at persons in jurisdictions where access to and use of such
information is lawful.
53You can also read


