FY 2021/2022 Proposed Operating & Capital
     Budget Oversight Review Board
              July 22, 2021
←
→
Page content transcription
If your browser does not render page correctly, please read the page content below
FY 2021/2022 Proposed Operating & Capital
Budget Oversight Review Board
July 22, 2021
FY 2021/2022

FY 2021 Property Valuation

FY 2022 Property Valuation

                                                                    FY 2022 valuation
                                                                       $13.5 billion
                                            2.3% increase in
                                            existing property
                    New construction
                     $165.3 million
FY 2021 valuation
  $13.09 billion

                                 Overall, total taxable value up 3.56% from FY 2021 total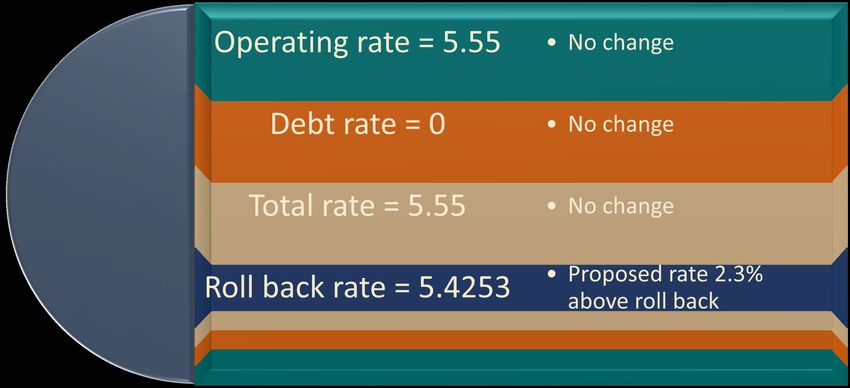
Proposed Millage Rate

Proposed Millage Rate

Effect of Proposed Rate on Typical
Homesteaded Properties
 Assessed Value           Current            Proposed            Annual         Monthly
  (Before $50K             5.55                5.55             Increase        Increase
 Exemption) (1)
    $250,000               $1,110               $1,129             $19            $1.62
    $350,000               $1,665               $1,692             $27            $2.27
    $450,000               $2,220               $2,255             $35            $2.91

               (1) Increased by Save Our Homes cap of 1.4% (lesser of CPI for previous year or 3%)
Effect of Proposed Rate on Typical Non-
Homesteaded Properties
 Assessed Value           Current            Proposed              Annual    Monthly
    (Without               5.55                5.55               Increase   Increase
 Exemption) (1)
    $250,000               $1,387              $1,419               $32       $2.66
    $350,000               $1,942              $1,987               $45       $3.72
    $450,000               $2,497              $2,554               $57       $4.79

               (1) Increased by average City-wide increase 2.3%
How Much of My Tax Bill Goes to the City?

How Much of My Tax Bill Goes to the City?
About 28                                       Other taxing
cents of                                       authorities
every $1 in                                    collect about 72
total                                          cents (PB
property                                       County, School
taxes paid                                     Board, Health
goes to the                                    Care District,
City (based                                    other special
on prior year                                  taxing districts)
data)
Total Revenues/Sources All Funds
$217,591,100                  Carryover, $63,896,629

            Impact Fees,
             $8,672,259                                    Franchise Fees,
                                                             $5,652,000
Other, $12,660,832

                                                           User Fees, $29,221,369
 Transfers, $1,821,010

                                                          Intergovernmental,
                                                              $14,145,646

                                                      Licenses & Permits,
                 Ad Valorem Taxes,                        $6,238,776
                   $71,732,579             Other Taxes,
                                           $3,550,000
Total Expenditures/Uses All Funds
$217,591,100 Debt, $6,638,228
Reserves,
$64,269,546
Capital,
$19,262,788
Transfers, $1,821,010
Operating,
$35,933,374
Personnel,
$89,666,154Total Revenues/Sources General Fund
$148,514,250
Carryover, $41,678,329
Other, $1,756,800 Franchise Fees,
$5,652,000
Transfers, $1,121,010
User Fees, $6,916,110
Intergovernmental,
$9,868,646
Licenses & Permits,
$6,238,776
Other Taxes,
Ad Valorem Taxes, $3,550,000
$71,732,579Total Expenditures/Uses General Fund
$148,514,250 Reserves, $39,647,938
Debt, $3,247,862
Transfers, $700,000
Capital,
$5,839,847
Operating,
$26,947,642
Personnel,
$72,130,961Sources of
Uses of Funds
Funds
Where is
The
Use of Budget
FY 2021 Budget
Stabilization
Shortfall $2.2M
Reserves $2.8M
Additional Increase in
Tax Capital/Debt
Svc/Trfs $1.7M
Increase in Other
Revenues $4.2M
Revenue Increase in
Going Personnel &
Operating Costs
Increase in Ad
Valorem $2.4M
Next $5.5M
Year?Significant Budget Factors
American
2022 Rescue Plan
Act
Operating
and
Capital
PersonnelAmerican Rescue Plan Act Signed into law on 3/11/2021 Total distribution to Palm Beach Gardens: $5,857,791 Payable in two equal payments, or tranches: • First payment: received $2,928,895 on 5/20/2021 • Second payment: not earlier than 12 months after date of first payment
American Rescue Plan Act

Cover following expenses incurred 3/3/2021 through
12/31/2024 –
• To respond to the public health emergency, including assistance to
  households, small businesses, and nonprofits, or aid to impacted industries;
• Premium pay for essential workers, or grants to employers that have eligible
  workers who perform essential work;
• Government services to the extent of reductions in revenue due to COVID-19
  relative to revenues collected in the most recent year prior to the emergency
• Make necessary investments in water, sewer, or broadband infrastructure;
What is Allowed Under Reduction in
 Revenue Provision?

Interim Final Rule gives recipients broad latitude to use funds for the
provision of government services to the extent of reduction in revenue

Government services can include, but are not limited to:

 • Maintenance or pay-go funded building of infrastructure; modernization of
   cybersecurity, including hardware, software, and protection of critical infrastructure;
   health services; environmental remediation; school or education services; and police,
   fire, and other public safety services, to the extent of the revenue reduction
 • Does not include debt service; payments to a pension fund; or replenishing financial
   reserves such as budget stabilization, “rainy day”, or similar type reserves
How to Determine Revenue Loss

How is revenue defined?
 • Based on definition of “General Revenue” used in the Census Bureau’s
   concept of “General Revenue from Own Sources” in the Annual Survey of
   State and Local Government Finances
 • Recipients should calculate revenue on an entity-wide basis
 • General Revenue includes revenue from taxes, current charges, and
   miscellaneous general revenue. It excludes refunds and other correcting
   transactions, proceeds from debt or sale of investments, agency or private
   trust transactions, and revenue generated by utilities and insurance trusts.
 • Includes transfers between state and local governments, but excludes
   transfers from the Federal government
How to Determine Revenue Loss

What is the formula for calculating the reduction in revenue?
 • Start with revenues from last full year prior to pandemic (FY 2019), which is
   the Base Year
 • Calculate a hypothetical 12-month revenue had pandemic not occurred as of
   December 31, 2020, December 31, 2021, December 31, 2022, and
   December 31, 2023; referred to as “Counterfactual Revenue”
 • Base Year * [(1 + growth adjustment) ^ (n/12)] where n is the number of
   months elapsed since the end of the base year to the calculation date, and
   the growth adjustment is the greater of 4.1 percent or the actual average
   annual revenue growth in the three full fiscal years prior to the pandemic
How to Determine Revenue Loss

What is the formula for calculating the reduction in revenue?
 • In our case, the actual average annual revenue growth rate was 8.47% for
   the three prior years
 • Compare hypothetical revenue to actual revenue
Calculation of Loss
                                                 12/31/2020          12/31/2021         12/31/2022      12/31/2023

FYE 9/30/2019 actual          $113,710,654
revenue (Base Year)
Number of months from                                15                   27                 39             51
9/30/2019
Hypothetical revenue                              $125,874,630        $136,536,211       $148,100,829   $160,644,969

Actual 12 months’                                   123,760,906
revenue
Revenue Loss                                         $2,113,724

   **Above calculations are based on staff’s interpretation of most recent U.S. Treasury guidance and
   are subject to review by auditors and further review by U.S. Treasury of future required reports
Allocation of First Payment Total Disbursement 5/20/2021 $ 2,928,895 Allocation of First Payment: Available for Government Services 2,113,724 Restricted for Other American Rescue Plan Uses (1) 815,171 Total First Payment $ 2,928,895 (1) We anticipate future revenue loss calculations will allow this amount and next year’s second disbursement to be used for government services ($815,171 + $2,928,895 = $3,744,066)
Personnel
                                Health/Life
                  Retirement
                                   Ins

                                              Workers’
       Salaries
                          Personnel            Comp
                           Costs up
                            $3.9M
Personnel
Personnel
                                      PBA Collective
                                  Bargaining Agreement

                                     IAFF Collective
                                  Bargaining Agreement
       Salaries $47.8 million –
           up $1.6 million           SEIU Collective
                                  Bargaining Agreement

                                   General Employee
                                   Market Adjustment
Personnel Pensions: Full funding per actuarial Positions: Total 550 FT (up 11) valuations for Police and Fire pension Per 1,000 population: plans and statutory rates for FRS - total FY 2007 (514 positions) 10.41 $11.9 million ($1.2 million increase) FY 2022 (550 positions) 9.70
Personnel

   Budget includes 11 requested new full-time
   positions:
       One Police Officer to provide additional
       support to the Traffic Unit

       One Fire Plans Examiner to keep up with
       pace of new development projects

       One EVT Mechanic to provide additional in-
       house maintenance on fire-rescue apparatus
Personnel
One Director of Mobility to lead, coordinate, and
implement transportation capital improvement
program including mobility and transit
Seven new positions in the Golf Course Special
Revenue Fund due to the addition of a new
course: One First Assistant Golf Course
Superintendent; One Golf Shop Manager; One
Golf Maintenance Supervisor; Two Golf
Operations Coordinators; One First Assistant Golf
Professional; One Administrative Assistant IIIPersonnel
Personnel

            Health/Life/Dental costs in the
            General Fund total $8.1 million
            - Increase of $80,000 or only 1% due
            to the positive financial condition of
            Self-Insured Medical Fund
Maintenance, Repair & Operating Costs
Maintenance, Repair & Operating Costs

        $399,600 for parks      $312,000 for repairs and
         irrigation, fencing,    maintenance of various
        netting, sod, court          equipment and
      resurfacing, equipment    structures, including roof
             repairs, etc.      maintenance and painting
Maintenance, Repair & Operating Costs
$185,000 for roadway
$60,000 for parking lot tree trimming and plant
and sidewalk repairs replacementMaintenance, Repair & Operating Costs
$250,000 for annual $250,000 for canal
stormwater repair maintenance and
program dredging programOther Funds
Special Revenue

                  Gas Tax Special Revenue Fund
                  • Projected Revenue             $913,617
                  • Significant Expenditures:
                    • Street/Sidewalk Repairs      500,000
                    • Street Lighting              260,000
                    • FEC Maintenance Contingency 250,000
                    • Various Equipment            121,000
                    • Infrastructure               100,000
                    • Roadway striping              60,000

                   • Reserve Balance              303,353
Special Revenue
Golf Special Revenue Fund
• Projected Revenue $2,617,000
• Projected Expenditures 3,375,184
• Reserve Balance 630,214
• Transfer from General Fund 700,000
Recreation Special Revenue Fund
• Projected Revenues $4,979,456
• Projected Expenditures 6,010,013
• Tennis Revenues 1,750,184
• Tennis Expenditures 1,603,279
• Reserve Balance 436,097Internal Service Funds
Fleet Maintenance Fund
• Projected Revenue $4,510,987
• Projected Expenditures 4,782,697
• Reserve Balance 260,348
Self Insured Health Fund
• Projected Revenues $10,944,566
• Projected Expenditures 11,380,381
• Reserve Balance 7,390,198Capital Projects
Projected Revenue $8,672,259
• Expenditures:
• BRCC improvements 10,000,000
• Sandhill Crane Drive extension 2,000,000
• Improvements to Kyoto Gardens Dr. from
Military Trail to Alternate A1A 500,000
• Holly Dr. pedestrian crossing improvements 350,000
• Improvements to Burns Rd. from Military Trail
to Alternate A1A 150,000
• Improvements at Alternate A1A and Burns Rd. 25,000Ten-Year Financial Forecast
Ten-Year Financial Forecast

   Highlights

   • Maintains operating millage flat at 5.55 through FY 2031
   • No debt service millage
   • Unassigned reserves estimated at $26M in FY 2022
   • Gradual drawdown of unassigned reserves to $25.3M by FY 2027; increasing
     to $26M by FY 2029
   • Exceeds council policy of at least 17% of expenditures every year
   • Budget stabilization reserves estimated at $7M in FY 2021
   • Budget stabilization reserves reduced to zero by FY 2025 but increase to
     $2.5M by FY 2031
Ten-Year Financial Forecast
Reserves (Millions)
Total Millage Rate
5.70 $30
5.65
$20
5.60
$10
5.55
5.50 $0
FY FY FY FY FY FY FY FY FY FY
2022 2023 2024 2025 2026 2027 2028 2029 2030 2031
Budget Stabilization Unassigned Reserves Total MillageComparison of Revenue, Expense and
Reserve Projections From 3 Years Ago to
Actual
Millions 2019 Forecast 2019 Actual 2020 Forecast 2020 Actual 2021 Forecast 2021 Est. Actual
$120,000,000
$100,000,000
$80,000,000
$60,000,000
$40,000,000
$20,000,000
$0
Revenues Expenses Unassigned reserve Budget stabilization reserveComparison of Current 10-Year Reserve
Projection to Prior 2 Years’ 10-Year Projections
35
30
25
Millions
20
15
10
5
0
2020 2021 2022 2023 2024 2025 2026 2027 2028 2029 2030 231
FY 2020 Budget FY 2021 Budget FY 2022 BudgetSummary
Current FY 2022 Projection
• FY 2022 projection very similar to the FY 2021 projection
• Reserves will be reduced as expenditures are incurred to
build and staff a new fire station located at Avenir
• As more units are added to the tax rolls, reserves will start
to be replenished in FY 2028
• Unassigned reserves and budget stabilization are projected
at $26M and $2.5M, respectively, by 9/30/2031Next Steps
Next Meeting
• August 26
Public Hearings
• Additional • September 8
meetings? • September 22
Budget
Oversight Board
prepares report
to CouncilYou can also read