FY2017 Interim Results - November 2016 - FEC
←
→
Page content transcription
If your browser does not render page correctly, please read the page content below
FY2017 Interim Results
     November 2016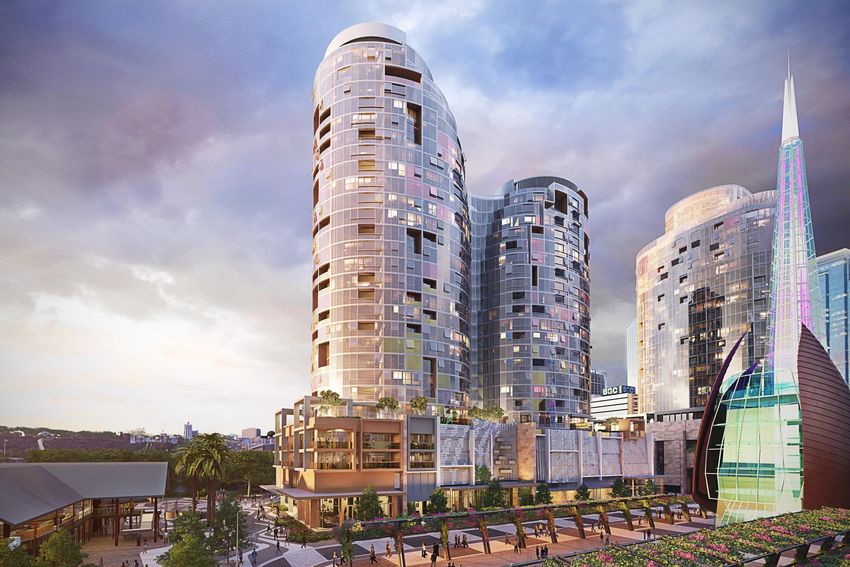
Disclaimer

This document has been prepared by Far East Consortium International Limited (the “Company”) solely for information purposes. By accepting this document, you agree to
maintain absolute confidentiality regarding the information disclosed in this document.
This document does not constitute or form part of and should not be construed as, an offer to sell or issue or the solicitation of an offer to purchase or subscribe securities (the
“Securities”) of the Company or any of its subsidiaries or affiliates in any jurisdiction or an inducement to enter into investment activity. In particular, this document and the
information contained herein are not an offer of the Securities for sale in the United States and are not for publication or distribution to persons in the United States. The document
is being given to you on the basis that you have confirmed your representation that you are not located or resident in the United States and, to the extent you purchase the
Securities described herein you will be doing so pursuant to Regulation S under the United States Securities Act of 1933, as amended (the “Securities Act”).
The information contained in this document has not been independently verified. No representation or warranty, express or implied, is made as to, and no reliance should be
placed on, the fairness, reliability, accuracy, completeness or correctness of such information or opinions contained herein. The presentation should not be regarded by recipients
as a substitute for the exercise of their own judgment. The information contained in this document should be considered in the context of the circumstances prevailing at the time
and has not been, and will not be, updated to reflect material developments which may occur after the date of the presentation. None of the Company nor any of its affiliates,
advisers or representatives accept any liability whatsoever (whether in contract, tort, strict liability or otherwise) for any direct, indirect, incidental, consequential, punitive or special
damages howsoever arising from any use of this document or its contents or otherwise arising in connection with this document.
This document contains statements that reflect the Company’s beliefs and expectations about the future. These forward-looking statements are based on a number of assumptions
about the Company’s operations and factors beyond the Company’s control, and accordingly, actual results may differ materially from these forward-looking statements. The
Company does not undertake to revise forward-looking statements to reflect future events or circumstances.
This presentation includes measures of financial performance which are not a measure of financial performance under HKFRS, such as "EBITDA“ and “adjusted cash profit”.
These measures are presented because the Company believes they are useful measures to determine the Company’s operating cash flow and historical ability to meet debt
service and capital expenditure requirements. "EBITDA" and “adjusted cash profit” should not be considered as an alternative to cash flows from operating activities, a measure of
liquidity or an alternative to net profit or indicators of the Company’s operating performance on any other measure of performance derived in accordance with HKFRS. Because
"EBITDA“ and “adjusted cash profit” are not HKFRS measures, "EBITDA" and “adjusted cash profit” may not be comparable to similarly titled measures presented by other
companies.
This presentation contains no information or material which may result in it being deemed (1) to be a prospectus within the meaning of Section 2(1) of the Companies Ordinance
(Chapter 32 of the laws of Hong Kong), or an advertisement or extract from or abridged version of a prospectus within the meaning of Section 38b of the Companies Ordinance or
an advertisement, invitation or document containing an advertisement or invitation falling within the meaning of Section 103 of the Securities and Futures Ordinance (Chapter 571
of the laws of Hong Kong) or (2) in Hong Kong to have effected an offer to the public without compliance with the laws of Hong Kong or being able to invoke any exemption
available under the laws of Hong Kong and subject to material change.
This document does not constitute a prospectus, notice, circular, brochure or advertisement offering to sell or inviting offers to acquire, purchase or subscribe for any securities in
Hong Kong or calculated to invite such offers or inducing or intended to induce subscription for or purchase of any securities in Hong Kong. This presentation is for distribution in
Hong Kong only to persons who are "professional investors" as defined in Part 1 of Schedule 1 of the Securities and Futures Ordinance (Chapter 571 of the laws of Hong Kong)
and any rules made thereunder and whose ordinary business is to buy and sell shares or debentures, whether as principal or agent.
All rights reserved. This document contains confidential and proprietary information and no part of it may be reproduced, redistributed or passed on, directly or indirectly, to any
other person (whether within or outside your organisation / firm) or published, in whole or in part, for any purpose.
An offering of securities may follow, subject to market conditions.

                                                                                                                                                                                            2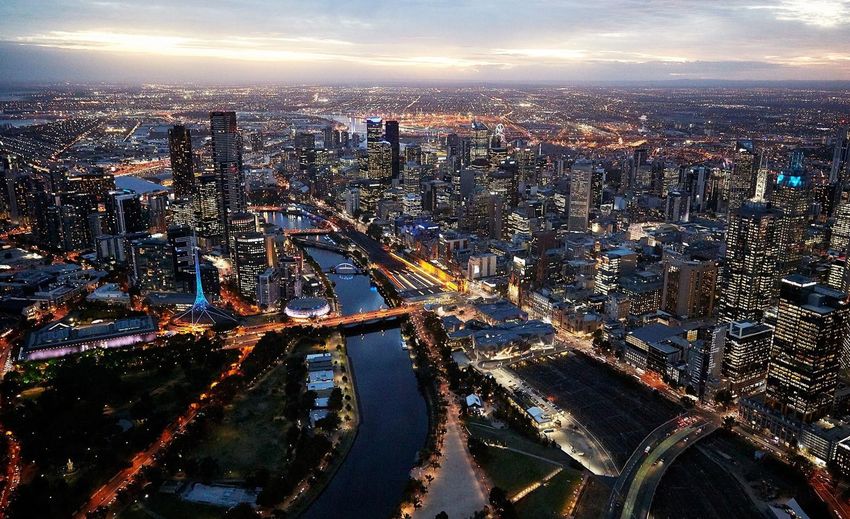
Table of Contents

1.   Key Achievements

2.   FY2017 Interim Results Summary

3.   Review of Operations

4.   Prospects

                                      3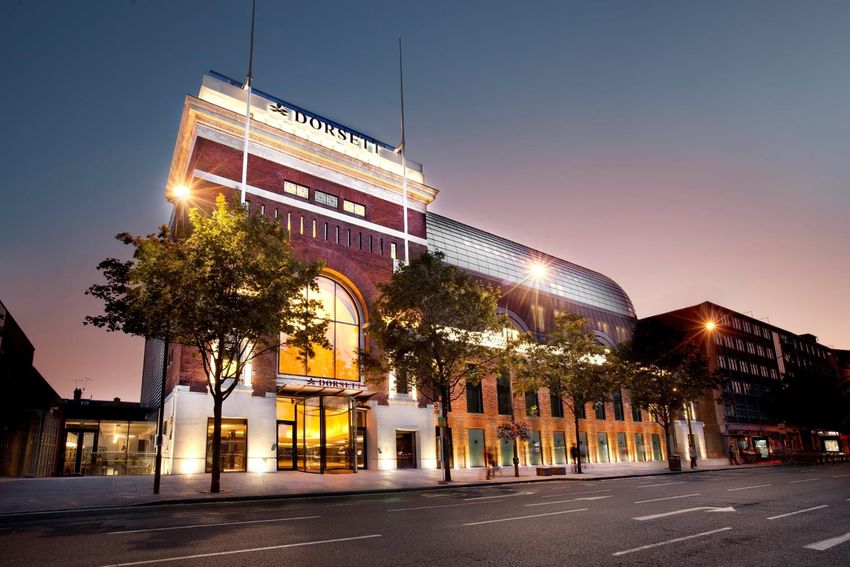
1. Key Achievements

Melbourne CBD                         4
FY2017 Interim Results Highlights
      Record High Half-year                     • Revenue: HK$3bn, +59.0% yoy
       Revenue and Profit                       • Net profit attributable to shareholders: HK$681mn, +158.9% yoy

                                                • Upper West Side Stage 4 Manhattan, Melbourne (641 apartments)
               Projects
                                                • King’s Manor, Shanghai (479 apartments 90 townhouses)
              Completed
                                                • Eivissa Crest(1), Hong Kong (106 apartments)

                                                • Record-high cumulative presales at HK$9.8bn as at 30 September 2016, albeit
        Robust Pre-sales
                                                  recognition of sales or IP disposal amounting to HK$2.6bn during the period

        Recurring Income                        • Hotel business bottoming out with stable revenue
       Businesses Remain
             Stable                             • Car park division recorded 3.3% growth in revenue

                                                • Successfully issued USD debut notes raising US$300mn at 3.75% p.a.
                                                • Cash and investment securities amounted to HK$5.4bn providing strong ammunition to
         Strong Financial                         support growth
             Position                           • Net gearing(2) remained at a healthy level of 31.6% as at 30 September 2016, albeit
                                                  US$300mn notes issue (37.7% as at 31 March 2016)
                                                • Interim dividend increased to HK3.5 cents per share (1HFY2016: HK 3 cents per share)
(1)    Booked as disposal of investment properties
(2)    Net gearing ratio is calculated by dividing total bank loans, notes and bonds less bank and cash balances and investment securities by the carrying amount of total equity
       and the unrecognised revaluation surplus on hotel assets.
                                                                                                                                                                                    5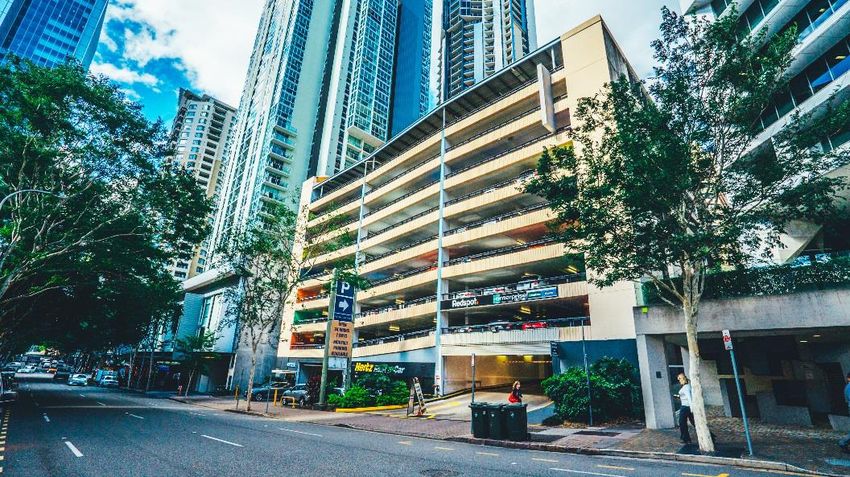
FY2017 Interim Financial Highlights

                                                                                                 1HFY2017                       1HFY2016            YoY change

Revenue (HK$ M)                                                                                          2,953                          1,857               +59.0%

Gross profit (HK$ M)                                                                                     1,109                             629              +76.4%

Net profit attributable to shareholders (HK$ M)                                                            681                             263            +158.9%

EPS (HK cents)

- Basic                                                                                                   32.0                            13.7            +133.6%

- Fully diluted                                                                                           32.0                            13.7            +133.6%

Dividend per share (HK cents)

- Interim                                                                                                   3.5                             3.0               16.7%

                                                                                         As at 30.9.2016                 As at 31.3.2016

Total cumulative presale (HK$ M)                                                                         9,767                          7,517               +29.9%

Net asset value attributable to shareholders (HK$ M)                                                   10,291                         10,140                  +1.5%

Group cash and investment securities (HK$ M)                                                             5,422                          3,750               +44.6%
                        (1)
Net gearing ratio                                                                                       31.6%                           37.7%             - 6.1 ppts

  (1)   Total bank loans, notes and bonds less investment securities, bank and cash balances divided by carrying amount of total equity and hotel revaluation surplus

                                                                                                                                                                        6
Business Highlights
                        •   Angel Meadow at NOMA, Manchester (600 apartments)
  New Residential/      •   Perth City Link, Perth (350 apartments, 250 hotel rooms)
 Mixed-use Projects
     Acquired           •   Hornsey Town Hall re-development, London (Residential + Retail, preferred proponent)
                        •   Pyrmont, Sydney and Jupiters, Gold Coast (MOUs signed with The Star and CTF)

                        • Queen’s Wharf Casino License Granted in October 2016
                        • Planning approval of Alpha Square, London obtained in May 2016
 Update on Existing
     Projects           • Projects Launched: West Side Place (Tower 1 & 2) at Melbourne, The Royal Crest
                          II and King’s Manor (townhouses) at Shanghai, Royal Riverside (Tower 1 & 4) at
                          Guangzhou

   Hotel Business       • Hong Kong hotel business stabilised (1HFY2017 OCC: 87.2%; up 1.5 ppts YoY)
 Stabilised with New    • 2 hotels to be opened within 6 months (Approx. 700 rooms)
  Hotels in Pipeline    • Signed agreement to acquire Sheraton Mirage, Gold Coast (JV with The Star and CTF)

                        • Acquired car parks at Brisbane
 Car Park Business      • Completion of central monitoring system
 Continues to Grow      • Managed 399 car parks with approx. 76,200 bays as at 30 September 2016 (+5,200
                          bays compared with 31 March 2016)

                        • Won numerous international awards in relation to company management, investor
Corporate Recognition     relations, corporate governance and corporate social responsibility
                        • Awarded Euromoney’s "Best Managed Company in Asia” (Real-Estate Category)
                                                                                                             7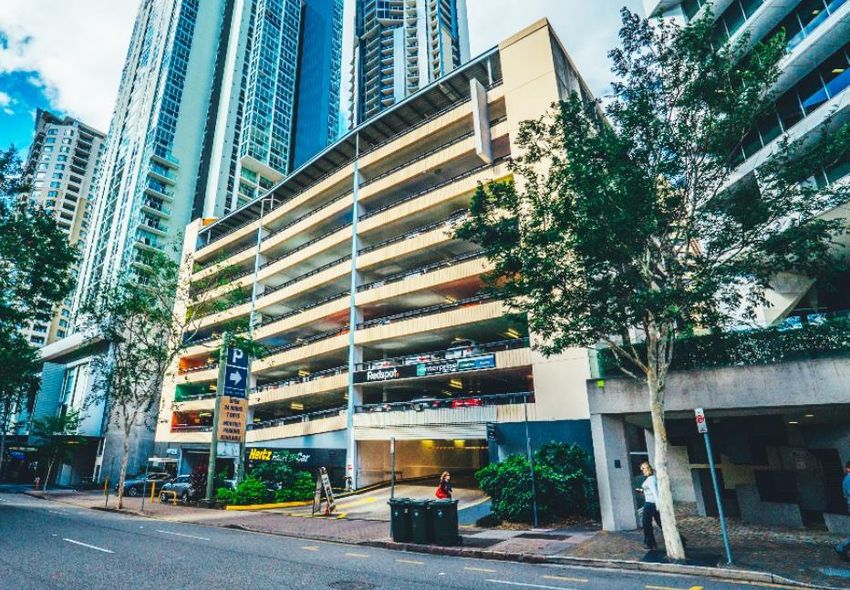
New Residential/Mixed-use Pipeline
Perth City Link, Perth, Australia
- 350 apartments and 250 hotel rooms
Angel Meadow Site at NOMA, Manchester,
the United Kingdom
- 600 apartments
Hornsey Town Hall redevelopment, London
Perth City Link, Perth, Australia
- Expected 96,000 sq. ft. net sellable area of
residential units
Angel Meadow, Manchester, the United Kingdom Hornsey Town Hall, London, the United Kingdom
8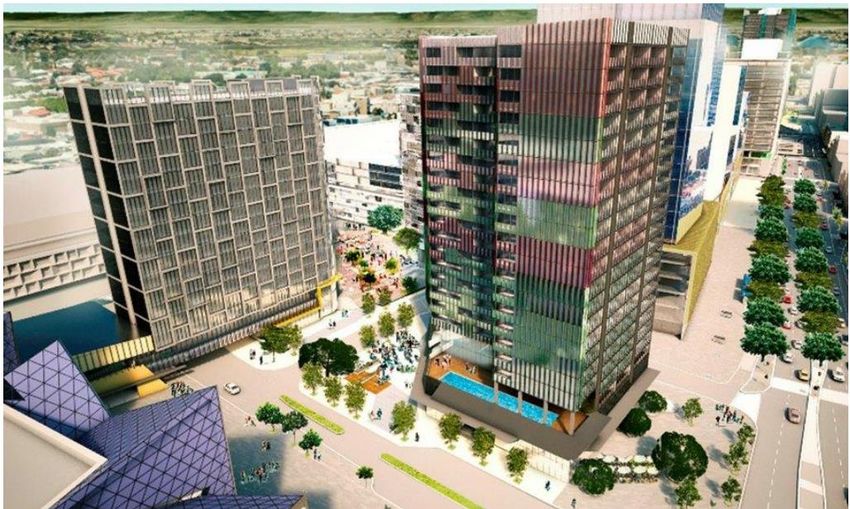
JV with the Star and CTF
New JV MOUs with The Star and CTF signed to
develop The Star casino sites in Sydney and Gold
Coast, with planning approval in progress
Substantial residential development opportunities
Hotel additions in prime locations will add to
Pyrmont, Sydney
recurring cashflow
Jupiters, Gold Coast
9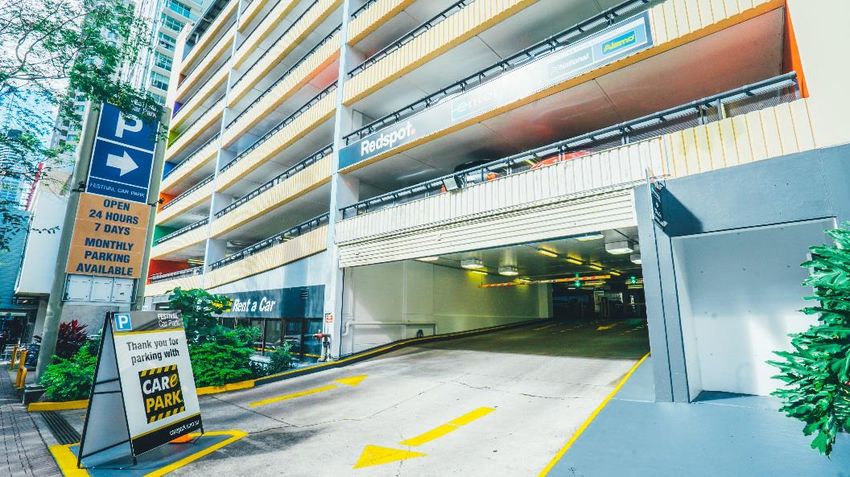
Sheraton Mirage – Gold Coast
Consortium partners (FEC, the Star & CTF) in
process of acquiring Sheraton Mirage – Gold
Coast
Addition of this beach front property will add to
tourism offering and complement Queen’s
Wharf Brisbane as a satellite hotel
Property facilities include 295 rooms and suites,
a swimming pool, fitness centre, spa facilities
and surrounding beach
Surplus land provides room for expansion,
subject to planning
Sheraton Mirage, Gold Coast
102. FY 2017 Interim
Results Summary
Melbourne night view, Australia
11Well Balanced Diversified Portfolio
Business diversification allows FEC to take advantage of property cycles in different countries
Total Assets by Geographies(1) Total Assets by Business Segments(1)
Treasury &
United others(2) Car park
Kingdom (located in operations &
5% Hong Kong) facilities
Malaysia 14% management
6%
Property 2%
development
28% Property
investment
Australia & 6%
New Zealand
8% Hong Kong Treasury &
40% others
Singapore Hotel
14%
11% Mainland operations &
China management
16% 50%
Total Revenue by Geographies Total Revenue by Business Segment
Hong Kong
12% Malaysia Singapore
4% 2%
United Hotel
Kingdom operations &
2% management Car park
21% operations &
Property
development facilities
66% management
Mainland
Australia & 11%
China
New Zealand Property
20%
60% investment
Treasury & 1%
others(2)
1%
Notes: (1) As at 30 September 2016, adjusted for hotel revaluation surplus
(2) Includes financial product investments and other operations
12GP Margin Expanded with Top Line Growth
1HFY2017 1HFY2016
Gross profit Gross profit Gross profit Gross profit
Revenue (before (after Revenue (before (after
depreciation) depreciation) depreciation) depreciation)
HK$ M HK$ M % HK$ M % HK$ M HK$ M % HK$ M %
Sales of properties 1,960 766 39.1% 766 39.1% 889 299 33.6% 299 33.6%
Hotel operations and
616 370 60.0% 233 37.8% 622 381 61.3% 240 38.6%
management
Car park operations and
309 67 21.7% 57 18.4% 299 66 22.2% 57 19.1%
facililties management
Leasing and others 66 53 80.2% 53 80.2% 47 33 70.1% 33 70.1%
2,953 1,256 42.5% 1,109 37.5% 1,857 779 42.0% 629 33.8%
13Strong USD in Group’s Favour during Expansion Phase
Contributions from the Group’s non-Hong Kong operations were affected by the
movement of foreign currencies against Hong Kong dollar
The impact of such currency movement to the Group’s results for 1H FY2017 was
less than that for 1H FY2016
Net profit would have been HK$7m higher assuming constant exchange rates
Strong USD in the Group’s favour as it seeks overseas expansion
Rates as at 30.9.2016 31.3.2016 % change
HK$/AUD 5.90 5.93 -0.5%
HK$/RMB 1.16 1.20 -3.3%
HK$/MYR 1.87 1.97 -5.1%
HK$/GBP 10.02 11.12 -9.9%
HK$/SGD 5.67 5.74 -1.2%
Average rates for 1HFY2017 1HFY2016 % change
HK$/AUD 5.92 5.67 4.4%
HK$/RMB 1.18 1.24 -4.8%
HK$/MYR 1.92 1.92 0.0%
HK$/GBP 10.57 11.59 -8.8%
HK$/SGD 5.71 5.53 3.3%
14Share Price Supported by Strong NAV Backing
Net asset value per share As at 30.9.2016 As at 31.3.2016
(HK$M) (HK$M)
Equity attributable to shareholders of the Company 10,291 10,140
Add: Hotel revaluation surplus 10,732 10,732
Adjusted net asset value 21,023 20,872
No. of shares issued (million) 2,132 2,132
Adjusted net asset value per share (HK$) 9.86 9.79
15Reliable Return to Shareholders
FY2009 FY2010 FY2011 FY2012 FY2013 FY2014 FY2015 FY2016 CAGR 1HFY2017
Period-end NAV/share(1) (HK$) 4.73 5.84 6.00 6.70 8.45 9.12 9.02 9.79 11% 9.86
Basic EPS (HK cents) 5 18 21 23 50 51 51 37 33% 32
Diluted EPS (HK cents) 2 18 21 23 50 51 51 36 51% 32
Dividend
Total dividend per share (HK cents) 3 6 7 6 13 15 16 16 27% -
Interim 1 2 2 1 2 3 3 3 n/a 3.5
Final 2 4 5 5 11 12 13 13 n/a -
Payout ratio 56.6% 33.3% 33.3% 26.1% 26.0% 29.4% 31.4% 43.2% n/a -
Share Buyback
No. of share buyback (million) 12.4 2.25 1.82 230 n/a n/a n/a 29.6 n/a n/a
Value of share buyback (HK$M) 26.04 5.12 4.15 283 n/a n/a n/a 81.7 n/a n/a
(1) Adjusted for hotel revaluation surplus
16Substantial War Chest to Drive Future Growth
Presales HK$9.8bn provides clear visibility of cash flow stream
War chest can be enhanced by leveraging unencumbered hotels
War chest HK$ M
Group cash and liquidity @ 30.9.2016 5,422
Undrawn banking facilities - Corporate use 2,800
Undrawn banking facilities - Construction Development 2,200
Total war chest (excluding cashflow from presales) 10,422
Market value of hotel @ 31 March 2016 Number HK$ M
Unencumbered hotel assets 8 3,000
Application of funds HK$ M
Queen's Wharf integrated resort 1,140
Cumulative Settled 37
To be settled in 2HFY2017 (1) 318
To be settled in FY2018 173
To be settled in FY2019 and therafter 613
Queen's Wharf residential land premium 192
To be settled in 2HFY2017(2) 192
Capex (committed @ 30.9.2016) 258
Expected total capex 1,554
(1) Approx. HK$250m was paid in October 2016
(2) Settled in October 2016
17Solid Balance Sheet to Support Future Growth
Debt maturity profile
Due more than 5 Due within 1 year
years 10%
As at As at 3%
30.9.2016 31.3.2016 Due 1- 2
years
HK$ M HK$ M 14%
(1)
Bank loans, notes and bonds
Due within 1 year 1,258 1,864 Due 2- 5
years
Due 1-2 years 1,708 1,691 73%
Due 2-5 years 8,780 7,198
Due more than 5 years 355 920
Debt mix by business
Total bank loans, notes and bonds 12,101 11,673
Property
Investment securities 1,087 1,219 FEC notes/bonds and development and
unsecured bank loans investment
Bank and cash balances 4,335 2,531 22%
34%
Liquidity position 5,422 3,750
(2)
Net debts 6,679 7,923
Carrying amount of the total equity 10,429 10,267
Add: hotel revaluation surplus 10,732 10,732 Car park operations and Hotel operations and
facilities management management
Total equity adjusting for hotel revaluation surplus 21,161 20,999 3% 41%
Net gearing ratio (net debts to adjusted equity) 31.6% 37.7%
Debt mix by currencies
Successfully issued 5-year 3.75% US$300M Notes in September 2016, MYR
extending average debt duration GBP 2%
CNY
4%
8%
Policy is to use local currency debt to support local development
SGD
(1) The borrowings in the Company’s consolidated statement of financial position include an amount of approximately 18%
HK$725mn reflected as current liabilities even though such sum is not repayable within one year, as the banks and/or AUD HKD
financial institutions have discretionary rights to demand immediate repayment. There has been no demands for 6% 36%
immediate repayment from any bank and/or financial institution USD
(2) Net debt represents total bank loans, notes and bonds less bank and cash balances, and investment securities 26% 18Strong Credit Matrix
Liquidity Position and Total Assets Net Gearing (2)
HK$ million
26,161 26,893
22,216 37.7%
29.8% 31.6%
3,750 5,422
3,487
As at 31.3.2015 As at 31.3.2016 As at 30.9.2016 As at 31.3.2015 As at 31.3.2016 As at 30.9.2016
(1)
Cash & investment securities Total Assets
Secured and Unsecured Borrowings Mix EBITDA(3) / Finance Costs(4)
Unsecured Secured 11.2x
8.2x
6.7x
59.4%
72.9% 77.6%
40.6%
27.1% 22.4%
As at 31.3.2015 As at 31.3.2016 As at 30.9.2016 FY2015 FY2016 1HFY2017
Notes: (1) Includes restricted bank deposits, deposit in a financial institution and investment securities. Investment securities mainly represents fixed income investments
(2) Net gearing ratio is calculated by dividing total bank loans, notes and bonds less bank and cash balances, and investment securities by the carrying amount of total equity and the unrecognised revaluation
surplus on hotel assets.
(3) EBITDA is defined as: profit before taxation + finance costs + depreciation and amortisation. EBITDA includes gains on disposals
(4) Finance costs does not include amounts capitalised for properties under development
. 19Proven Track Record
As at and for the year/period ended
1H
(In HK$m) FY2009 FY2010 FY2011 FY2012 FY2013 FY2014 FY2015 FY2016 CAGR
FY2017
Revenue 1,733 2,342 1,654 1,761 3,732 4,066 5,110 3,995 13% 2,953
Sales of properties 951 1,376 245 46 1,946 1,589 2,962 1,979 11% 1,960
Hotel operations and management 679 616 867 1,096 1,153 1,785 1,454 1,321 10% 616
Car park operations n/a 279 464 537 567 613 616 623 14% 309
Gross profit 728 799 756 848 1,027 1,553 1,946 1,706 13% 1,109
Profit before tax 222 493 555 718 1,024 1,246 1,328 979 24% 921
Profit after tax 105 358 446 615 1,078 1,026 998 758 33% 688
Adjusted cash profit (1) 165 238 176 423 735 890 836 853 27% 645
Net profit attributable to shareholders 86 324 394 448 903 914 957 734 36% 681
Net assets value attributable to shareholders 4,744 6,126 7,027 7,452 8,013 8,750 9,144 10,140 11% 10,291
Net assets value attributable to shareholders
7,671 11,126 11,397 13,117 14,942 16,864 17,263 20,872 15% 21,023
(adjusting for hotel revaluation surplus)
(1) Adjusted cash profit is calculated by adding depreciation and amortisation charges to, and subtracting fair value gain in investment
properties from net profit attributable to shareholders of the Company. The amount is adjusted for minority interests.
203. Review of Operations
Property Development
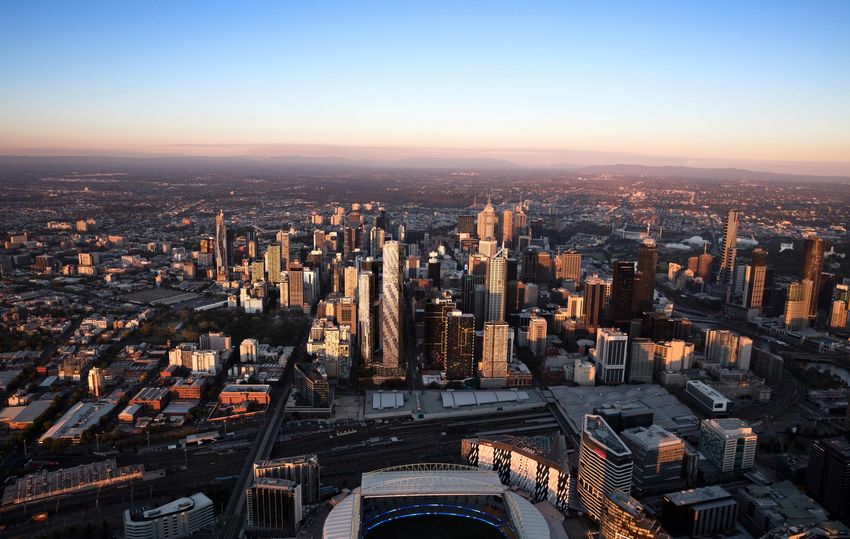
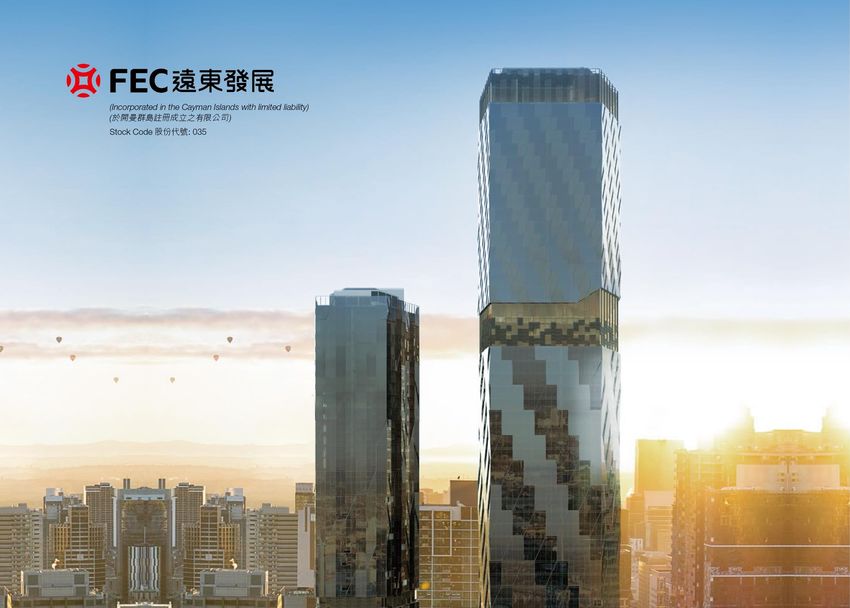
West Side Place & Upper West Side, Melbourne 21Strong Pipeline for Sustainable Growth
Expected Expected
Cumulative attributable attributable Expected Cumulative presale
Projects under presale Location presales SFA(1) GDV(1) completion(2) as % of GDV
@30.9.2016 (HK$ M) (sq. ft.) (HK$ M) %
1 Aspen Crest Hong Kong 989 64,000 1,069 FY2019 93%
2 UWS stage 4 - Manhattan(3) Melbourne 364 85,000 364 FY2017 100%
3 The FIFTH Melbourne 1,218 284,000 1,218 FY2018 100%
4 West Side Place (Tower 1&2) Melbourne 3,378 1,072,000 5,573 FY2021 61%
5 The Towers at Elizabeth Quay Perth 1,626 320,000 2,719 FY2019 60%
6 King's Manor (remaining) Shanghai 841 284,000 1,249 FY2017 67%
7 The Royal Crest II Shanghai 806 259,000 1,404 FY2018 57%
8 Dorsett Bukit Bintang Kuala Lumpur 305 215,000 790 FY2017/18 39%
9a Royal Riverside (Towers 1, 2 and 4) Guangzhou 240 391,000 1,159 FY2018 21%
Total presales value 9,767 2,974,000 15,545 63%
Other active development pipeline
Expected Expected
Expected presale attributable attributable Expected
Active Projects Location launch time(1) SFA(1) GDV(1) completion(2)
(sq. ft.) (HK$ M)
9b Royal Riverside (Towers 3 & 5) Hong Kong FY2018 292,000 906 FY2018
10 Tan Kwai Tsuen Hong Kong FY2017/18 51,000 581 FY2017/18
11 Sha Tau Kok Hong Kong Planning 99,000 994 FY2019
12 Tai Wai Hong Kong Planning 33,000 440 FY2019/20
13 Sham Shui Po Hong Kong Planning 28,000 400 FY2019/20
14 Shatin Heights Hong Kong Planning 70,000 1,200 Planning
15 Tower 3 FY2018 400,000 2,093 Planning
West Side Place Melbourne
16 Tower 4 Planning 576,000 3,013 Planning
(4)
Tower 4 Planning 259,000 1,421 Planning
Queen's Wharf
17 Tower 5 Brisbane Planning 236,000 1,410 Planning
(residential)
Tower 6 Planning 211,000 1,263 Planning
18 Perth City Link Perth Planning 188,000 986 Planning
19 Alpha Square London FY2018/19 388,000 3,887 Planning
20 Angel Meadow at NOMA Manchester FY2018/19 425,000 1,490 Planning
21 Alexandra View(5) Singapore FY2018 290,000 2,805 Planning
Sub total (pipeline) 3,546,000 22,889
Total (presales+ pipeline) 6,520,000 38,434
(1) Approximate saleable residential floor areas and expected gross development value may vary subject to finalization of development plans
(2) Expected completion and launch time may vary which subject to construction program and relevant authority permits obtained
(3) Represents remaining units awaiting settlement
(4) The Group has 50% interest in the development
(5) The Group has 70% interest in the development 22Casino License Granted in October 2016
Investment Plan Residential Component (Approx., subject to planning)
Total FEC Portion Expected SFA Expected GDV
FEC’s Stake Component
(A$ million) (A$ million) (sq.m.) (A$ million)
Total investment of IR (100%) 1,930 n/a n/a
Tower 4 48,200 480
Bank financing of IR (60%) 1,157 n/a n/a
Tower 5 43,800 480
Equity portion of IR (40%) 773 25% 193
Tower 6 39,200 430
Land premium for the
65 50% 33
residential component
Total 131,200 1,390
FEC total capital
226
commitment FEC has 50% stake of the residential component
Casino Licence Term
- 99 years with a 25 year casino exclusivity period within 60 kilometers from the Brisbane CBD
- Gaming tax rates consistent with current levels
- Maximum approved electronic gaming machines of 2,500
- Unlimited gaming tables (including electronic derivations)
By FY2022
FY2017 FY2020 FY2024
Completion of integrated resort
Construction Launch presale of Completion of residential
Commence residential tower 5 Completion of residential tower 4 tower 6
FY2019 FY2021 FY2023
Launch Launch presale of Completion of
presale of residential tower 6 residential tower 5
residential
tower 4
23Details of Investment Properties
Attributable
Current Investment Properties GFA Pipeline Investment Properties GFA
(sq. ft.) (sq. ft.)
(1) The FIFTH, Melbourne 3,200
FEC Building, Central, Hong Kong 16,000
FEC Building, Nathan Road, Hong Kong(1) 38,000 West Side Place, Melbourne 84,000
Basement to 5th floor, Silka Far East Hotel, Elizabeth Quay, Perth 18,000
38,000
Tsuen Wan, Hong Kong Aspen Crest, Hong Kong 12,000
Tsuen Wan Garden, Hong Kong 41,000 Sha Tau Kok, Hong Kong 6,700
Xintiandi Shopping Mall, California Garden, Shanghai 250,000 Tai Wai, Hong Kong 5,800
Rebecca Walk, Melbourne 8,700 Sham Shui Po, Hong Kong 4,400
Alpha Sqaure, London 6,000
Upper West Side Stage 1 - 4, Melbourne 30,100
Queen’s Wharf Brisbane (2) 100,000
Star Ruby, Hong Kong 10,000 (3)
Alexandra View, Singapore 14,000
Wuhan Shopping Mall 423,000
Total 254,100
Dorsett, Singapore 7,000
Dorsett, Shanghai 19,000 (1) All investment properties are retail except (1) which are offices
(2) FEC owns 25% stake of this project
Total 880,800 (3) FEC owns 70% stake of this project
243. Review of Operations
Hotel operations and
management
Dorsett Shepherds Bush, London
25Steady Overall with Hong Kong Bottoming Out
1HFY2017 1HFY2016
Hong Kong • Hong Kong operation stablising with signs of
Occupancy rate (i)
87.2% 85.7% recovery
(i)
Average room rate (HK$) 632 679
RevPAR (HK$) (i)
551 582 • Hotel performance in Malaysia and
Malaysia Singapore were stable
Occupancy rate 68.3% 66.2%
Average room rate (HK$) 360 364 • In Mainland China, significant performance
RevPAR (HK$) 246 241
seen at Dorsett Grand Chengdu and Dorsett
Mainland China
Shanghai
Occupancy rate 59.7% 51.1%
Average room rate (HK$) 489 528
• Weaker Sterling likely to boost UK’s tourism
RevPAR (HK$) 292 270
industry, creating favorable hotel operating
Singapore
environment in London
Occupancy rate 79.5% 80.9%
Average room rate (HK$) 1,070 1,057
RevPAR (HK$) 851 855
• Currency movement will continue to have an
United Kingdom
impact on HK$ RevPAR
Occupancy rate 89.4% 90.0%
Average room rate (HK$) 1,075 1,136
RevPAR (HK$) 962 1,022
Group Total
Occupancy rate 76.2% 73.2%
Average room rate (HK$) 599 641
RevPAR (HK$) 456 469
Note:
(i) Included only hotels owned by the Group. RevPAR = Occupancy rate x average room rate
26Clear Pipeline for Mid-term Room Growth
No. of rooms
10,000
Approximately 6,000 rooms as at 30 September 2016 9,000
9,316
7,567 7,830
7,363 7,567
13(1) owned hotels in the development pipeline in next 8,000
6,722
7,000
6,043 6,043
6 years 6,000 5,429
5,000 4,894
Approx. 700 new rooms expected in FY2017 upon the 3,834 3,901
4,000
opening of two hotels in Hong Kong and London 3,000 2,980 2,956
2,000 1,549 1,549
1,000 1,309
0
FY17F
FY18F
FY19F
FY20F
FY21F
FY22F
FY06A
FY07A
FY08A
FY09A
FY10A
FY11A
FY12A
FY13A
FY14A
FY15A
FY16A
Pursue of “Chinese Wallet” – A More Balanced Portfolio
Owned and Operating Rooms Owned and Operating Rooms Hotels in Development Pipeline
as at 30.9.2016 by 2022 Number
(6,043 rooms) (9,316 rooms) of Hotel Location No. of rooms
(2)
Hotel operators
(3)
Mainland Singapore
Malaysia 1 Hong Kong 409
to be managed by Dorsett
China 285
Malaysia 1,557 Mainland 1 Kuala Lumpur 150
to be managed by Dorsett
1,434 3%
1,407 17% China
24% UK 1 Mainland China 416
to be managed by Dorsett
23% 1,850
20% 893 3 London 576
to be managed by Dorsett
10% 1 Melbourne 263
to be managed by Ritz Carlton
Hong Kong to be managed by Dorsett and
2,600 Australia 2 Perth 455
Singapore Hong Kong Ritz Carlton respectively
43% 3,009 1,722
285 to be managed by Dorsett and
UK 5% 32% 18% 4 Brisbane(4) 1,004
other brand operators
317
5% 13 3,273
(1) Does not included Hornsey Town Hall redevelopment and Sheraton Mirage
(2) Number of rooms may change, subject to planning approval and finalization of the master and building plan
(3) Hotel operators may change, subject to finalization of the operating agreement and other terms
(4) Part of Queen’s Wharf Brisbane, in which the Group has 25% interest (the integrated resort component). Other than Ritz Carlton Hotel (owned by
The Star) 4 hotels with 1,004 rooms will be built in this component
27Continuous Improvements to Hotels with
Proactive Marketing Initiatives
Hotel upgrades to prepare for expected upturn in HK tourism
- Cosmopolitan Hotel, Hong Kong rebranded as Dorsett Wanchai Hong Kong
- Silka Far East Hong Kong, with all 240 guest rooms fully renovated
Diversify customer sources
- e.g. Korea, Japan, South East Asia, Australia, Europe and US
Dorsett Wanchai Hong Kong
28Silka Tsuen Wan, Hong Kong – Opening Soon
- A new build hotel development in Tsuen Wan,
Hong Kong
- 157,066 sq.ft. with 409 bedroom 3-star
business hotel
29Dorsett City – A New Pearl in the City of London
- A new build hotel development in Aldgate, City of
London
- 103,000 sq. ft. 13-storey (basement + 12 storey)
270 bedroom 4-star business hotel
- 253 guests rooms, 17 guest suites
- Restaurants, executive lounge, fitness centre,
meeting rooms, and a roof top bar with views over
the City of London
30Substantial Development Profit Not Yet Recognised
Capital Value Book Value Revaluation
City Description Rooms @ 31.3.2016 @ 31.3.2016 Surplus
(HK$ M) (HK$ M) (HK$ M)
Hotels in operation
Hong Kong
1 Dorsett Wanchai Hong Kong Near Wanchai and Causeway Bay 454 2,543 348 2,195
2 Silka West Kowloon Hong Kong Booming new city in Hong Kong 141 394 109 285
3 Cosmo Hotel Hong Kong Hong Kong's prime business area 142 664 124 540
4 Lan Kwai Fong Hotel @ Kau U Fong Hong Kong CBD & premiere dining and entertainment zone 162 1,000 177 823
5 Silka Seaview Hong Kong Close to Yau Ma Tei station next to Jade market 268 880 398 482
6 Silka Far East Hong Kong Easy access to commercial hubs of Central & TST 240 634 139 495
7 Dorsett Mongkok Hong Kong Shopping neighbourhood of Mong Kok 285 1,063 237 826
8 Dorsett Kwun Tong Hong Kong Located in the heart of Hong Kong East 361 1,063 316 747
9 Dorsett Tsuen Wan Hong Kong Easy access to airport 547 1,401 898 503
Malaysia
10 Dorsett Kuala Lumpur Kuala Lumpur Heart of Kuala Lumpur's Golden Triangle 320 303 101 202
11 Dorsett Grand Subang Subang Jaya Commercial hub of Subang Jaya 478 691 236 455
12 Dorsett Grand Labuan Labuan Revitalised business district of Labuan 178 329 92 237
13 Silka Maytower Hotel & Serviced Residences Kuala Lumpur Central Kuala Lumpur 179 162 173 (11)
14 Silka Johor Bahru Johor Gateway between Singapore and Malaysia 252 158 113 45
Mainland China
15 Dorsett Wuhan Wuhan Heart of downtown 317 952 619 333
16 Dorsett Shanghai Shanghai Heart of Pudong 264 578 335 243
17 Dorsett Grand Chengdu Chengdu Famous historical Luoma Market 556 972 455 517
18 Lushan Resort Lushan Well known toutrist destination 297 228 209 19
Singapore
19 Dorsett Singapore Singapore Singapore's CBD 285 1,492 622 870
United Kingdom
Close to Westfield Shopping Centre, Earls Court and Olympia
20 Dorsett Shepherds Bush London 317 805 527 278
Exhibition Centres
6,043 16,312 6,228 10,084
Owned hotels under development
21 Silka Tsuen Wan Hong Kong Densely populated Kwai Chung district 409 638 430 208
22 Dorsett Zhongshan Zhongshan Heart of the business district 416 264 125 139
23 Dorsett City London Situated above the Aldgate tube station 270 591 320 271
Close to Westfield Shopping Centre, Earls Court and Olympia
24 Dorsett Shepherd's Bush II London 75 129 99 30
Exhibition Centres
25 - 28 Destination Brisbane Consortium* Brisbane 4 world class hotels including Dorsett and Rosewood 1,004 n/a n/a n/a
Part of mixed-used development including private and
29 Alpha Square London 231 n/a n/a n/a
affordable residential units, school, health centre and retail unit
Occupies the top 18 floors of the West Side Place (Tower 1)
30 Ritz Carlton Hotel Melbourne 263 n/a n/a n/a
with the hotel reception and restaurant at the top of the tower
“The Ritz-Carlton, Perth”, which is part of the iconic luxury
31 Ritz Carlton Hotel Perth 205 n/a n/a n/a
chain of Ritz-Carlton hotels and resorts
32 Dorsett at Perth City Link Perth n/a 250 n/a n/a n/a
33 Sri Jati Service Apartment Kuala Lumpur n/a 150 n/a n/a n/a
Total as at 31.3.2016 9,316 17,934 7,201 10,732
* Part of Queen’s Wharf Brisbane, in which the Group has 25% interests
Revaluation surplus of HK$10.7bn in hotel portfolio as at 31.3.2016
Group evaluating strategy to sell non-core hotel assets
Cash generated will be used as capital for other development projects 313. Review of Operations
Car park operations
and facilities management
Festival Car Park, Brisbane 32Steady Cash Flow with Constant Growth
Steady growth of portfolio continued with approx. 5,200 car park bays
added in 1HFY17
Regional expansion envisaged, with UK and SE Asia the next frontier
Upgrade of central monitoring system enables better control of day-to-day
operations, bringing in efficiency gains as portfolio continues to grow
As at 30 September 2016 As at 31 March 2016
No. of No. of
Car Park
No. of Bays
Car Park
No. of Bays Car Park Revenue
Australia HK$ million
Owned and managed 19 3,521 19 3,521
Managed only 329 57,326 283 54,331
613 616 623
Joint Venture owned* 1 383 1 367 567
537
New Zealand 464
Owned and managed 3 970 3 970
Managed only 42 8,240 44 7,225
Malaysia
Owned and managed 2 2,164 2 2,164
Managed only 3 3,600 2 2,405
Total 399 76,204 354 70,983 FY2011 FY2012 FY2013 FY2014 FY2015 FY2016
33
*FEC have 25% stakeRegional Expansion On Track with
Latest Additions in Brisbane
Festival Car Park – 45 Charlotte Street,
Brisbane
- Acquired in April 2016
- Partnership with the Star and CTF where
FEC owned 25% stake
- 400 parking spaces over 8 levels and
Festival Car Park, Brisbane
ground level retail space and garage
- Autopay system with License Plate
Recognition technology
Festival Car Park, Brisbane
34Care Assist –
Infrastructure Support Ready for Global Expansion
Care Assist is the newly constructed facility in
the heart of Care Park’s Head Office in
Melbourne
Specifically designed to enhance control room
operations from just being an intercom help
point to being a fully functional customer and
client support centre
Operates 24-7 and currently manages over 70
facilities across Australia and New Zealand
Goal is to deploy Care Assist across entire
portfolio, laying a foundation for regional
expansion and efficiency improvement as
portfolio continues to grow
35Steadily Growing Facilities Management Services
Asset-light business model with steady growth expected
58 active contracts as at 30 September 2016 (added 12
contracts compared with 31 March 2016)
Case Study
- Acquired Pacifica Student Accommodation services contract in
September 2016
- 67 units of student accommodation
- Providing the following property services in this
building:
Property Management
Leasing of the apartment to students
Sundry income from laundry
Facilities Management of the Building
364. Prospects The Towers at Elizabeth Quay, Perth
Company Outlook – Solid Foundation for Growth

                            • Continue to invest globally leveraging on local expertise and taking advantage of
                              property cycles
 Chinese Wallet Strategy    • Weak sterling provides good timing for UK expansion: Angel Meadow Manchester
                              and Hornsey Town Hall, London redevelopment
                            • Opportunities in overseas ample with more additions anticipated

                            • Queen’s Wharf Brisbane casino license granted with potential Sydney and Gold
      Growth in               Coast projects
  Recurring Cashflow
    Business Intact         • 2 new hotels with 700 rooms will be opened in 6 months
                            • Regional expansion of car park portfolio continues

High Cash Flow Visibility   • Record-high cumulative presales of HK$9.8bn
   with Solid Pipeline      • Development pipeline amounting to HK$38bn

                            • Liquidity position at HK$5.4bn with undrawn credit facilities of HK$5.0bn
 Strong Balance Sheet to
     Support Growth
                            • 8 unencumbered hotel assets worth HK$3bn adds extra liquidity
                            • Net gearing at a healthy 31.6%

                                                                                                                  38
Company Awards Demonstrate Recognitions
Euromoney Best Managed Company in Asia in the Real‐Estate Category
Silver Award (Traditional Annual Report) - Real Estate
30th International Integrated Development & Investment
ARC Awards Bronze Award (Written Text) - Real Estate Integrated
Development & Investment
FinanceAsia Top Eighth Best at Corporate Social Responsibility
HKIRA Best IR Company (Small Cap)
Gold Award – Activism / Cause Marketing
2016 iNOVA Awards Silver Award – Virtual Conference
Bronze Award – Corporate Website – Real Estate
The Silver Award - Real Estate/REIT
Mr. Andrew Rashbass, CEO of Euromoney, presented the award to Tan
Sri Dato’ David Chiu, Chairman of Far East Consortium International Ltd The Bronze Award - Consumer Services -
2015 LACP Vision Hotels/Restaurants/Leisure
awards Annual
Report Competition
The Top 80 Annual Reports in the Asia - Pacific Region
The Top 50 Chinese Annual Reports of 2015
All – Asia (ex – Japan) Executive Team rankings
Institutional Investor
Top 3 Best Investor Relations Professional – Ms. Venus Zhao
Magazine
in 2016
39Thank You Questions & Answers FEC Official WeChat
Appendix: West Side Place, Melbourne –
Strong Response

                                                          4 Residential Towers,
                                     Feature              Ritz Carlton Hotel and
                                                             commercial area

                                     SFA                  Approx. 2,000,000 sq.ft.

                                     Net lettable area     Approx. 65,000 sq.ft.

                                     Number of
                                                                  2,500+
                                     apartments
                                     Number of hotel
                                                          263 (Ritz Carlton Hotel)
                                     rooms

                                     Launch time         Tower 1 and 2: June 2016

                                                                                     41
Appendix: Other Projects in Australia –
Balanced Pipeline in Portfolio
The FIFTH, Melbourne The Towers at Elizabeth Quay, Perth
284,000 sq. ft. SFA 320,000 sq. ft. SFA
402 apartments 379 apartments
Queen’s Wharf, Brisbane
706,000 sq.ft. attributable SFA Perth City Link, Perth
~2,000 residential apartments (50% stake) 188,000 sq. ft. SFA
4 Hotels with 1,004 rooms (25% stake) 350 apartments 42Appendix: Alpha Square, London –
Entrance into UK Residential Market
Planning obtained in May 2016
Features Residential and hotel component
SFA 388,000 sq.ft.
221,000 sq.ft.
Net lettable area
(incl. retail and other facilities)
Number of hotel rooms 231
43Appendix: Royal Riverside, Guangzhou
Feature 5 Residential Towers
SFA 728,000 sq.ft.
Number of apartments 607
Tower 2: Jan 2016
Launch time Tower 1 & 4: 1HFY2017
Tower 3 & 5: TBC
44Appendix: California Garden, Shanghai
King’s Manor
712,000 sq.ft. SFA
479 apartments and
90 townhouses
Royal Crest II
259,000 sq.ft. SFA
180 apartments and
42 townhouses
45Appendix: Projects in Hong Kong
Aspen Crest Tai Wai Shatin Heights
64,000 sq.ft. SFA 33,000 sq.ft. SFA 70,000 sq.ft. SFA
234 apartments 118 apartments 60 apartments + 3 townhouses
Sham Shui Po Sha Tau Kok Tan Kwai Tsuen
28,000 sq.ft., SFA 99,000 sq.ft. SFA 51,000 sq.ft. SFA
72 apartments 263 apartments 24 town houses 46Appendix: Projects in Singapore / Malaysia
Alexandra View, Singapore Dorsett Bukit Bintang, Kuala Lumpur
290,000 sq. ft. attributable SFA (70% stake) 215,000 sq. ft. SFA
400 apartments 252 apartments
47Appendix: Australian Casino Comparison
City Sydney Melbourne Brisbane Gold Coast Perth Adelaide Darwin
City population(‘000)(2015 June) 4,904 (+1.7% yoy) 4,513 (+2.1% yoy) 2,345 (+2.3% yoy) 614 (+1.6% yoy) 2,112 (+3.4% yoy) 1,277 (+1.0%) 123 (+1.7% yoy)
State/territory New South Wales Victoria Queensland Queensland Western Aus. South. Aus. Northern Terr.
Queen’s Wharf Crown Adelaide
Casino The Star Crown Melbourne Treasury Jupiters SKYCITY Darwin
Brisbane Perth Casino
Owner The Star Crown DBC The Star The Star Crown SKYCITY SKYCITY
Licence expiry 2093 2050 2121 2070 Perpetual 2060 2085 2031
Current exclusivity period Until 2019 n.a. 2047 n.a. n.a. n.a. Until 2035 Until 2026
Revenue (FY16 norm2, A$m) 1,657(+7.5% yoy) 2,312 (+3.7% yoy) n.a. 340 (+5.2% yoy) 361 (-8.2% yoy) 922 (- 5.5% yoy) 152 (-1.1% yoy) 116 (-5.3% yoy)
EBITDA (FY16 norm2, A$m) 302(+13.0% yoy) 673 (+1.7% yoy) n.a. 102 (+15.5% yoy) 84 (-14.4% yoy) 260 (+2.2% yoy) 26 (+19.1% yoy) 34 (-9.4% yoy)
Unlimited Unlimited Unlimited 65
Permitted tables 540 Unlimited 320 200
(303 currently) (83 currently) (79 currently) (currently)
1,632
633
Permitted EGMs1 1,500 2,628 2,500 (1,450 currently 1,651 2,500 1,500
(currently)
installed)
Under EGM licence Under EGM licence
Unlimited
Permitted MTGMs1 250 Unlimited cap cap n.a. 3003 n.a.
(471 currently)
(84 currently) (89 currently)
Hotel rooms 647 1,604 >1,100 128 592 686 100 9
Food and Beverage venues 32 29 ~50 13 14 12 150 13
$10 $5 $10
$10
EGM bet limits (except 1,000 No limit No limit No limit (Range of limits (except premium n.a.
(except 250 machines)
machines) depending on game) room)
EGM maximum note acceptors $100 $50 $100 $100 $100 $100 “Coin in – Coin out” $100
Commission tables:
0.91%
VIP play: 10%
VIP: 10% VIP: 10% VIP: 12% Slots: Clubs rate VIP: 9.09%
VIP: 10% Slots: 32.57% + VIP: 10%
Tax regime Slots: 30% Slots: 30% Slots: 23.5% (max 41%) Slots: 20%
Non-VIP: 27.5% + super tax Slots: 30%
(% of gross gaming revenue) Tables: 20% Tables: 20% Tables: 19% Tables: 3.41% Tables: 12%4
super tax Tables: 22.25% + Tables: 20%
(No super tax) (No super tax) MTGMs: 23% MTGMs and
super tax
commission slots:
10.91%4
(1) EGM stand for electronic gaming machine and MTGM stand for multi-terminal gaming machine;
(2) Normalised results calculated using an average win rate and average number of turns of front money experienced over the last 5 years in VIP Rebate business, calculated on a rolling
basis ended 30 June;
(3)
(4)
15 tables may be substituted for 300 MTGMs;
Adelaide tax regime based on gaming revenue after 10% GST(goods and services tax) and any rebate expenses, Darwin tax regime based on gross profit less GST;
48You can also read