FY2020 Q3 (October - December) - Z Holdings Corporation Business Results February 3, 2021 - IR Webcasting

Page created by Willie Gardner
 
CONTINUE READING
FY2020 Q3 (October - December) - Z Holdings Corporation Business Results February 3, 2021 - IR Webcasting
Security Code: 4689

Z Holdings Corporation Business Results

FY2020 Q3 (October – December)

February 3, 2021
FY2020 Q3 (October - December) - Z Holdings Corporation Business Results February 3, 2021 - IR Webcasting
FY2020 Q3 Financial Results – Topics

   In Q4, we will make increasingly aggressive investments mainly in e-commerce and payment businesses.

Full year outlook:   Revenue JPY1.14 T       (YoY+8.3%);   op. income JPY160 B (YoY+5.1%)
                      Revenue YoY +14.9%; operating income YoY -8.1%
Q3 Financial
                       • Revenue increased in line with increase in transaction value of Commerce
  results                business
                       • Op. income decreased due to aggressive investments and retirement loss from
                         renewal of existing system in credit card business, etc.

                       • Shopping business transaction value YoY       +33.7% due to events held,
 Business                e.g. “Cho PayPay Matsuri" (Super PayPay Festival)
  topics
                       • Total advertising revenue YoY    +6.7% due to increased demand in
                         programmatic advertising, etc.

                                                                                                          1
FY2020 Q3 (October - December) - Z Holdings Corporation Business Results February 3, 2021 - IR Webcasting
Table of contents

      1         FY2020 Q3 Financial Results

      2         Results by Business Segments/Topics

      3         Business Integration with LINE
FY2020 Q3 (October - December) - Z Holdings Corporation Business Results February 3, 2021 - IR Webcasting
Consolidated Results
FY2020 Q3 (October - December) - Z Holdings Corporation Business Results February 3, 2021 - IR Webcasting
FY2020 Q3 Consolidated income statement

                                            Item                                                       FY2019 Q3                      FY2020 Q3          YoY

   Revenue                                                                                              275.4 (¥B)                     316.5 (¥B)        +14.9%

   Operating income                                                                                        47.8 (¥B)                     43.9 (¥B)        -8.1%

   EBITDA                                                                                                  70.1 (¥B)                     79.5 (¥B)       +13.4%

   Equity in earnings of associates and joint venture*1                                                    -6.2 (¥B)                      -2.7 (¥B)        N.A.

   Net income attributable to owners of the parent                                                         23.8 (¥B)                     21.0 (¥B)       -11.9%

   Diluted EPS                                                                                                  ¥5.01                           ¥4.41    -11.9%

  Net leverage ratio*2                                                                                         2.56 X                           2.08 X     N.A.

*1 Mainly due to PayPay Corporation.
*2 Net leverage ratio=Net interest-bearing debt/EBITDA Excludes banking business. Figures for the last 12 months used for calculating EBITDA.                     4
FY2020 Q3 (October - December) - Z Holdings Corporation Business Results February 3, 2021 - IR Webcasting
FY2020 Q3 Factors of change in operating income

Decreased due to aggressive investments, retirement loss from
the system renewal in the credit card business, etc.
(¥B)                                                  Increase in marketing
                                                    expense due to aggressive
                                            +6.2           investments        Loss on

                +15.3          +2.8                                         retirement of
                                                                             fixed assets
                                                                                            Increase in other
                                           ZOZO, Inc.:                                           SG&A
                                Media
       47.8                   business:    Increase in       -10.8
                             Increase in    op. profit
                                                                                  -7.5                           43.9
               Commerce         gross
                               income
                business:                                                                        -9.9
               Increase in
                  gross                            Aggressive investments
                 income                            ► See next slide for details

   FY2019 Q3                                                                                                    FY2020 Q3
                                                                                                                            5
FY2020 H2 Status & outlook of aggressive investments

Taking a more aggressive stance in Q4, capture growth
opportunities mainly in Commerce business
                                                               Q3                                                                                    Q4

                             Sales activity                                                                             Sales activity
           Field                                      Details of investment/Investment effect                                                             Investment plan
                             cost* (YoY/¥B)                                                                            cost* (YoY/¥B)

  Total                            +10.8                                                                         Around       +21.0
                                                 • Sales promotional measures (e.g. “Cho                                                 • Large-scale campaign to be held within this
                                                   PayPay Matsuri”)                                                                        fiscal year
  EC (Merchandise)                 +7.3           ► Shopping business transaction value YoY+33.7%                                        • Logistics campaign for stores
                                                  ► Reuse business transaction value YoY+7.4%                                            • Other sales promotional measures to
                                                    (First high-single digit growth in 18 quarters)                                        increase transaction value, etc.

                                                 • Restrained cost for planned launches of                                               • Sales promotional measures to increase
  Credit card                      +0.4            new services/functions                                                                  membership for new services/functions, etc.

  Other                                          • Sales promotional measures for new                                                    • Sales promotional measures to increase bank
 (O2O, Membership,                 +2.4            customer acquisition, etc.                                                              accounts
  Finance)                                        ►Services transaction value YoY+101.9%                                                 • Branding measures for LINE integration, etc.

                                                                                                                                         • Measures to expand integrated marketing
                                                 • Measures to promote app installations, etc.
  Media/Search                     +0.8           ► Total advertising revenue YoY+6.7%
                                                                                                                                           solution
                                                                                                                                         • Measures to promote app installations, etc.

* Total expenditures for sales promotional activities (costs for sales promotion, advertising, and point provision).                                                                      6
FY2020 Consolidated business results - Guidance

Aim for full year operating income of JPY160 B
   FY2020 full year guidance                   FY2020 Q4 Op. income outlook(QoQ)

                                            Commerce
                               (¥B)
No change in guidance                        business:
                                            Decrease in                   Increase in
                                 43.9      gross income
                                                             Media
                                                                           marketing
                                                                         expenditures
                                                            business:
           Revenue                                         Decrease in
                                                                             from
                                                                          aggressive
                                                          gross income   investments

        JPY  1.14 T                          -10.0           -0.4
                                                                                                        Expense for
                                                                                                      LINE integration
                                                                                                      + other one-time
                                                                                           +7.5
       (YoY +8.3%)
                                                                                                          expense

                                                                                                                           17.8
       Operating income                                                                   Absence of      -5.7
                                                                           -17.4        retirement loss
                                                                                        of fixed assets

      JPY   160.0 B                                                                      (FY2020 Q3 )

       (YoY +5.1%)             FY2020 Q3                                                                                 FY2020 Q4
                                                                                                                                     7
Results by Business Segments/Topics
Commerce Business
FY2020 Q3 Commerce business transaction value – Results
                                                 Q3 Actual
                   Item                                                  YoY                                        Major measures/Factors of change
                                                results (¥B)

  EC transaction value                              918.2            +33.0%

     Merchandise                                     697.8            +20.7%
                                                                                        • Strengthened sales promotional activities (e.g. "Cho PayPay Matsuri”)
        Shopping business                             394.7             +33.7%          • Impact of consolidating ZOZO, Inc.

                                                                                        • Steady increase in no. of users, spending per buyer especially in YAHUOKU!
        Reuse business                                219.2              +7.4%            (auction) due to "Cho PayPay Matsuri" and year-end sales promotions
                                                                                        • Use increased during New Year’s holiday from cocooning consumption

     Services      *1                                211.1          +101.9%             • Impact of “Go To” *3 campaigns

                                                                                        • Growth in the transaction value of ebookjapan (e-books), due to "Cho PayPay
     Digital content *2                                  9.2          +20.2%              Matsuri", etc.

                                                                                        • Restrained cost for planned launches of new services/functions
  Credit card                                        657.1            +15.6%            • Offline use decreased due to restraint from going out (decreased due to lower
                                                                                          consumption from COVID-19)

*1 Includes transaction values of Yahoo! JAPAN Loco, Yahoo! JAPAN Travel, Ikyu Corporation, and PassMarket. Formerly announced as "Services and Digital Content (O2O Business).
*2 Transaction value of paid digital content. Formerly announced as "Services and Digital Content (Other (Services and Digital Content))." Digital content business has been transferred to
   Media business from FY2020 Q3.
*3 Japanese government’s campaigns to revitalize industries hit by COVID-19 (tourism and dining).                                                                                           10
Commerce Business
Yahoo! JAPAN Shopping, PayPay Mall – Status

Steady increase in no. of new buyers and average spending per
buyer as a result of investments
                                                                                                       Ave. spending per buyer
               New buyers*
                                                                                                       (new & existing buyers)

                                               YoY +40.7%                                                                YoY +3.1%

                  Q3                                       Q3                                           Q3                        Q3
                FY2019                                   FY2020                                        FY2019                    FY2020
* Users who have no purchase history in Yahoo! JAPAN Shopping and PayPay Mall in the last 12 months.                                      12
Yahoo! JAPAN Shopping, PayPay Mall – Status

In-house payment ratio reached the highest with disciplined investments
                Shopping advertising take rate*1 &
                                                                                                               In-house payment ratio*3
                Ratio of sales activity cost*2

            Shopping advertising take rate           % of sales activity cost                                                                                            60.1%
                                                                                                                                                   57.0%
                                                                                                                                                           54.8% 53.9%
                                                                                                                                           52.1%

                                                                                                Introduction of PayPay
                                                                                                (June 3)                                     “Cho PayPay Matsuri”
                                                                                                                              35.0%          (Super PayPay Festival)
                                                                                                                                             (Oct- Nov)
                                                                                                              25.6% 26.7%
                                                                                              22.9% 23.4%                   28.7%

    Q1         Q2           Q3         Q4          Q1          Q2          Q3                   Q1     Q2      Q3     Q4      Q1      Q2     Q3      Q4     Q1      Q2     Q3

                   FY2019                                     FY2020                                       FY2018                      FY2019                     FY2020
*1 Shopping-related advertising revenue / Total transaction value of Yahoo! JAPAN Shopping and PayPay Mall.
*2 Point-reward expenses, expense for PayPay Bonus, sales promotion cost and advertising cost related to Yahoo! JAPAN Shopping and PayPay Mall / Total transaction value of Yahoo!
   JAPAN Shopping and PayPay Mall.
*3 Ratio of in-house payment methods used (e.g. Yahoo! JAPAN Card, PayPay, PayPay Bonus) out of amount of payments made in Yahoo! JAPAN Shopping and PayPay Mall.                  13
Commerce Business
ZOZO, Inc.

      Growth accelerating after joining ZHD Group
                            GMV*1                                                    Operating profit*2
                                                                                                                                New service: Technology × Fashion
                                                                  20.0
      (¥B)            YoY                                                (¥B)            YoY
160                                                                                                             +126%   150%

                                                           140%
      Consolidation of
                                                  +26%
140     ZOZO, Inc.          +20%                                                                                        100%               To be launched on
                                       +13%                120% 15.0
                                                                                    +69%              +73%
                                                                                                                                          March 18, 2021 (plan)
120

        +0%       +3%                                                                          +34%
                                                                                                                        50%

                                                           100%
100

                                                                  10.0
                                                                                                                        0%
 80
                                                           80%

                                                                         -42%
 60
                                                  118.6                                                         13.9    -50%
                                                           60%

        94.3      91.2       95.3       90.3                                                   10.4                                 ► Face measurement
                                                                   5.0
 40

                                                                                     8.5                9.5
                                                           40%
                                                                            6.1                                         -100%
                                                                                                                                    ► Personal color analysis based on
 20

                                                                                                                                      measurement of skin color
  0                                                        20%     0.0                                                  -150%       ► Function that assists purchase
         Q3        Q4         Q1        Q2         Q3                       Q3       Q4        Q1       Q2       Q3                   of makeup foundation

             FY2019                    FY2020                                   FY2019                 FY2020
                                                                                                                                Further reach out to Generation Z & Millennials*3
      *1 Gross merchandise value of e-commerce operated by ZOZO, Inc. (including PayPay Mall ZOZOTOWN Store).                                  (ZOZO’s strength)
      *2 Consolidated business result of ZOZO, Inc. (JGAAP)
      *3 Generation Z (ages 16-24); Millennials (ages 28-38).                                                                                                                       15
Commerce Business
– KPI

Steady expansion in user base and no. of merchants
No. of PayPay payments               No. of merchants*                                                No. of registered users
(quarter)                            (quarter-end)                                                    (quarter-end)

                                                                                                             Surpassed 35   mil (Jan.4)

        1.8X           507.14 mil             1.5X                             2.86 mil                      1.6X               34.91 mil
        YoY                                    YoY                                                            YoY

                                     1.85 mil                                                         22.43 mil
285.95 mil

   Q3        Q4   Q1    Q2      Q3       Q3          Q4          Q1          Q2          Q3             Q3        Q4   Q1       Q2        Q3
     FY2019            FY2020               FY2019                        FY2020                           FY2019              FY2020

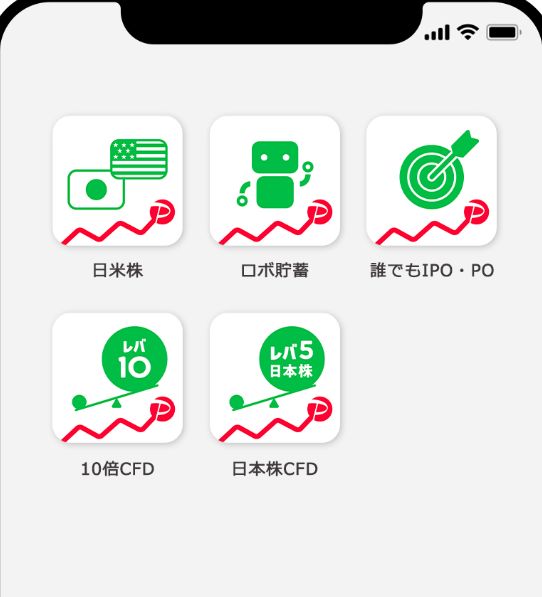
                                     * No. of merchant applications to PayPay (e.g. stores, taxis).                                            17
PayPay Securities (former One Tap BUY *Changed name on February 1)

Will further expand financial services under PayPay brand

                                                                        Securities

                                           New account opening
                                            campaign underway

     PayPay mini app “Earn Bonus”          Planning to expand new services with
                                               a focus on investment trusts

  Cumulative users exceeded   1.9 mil      (e.g. long-term, diversified, regular investments)

                                                                                                18
Media Business
FY2020 Q3 Total advertising revenue – Results
                                                    Q3 Actual
                     Item                                                   YoY                              Major measures/Factors of change
                                                   results (¥B)

  Total advertising revenue                               93.4        +6.7%

                                                                                    • Demand recovered in some industries (general online retailing/real estate/
                                                                                      automotive)
                                                                                    • Demand continued to decrease in some industries (travel/job/finance) due to
    Search advertising                                     42.6         -2.8%
                                                                                      COVID-19
                                                                                      - Travel: Temporarily recovered due to “Go To Travel” campaign, but decelerating
                                                                                         again due to suspension of the campaign and the 3rd wave of COVID-19

    Display advertising                                    50.8       +16.1%
                                                                                    [Media]
                                                                                    • Increase in traffic in media services due to COVID-19
      Programmatic advertising                                                      • Uplifting effect due to improvements in multiple products
                                                            43.0       +21.1%
      (YDN, shopping ads, etc.)                                                     [Shopping]
                                                                                    • Increase in Shopping-related advertising revenue in line with the growth in the
                                                                                      transaction value of shopping business

                                                                                    • Demand recovered from major clients who refrained from placing ads due to
       Reservation advertising                               7.8            -5.2%     COVID-19
                                                                                    • Effective seasonal promotions (e.g. “Hometown tax donation*”)

* A tax reduction given to tax payers who donate to local municipalities.                                                                                                20
Q4 Outlook by Business Segments
FY2020 Q4 Outlook by business segments

            Item                  YoY                                           Major measures/Factors of change

EC transaction value
(Merchandise)
                             Around +10%
                                                   • Strengthen additional sales promotional measures, expand loyalty program “PayPay STEP”
  Shopping business                     +Mid-20%   • Wind down in the effect of consolidating ZOZO, Inc.
                                                   • Wind down in the impact of large-scale campaign held in FY2019 Q4
                                                   • Strengthen additional sales promotional measures
  Reuse business            +Low-single digit %    • Increase in new sellers expected due to lowered sales commission for PayPay Flea Market
                                                     (Since January 2021: 10%→5%)

Total advertising revenue        Almost flat
                                                   • Impact of COVID-19 will wind down partially, but sluggish demand expected to continue in
  Search advertising        -Low-single digit %      some industries
                                                   • Wind down in the effect of UI measures conducted in FY2019 Q4
                                                   [Media]
                                                   • Uplifting effect due to improvements in multiple products
                                                   • Decrease in ad placement due to COVID-19 (mainly reservation-based ads)
                                                   • Partial absence of fiscal year-end demand seen in FY2019 Q4
  Display advertising       +Low-single digit %
                                                   • Decrease in retargeting ads due to iOS14
                                                   [Shopping]
                                                   • Increase in Shopping-related advertising revenue in line with the growth in the transaction
                                                      value of shopping business

                                                                                                                                                   22
Business Integration with LINE
Key message:
                                                                 経営統合スケジュールは3月完了に変更はない
Business integration with LINE – Status

Working towards completing the integration in March 2021

2019                                           2021
       Dec   • Concluded DA on business               Jan   • Tender offer of ZHD shares by
               integration                                    LINE Corporation

2020                                                  Feb   • LINE Successor succeeds LINE
       Aug   • Concluded Business Alliance                    business through corporate
               MOU with LINE Corporation                      demerger
             • Acquired clearance from JFTC                 • Share exchange with ZHD as
                                                              parent company and LINE
       Sep   • SoftBank Corp. and NAVER J.                    Successor as subsidiary
               Hub completed tender offer of
               LINE shares                            Mar   • Completion of business
                                                              integration on effective date of
       Dec   • LINE Corporation delisted                      share exchange

                                                                                                 24
Key message:
                                                                            取引スキームやストラクチャーは当初予定から変更なし
Business integration with LINE – Structure

Transaction scheme & structure remain unchanged
Post-integration structure through share exchange            Share exchange ratio

50%                                                    50%
                                                                      1           : 11.75
                  General
                shareholders
                                   JV            (LINE)

34.7%         ZHD shares                             65.3%   No. of ZHD shares issued before/after
                                                             share exchange
                                   LINE shares
                                  Integrated
                                   company                      4.8 B ▶ 7.7 B
                                                                 shares  shares
100%                                                  100%
                                                             - All incremental shares are issued to JV
                                               Succeeding    - No. of treasury shares to be allocated is
                                                company
                                                               undecided
                                                                                                           25
Business integration with LINE – Recognition of goodwill and PPA

Goodwill to be recorded will vary depending on the acquisition cost
of LINE Successor, etc.
                                                                                                                     Assets                     Liabilities & Equity

              Acquisition
                                                         Net assets
                  cost                                                                                                Goodwill

 (ZHD share price*1 ) × (No. of ZHD shares to be                                                             Intangible fixed assets
 delivered, derived from share exchange ratio*2 )

                                                                                                     Goodwill
                                                                                 Difference          (No amortization required in IFRS consolidated financial statements)
                                                                                                     ► Amount varies by acquisition cost, etc.
                                                                                                     ► Impairment test of goodwill will be conducted for each post-
                                                                                                       integration CGU group, by comparing the book value with the
                                                                                                       recoverable amount

                                                                                                     PPA (Amortization required in IFRS consolidated financial statements)
                                                                                                     ► No impact of acquisition cost, etc.
*1 Closing stock price of the business day immediately prior to the effective date of the share exchange, in March 2021.
*2 Share exchange ratio; ZHD: LINE = 1:11.75                                                                                                                                 26
Unleashing the infinite potential of all people,
  with the power of information technology
Appendix
Factors of change in operating income

                      Item                       Q3 (¥B)   YoY                                      Major factors of change (¥B)

             FY2019 Q3 Results                     47.8
                                                                     •   ZOZO +18.1 (Consolidated from November 2019)
                                                                     •   ASKUL Group +9.5
              Revenue                             +41.1    +14.9%    •   Advertising +3.1
                                                                     •   Ikyu +2.3
                                                                     •   eBOOK +2.1

                                                                     • ASKUL Group +6.0
              Cost of sales                        +7.1     +6.8%    • eBOOK +1.0
                                                                     • Advertising +1.0

    YoY
              SG&A                                +30.2    +25.0%    • Increase due to consolidation of ZOZO +10.9

difference
                              Personnel                              • Increase due to consolidation of ZOZO +2.3
              (Major items)
                              expenses              +9.6   +35.4%    • Increase in employees of Yahoo Japan and non-consolidated ZHD, etc.

                              Sales promotion
                              cost                  +9.9   +64.2%    • Increase in cost due to growth in transaction value, and sales promotional measures, etc.

                              Depreciation and                       • Increase due to consolidation of ZOZO +1.7
                              amortization          +3.4   +15.7%    • Increase in software, servers, etc.
                              Shipping cost         +3.6   +38.7%    • Increase due to consolidation of ZOZO +3.3

              Other income & expenses               -7.5         -   • Retirement loss due to the system renewal in the credit card business, etc.

        FY2020 Q3 Results                          43.9    -8.1%
                                                                                                                                                                   29
Impact from consolidation of ZOZO (Goodwill, PPA)

         Item                     Amount (¥B)   Amount amortized (¥B)

  Goodwill                            212.9                     ―
                                                                                                       Amortization
                                                                               Item     Amount (¥B)       period
                                                                                                      (Straight line)

                                                                        Customer
                                                                        base                 322.0    18-25 years
                                                                        (Shops/users)
                                                              3.3
  PPA                                 502.1
                                                   (FY2020 Q3)
                                                                        Trademark*           178.7                 ―

                                                                        Others                  1.4         4 years

* Indefinite-lived intangibles.                                                                                         30
FY2020 Q3 Statement of financial position
Consolidated (IFRS)                                    The Japan Net Bank, Limited (JGAAP)                            YJ Card Corporation (JGAAP)

                      FY2020    FY2020                                        FY2020       FY2020                                             FY2020       FY2020
(¥B)                                      Difference    (¥B)                                           Difference      (¥B)                                           Difference
                        Q2        Q3                                            Q2           Q3                                                 Q2           Q3

Assets                4,112.2   4,299.4      187.2     Assets                 1,230.2      1,315.1          84.8       Assets                   448.4        500.4            52.0
  Cash and cash                                           Cash and cash                                                   Cash and cash
  equivalents         1,067.4     998.4       -68.9       equivalents            438.1        396.5        -41.6          equivalents             20.8         36.5           15.7

  Trade and other                                         Trade and other                                                 Trade and other
  receivables           378.4     449.5        71.1       receivables             21.1         21.5             0.4       receivables             15.9         21.5            5.6

  Loans in credit                                         Loans in credit                                                 Loans in credit
  card business         337.7     379.3        41.6       card business              -           -              -         card business          333.7       375.9            42.2

  Investment                                              Investment                                                      Investment
  securities in         468.5     484.8        16.3       securities in          478.5        494.8            16.3       securities in             -            -              -
  banking business                                        banking business                                                banking business

  Property and                                            Property and                                                    Property and
  equipment             129.1     130.4          1.2      equipment                 0.6         0.5              -0       equipment                4.6          4.1           -0.4

  Intangible assets     678.4     669.2         -9.1      Intangible assets         7.2         7.2              -0       Intangible assets       31.9         25.4           -6.4

Liabilities           3,051.6   3,185.2      133.5     Liabilities            1,173.4      1,257.0          83.5       Liabilities               413.4       470.8            57.3
  Trade and other                                         Trade and other                                                 Trade and other
  payables              466.2     511.2        45.0       payables                16.0         18.2             2.1       payables               148.7       181.2            32.5

  Customer deposit                                        Customer deposit                                                Customer deposit
  in banking          1,091.4   1,169.7        78.2       in banking           1,115.7      1,196.7            81.0       in banking                -            -              -
  business                                                business                                                        business

  Interest-bearing                                        Interest-bearing                                                Interest-bearing
  liabilities         1,204.6   1,205.4          0.7      liabilities             37.0         37.0             -         liabilities            253.3       278.5            25.2

Equity                1,060.5   1,114.2        53.6    Equity                     56.7         58.0            1.3     Equity                     34.9        29.6            -5.2

                                                       Note: Figures before internal transactions within the          Note: Figures before internal transactions within the
                                                             Group are eliminated.                                          Group are eliminated.                                    31
Financial data
CAPEX                                                                                   Adjusted FCF

(¥B)                                                                                    (¥B)

  Right-of-use assets                                                                        Operating CF         Investment CF
  Property & equipment/Intangible assets                                                -     Adjusted FCF                                         14.8
                                                                                                                                                                   23.7

                                                                                               -35.4                                                                -8.9
                                                            31.8

                                                                            11.9
                 18.5
                                                                                         -397.7
  1.3

 17.3                                                                       19.9
                                                                                                                        -433.1

             FY2019 Q3                                  FY2020 Q3                                      FY2019 Q3                               FY2020 Q3
                                                                                        Note: Excludes banking business.
                                                                                              Securitization of credit card receivables is added in operating cash flow.
Note: The figures are rounded down to the nearest million yen and then rounded to the         The figures are rounded down to the nearest million yen and then rounded to the
      nearest 100 million yen.                                                                nearest 100 million yen.                                                        32
Financial data
Interest-bearing debt & Net interest-bearing debt                                               Net leverage ratio

                       (Excludes banking business)                                                                  (Excludes banking business)
(¥B)                                                                                            (¥B)

  Lease liabilities     Securitization                 Loan                                    EBITDA                   Net interest-bearing debt
  Bonds                - Net interest-bearing debt                                              - Net leverage ratio                                                                3.50

                                                  1,177.7                               7,000

                                                                                                                                                Approx.
                                                                                                                                                                                     3.00

                1,074.9                                             109.6                                               593.0
                                                                                                                                                2.08 X
                                                                                        6,000

                                                                                                       Approx.                                                     548.7
   105.6                                                            153.0
                                                                                                                                                                                     2.50

    98.0                                                                                5,000
                                                                                                       2.56 X
                                                                                                                                                                                     2.00

                                                                    371.2
                  593.0                              548.7                              4,000

    511.9                                                                                                                                                                            1.50

                                                                                        3,000
                                                                                                                                                     263.2
                                                                                                          231.3
                                                                                                                                                                                     1.00

                                                                                        2,000

                                                                    543.9
   359.3                                                                                1,000
                                                                                                                                                                                     0.50

                                                                                           0                                                                                         0.00

              FY2019 Q3                           FY2020 Q3                                                  FY2019 Q3                                 FY2020 Q3
                                                                                                Note: Net leverage ratio=Net interest-bearing debt/EBITDA (Figures for the last 12
Note: Net interest-bearing debt=Interest bearing debt – Cash and cash equivalents                     months used for calculating EBITDA)
      The figures are rounded down to the nearest million yen and then rounded to the                 The figures are rounded down to the nearest million yen and then rounded to
      nearest 100 million yen.                                                                        the nearest 100 million yen.                                                          33
Major funding activities

Refinanced the funding for acquiring ZOZO, Inc. and secured stable
sources of funds

                      Series                    Amount (¥B)   Interest rate   Redemption

  14th Series Unsecured Bonds (1.5 year bond)           25        0.20%       Dec. 2021

  15th Series Unsecured Bonds (3 year bond)             80        0.35%       Jun. 2023

  16th Series Unsecured Bonds (5 year bond)             70        0.60%       Jun. 2025

  17th Series Unsecured Bonds (7 year bond)             15        0.79%       Jun. 2027

  18th Series Unsecured Bonds (10 year bond)            10        0.90%       Jun. 2030

                                                                                           34
– Capital structure (shareholding ratio)
                                         May 2018        As of end of   As of end of   As of end of   As of end of
                                                                                                                     After conversion of preferred stocks
                                        (At founding)     May 2019       Mar 2020       Sep 2020       Dec 2020
                                                                                                                                      &
                   Yahoo Japan                50%             25%            25%           25%              25%       Paytm’s exercise of stock option*2

                     SoftBank                 50%             25%            25%           25%              25%
                                                                                                                       Yahoo Japan                 32%
 Common
  stock
                  SoftBank Group                   -          50%            50%           50%              50%
                       Paytm                       -                -             -              -              -        SoftBank                  32%
                       Total                100%             100%          100%          100%               100%
                                                                                                                     SoftBank Group                28%
                   Yahoo Japan                     -                -        50%           50%              50%

 Preferred
                     SoftBank                      -                -        50%           50%              50%            Paytm                     8%
  stock*1
                  SoftBank Group                   -                -             -              -              -
                                                                                                                            Total                 100%
                       Total                       -                -      100%          100%               100%

                                              Voting rights                                                                             Voting

                                                  ratio                  25%                                                            rights
                                                                                                                                         ratio    32%
*1 From April 2022 onwards, may be converted to common stocks (conversion rate=1:1).
*2 On September 30, 2020, issued stock options to Paytm. The options can be exercised from the same date.                                                   35
Collaborations in ad sales with SoftBank Corp.
                                                               Revenue from
             Major measures in FY2020 Q3
                                                           synergies in FY2020 Q3

             Increase in proposals to
            SoftBank Corp.’s top clients

           Increase in new proposals to
            clients new to Yahoo Japan                 JPY   4.4 B*
                                                        (FY2020 Q2: JPY3.7 B)
         Designing of DX packages for
       local governments & corporations

* Gross revenue before deducting incentive payments.                                36
Business segment breakdown

                     Advertising                   Display advertising (Programmatic, reservation), ZOZO

                                                   ASKUL, ZOZO, Affiliate-related services, Reservation-related services, Corporate system-use fees of
                     Business Services
                                                   YAHUOKU!, Payment-related services, Banking-related services, Credit card-related services and others,
                     (For corporations)
  Commerce                                         Real estate-related services
   Business                                        LOHACO, ZOZO, Yahoo! JAPAN Premium, Personal system-use fees of YAHUOKU!, PayPay Flea Market
                     Personal Services
                                                   sales commission, Credit card-related services, Pet supplies-related services, Telecommunications carrier-
                     (For individuals)
                                                   related services, Banking-related services, FX-related services, Payment-related services

                     Others                        Banking-related services

                     Advertising                   Search advertising, Display advertising (Programmatic, reservation)

                     Business Services
    Media                                          Media-related services, CRM-related services and others
                     (For corporations)
   Business
                     Personal Services
                                                   Video-related services, E-book-related services and others
                     (For individuals)

                     Advertising

                     Business Services
                                                   Utilities payment-related services and others
    Others           (For corporations)

                     Personal Services
                                                   Yahoo! JAPAN Mail, Utilities payment-related services and others
                     (For individuals)

Note: The contracts of business services are concluded with corporations; the contracts of personal services are concluded with individual users.
      The same product may be classified in different segments depending on the contractor.                                                                     37
Definition of EC transaction value

                                                                                                                          YAHUOKU!, PayPay Flea Market,
  Commerce business                                                                    Reuse business
                                                                                                                          ZOZOUSED

                                                                                                                          Yahoo! JAPAN Shopping, PayPay Mall,
                                                                                     Shopping business
                                                                                                                          ZOZOTOWN, LOHACO, Charm
                                                  Merchandise

                                                                                          ASKUL BtoB

                                                                                              Other                       Yahoo! JAPAN Tickets,
                                                                                          (Merchandise)                   Ouchi-Direct
    EC transaction value
                                                     Services                     Ikyu.com, Yahoo! JAPAN Travel, Yahoo! JAPAN Loco

     Media business                             Digital content*                  Paid digital content

* Transaction value of paid digital content. Transaction value of Yahoo! JAPAN Bookstore included until FY2018 Q4. Digital content business has been transferred to Media business from
  FY2020 Q3.                                                                                                                                                                            38
Advertising products

                  Advertising Products                      Main Format          Fee Calculation     Placement Pages      Type of Advertiser

  Search                                                                                              Search results
              Yahoo! JAPAN Ads “Search advertising”            Text
advertising                                                                                               pages
                                                                                 Cost per-click
                                                               Text                                     Top page               Major
                                   Yahoo! JAPAN Ads                                                                      corporations/SMEs
                                                              Banner                                 Interior pages of
                                     “Display ads”
                                                                                                       service sites
                                 (Programmatic-based)
              Programmatic                                    Video              Cost per-view        Partner sites
               advertising
                                                                                                      Yahoo! JAPAN       Tenants of Yahoo!
                                      Shopping ads                                                      Shopping
                                                           Text banner        Cost per-conversion                        JAPAN Shopping,
                                  (Programmatic-based)
                                                                                                       PayPay Mall         PayPay Mall
  Display
advertising                                                                                             Top page
                                                         Rich (incl. video)   Cost per-impression
                                                                                                     Interior pages of   Major corporations
                                   Yahoo! JAPAN Ads           Banner           (Reservation-based)
                                                                                                       service sites
                                      “Display ads”
               Reservation                                     Text           Cost per-guaranteed
                                   (Reservation-based)
               advertising                                                        period, etc.        Yahoo! JAPAN       Tenants of Yahoo!
                                                              Banner           (Reservation-based)      Shopping         JAPAN Shopping,
                                                                                                       PayPay Mall         PayPay Mall
                                      Shopping ads                            Cost per-guaranteed
                                                           Text banner
                                   (Reservation-based)                            period, etc.

                                                                                                                                               39
Z Holdings – Service map
                           Media                                           Local Information                                Commerce                                                     O2O
                         Weather/
        TOP page                              News            Finance                                        Shopping                Auction             Real estate          Travel                    Loco
                         Disaster                                               Transit information

       Knowledge        Sportsnavi               GYAO!                                                                                                                                              PassMarket
                                                                                         Maps                    PayPay Mall               PayPay Flea Market                 Tickets
       search           (Sports news site)       (Video streaming)                                                                                                                                  (Ticket sales)

      Retty            kurashiru                 mybest
                                                                                                                                                                              Ikyu.com              Ikyu.com
      (Restaurant      (Recipe video             (Comparison of                     Car navigation                ZOZO                  ASKUL          LOHACO
                                                                                                                                                                              (Hotel)               (Restaurant)
      information)     service)                  products/services)                                     (Fashion online shopping)    (B to B EC)     (B to C EC)

                           Search                                            Digital Content                                              Finance/Payment/Fintech
                                                                               Fortune                                                                                                    PayPay
           Search        Real-time search            Beauty                                      Game             Credit card                      Online wallet
                                                                               telling                                                                                                    (Smartphone payment)

                               Stanby                                               ebookjapan                                  YJFX                                           The Japan Net Bank
      Job catalog                                    Vocal assistant
                               (Job search)                                         (Digital books)                             (FOREX)                                        (Internet banking)

                                       For Corporations                                                           Data                                   PIM                                  CSR
                                                                                                                                                                                                    Internet
                                                                    Crowdsourcing                                                               e-Mail             Calendar            Kids
                                                                                                                                                                                                    fund raising

                                                                 Customer base                             No. of users: Approx. 80 mil*
* Annual logged-in user IDs.                                                                                                                                                                                         40
Image of our long-term revenue composition

Will continue to grow while drastically changing our revenue composition
to meet the changes in the business environment

                                                                                                        Data solution

                                                                                                        Fintech

                                                                                                        E-commerce

                                                                                                    Integrated marketing solution,
                                                                                                    shopping advertising

                                                                                                        Search advertising,
                                                                                                        display advertising
                                                                                                        (excl. shopping advertising)
FY13   FY14   FY15   FY16   FY17   FY18   FY19   FY20   FY21   FY22   FY23   ・・・   ・・・   ・・・   Future
                                                                                                                                       41
Operating income – Long-term outlook
 Businesses to be strengthened (Shopping advertising, Integrated marketing
  solution, Financial & Payment, Membership, Reuse business)
                                                                                                          - FY2022
 Advertising income – base (Search advertising, Display advertising)
                                                                                          Invest in measures to expand users and
                                                                                          EC transaction value, and start up new
                                                                                          businesses, etc., to achieve:
                                       FY2023

                                ¥225.0 B                                                    ▶ Double-digit revenue growth
                                     Record high
  FY2018
¥140.5 B
                                                    Businesses to be
                                                   strengthened will be
                                                                                                       FY2023 - Future
                  Maintain                         the growth driver to
                over ¥140 B                           expand income                       Monetize increasingly activated users'
              op. income level
                                                                                          economic actions to:
    FY18 FY19 FY20 FY21 FY22 FY23                    …      …       …       …    Future

   Results   Period for structural reform            Next development stage                ▶ Bring income to an expansionary phase

Note: Other business and adjustments are prorated to businesses to be strengthened and
      advertising income (base), according to their composition ratio.                                                               42
Released “Integrated Report Portal”

Financial/non-financial information useful for investment decisions
will be updated as needed
                                                                     Vision and Strategy   Value Creation

                                                                    Business Performance   Sustainability

URL: (English) https://www.z-holdings.co.jp/integrated-report/en/
     (Japanese) https://www.z-holdings.co.jp/integrated-report/                                             43
Materiality matrix for Z Holdings Group
                                                                                                                                                                                  The numbers and colors in the matrix
                                                                                                                                                                 11 17            coincide with the SDG icons.
                                                                                                                                                              Solving social
                                                                                                                   Corporate                                   issues with
                                                                                                                                               9
                                                                                                                  governance                                        IT
                                                                                                                                             Data                                  4   Quality Education
                                                                                                                                            security             11 17
                                                                                                                                                             Disaster measures/
                                                                                                                 8                             9             Recovery support
                                                                                                                                                                                   5   Gender Equality
Level of stakeholder concern

                                                                                                              Health &
                                                                             5 10                              safety                       Network
                                                                           ◆Diversity/inclusion              management                    reliability                             6   Clean Water and Sanitation
                                                                                                                             8                                     99
                                                                                                    4                     Rewarding                          データ利活用
                                                                                                                                                              Contribution
                                                                                                                                                               using data          8   Decent Work and Economic Growth
                                                    9                                          Supporting                 workplace
                                                                                                                                                             による貢献
                                                                                                the future
                                                 ◆Improving media literacy           13        generation
                                                                                  Response                                               Risk
                                                                                  to climate                                          management                                   9   Industry, Innovation and Infrastructure
                                                                                   change          12
                                                                                                Sustainable
                                                                                                                                                           9
                                                                                                production/                                                                       10   Reduced Inequalities
                                                                                               consumption                                               ◆Correct AI use
                                                             11                                                                                 9
                                                           ◆Relationship with local community                                                 ◆Sound advertising market           11   Sustainable Cities and Communities
                                                                     10                                                  4 9
                                                                   ◆Accessibility                                    ◆Illegal/harmful content
                                                                                                                                                                                  12   Responsible Production and Consumption
                                                                                       13
                                                                                     ◆Pollution/waste
                                                   13 14                                                               16                                                         13   Climate Action
                                                 ◆Bio-diversity                                                      ◆Fair competition

                                                                                                                                                                                  14   Life Below Water
                                        ◆Anti-corruption
                                  6
                               ◆Water/land use                                                                                                                                    16   Peace, Justice and Strong Institutions
                                                                   Importance to Z Holdings Group
                                                                                                                                                                                  17   Partnerships for the Goals
Note: Big circles are especially important to the stakeholders and the Z Holdings Group, and need to be dealt with focus.                                                                                                        44
Overall picture of CSR, Materiality, and our four UPDATEs

                                          Contribution to
                                                                     Risk Reduction                Value Creation                    Stakeholders
                                            the SDGs

                                                                                              • E-commerce for
                                                                 • Data security/network        convenient &
                      #01                     Industry,            reliability                  comfortable life
                      Developing         9    Innovation and                                                                    Users
                                                                 • Minimization of            • Driving a fintech society
                      an IT Society           Infrastructure
                                                                   incidents                  • Contributing to society
                                                                                                leveraging multi-big data

                                                                                                                                              Employees
                                              Sustainable                                     • Supporting solutions for
                      #02                11   Cities and                                        community/social
                      Supporting                                 • Initiatives for disaster
                                              Communities                                       problems
                      Disaster Relief                              prevention/mitigation
   Management                                                                                                               Shareholders
                      and Social              Partnerships for                                • Initiatives to support
   Resources          Issues             17                                                                                      and
                                              the Goals                                         disaster restoration
                                                                                                                            other investors

   Business           #03                5    Gender Equality                                 • Promotion of diversity
   Activities         Building a                                                              • Realization of new work                        Partners
                      Society Where                              • Promotion of
                                              Decent Work                                       style
                      Everyone Can                                 accessibility
                                         8    and Economic                                    • Human capital
                      Play an Active          Growth
                      Role                                                                      development & training         Regions
                                                                                                                                 and
                                                                 • Response to climate        • Expansion of reuse
                                                                                                                                society
                      #04                     Responsible
                      Working            12   Consumption          change                       business
                      toward a                and Production     • Sustainable                • Awareness raising                              The next
                      Sustainable                                  procurement &                utilizing IT media
                                              Climate Action                                                                                  generation
                      Society            13                        disposal                     capabilities

Note: The numbers and colors in the picture coincide with the 17 SDG icons.                                                                                45
Carbon neutral initiatives (Announced: January 19, 2021)

Aim to achieve neutrality well ahead of Japanese government’s
“2050 Carbon Neutral” goal

                                                                                                          ZHD Group to announce
                                          Pursue early membership in
                                                                                              ▶       mid-long environmental goals
                                    RE100 renewable energy initiative*1
                                                                                                            by the end of FY2021

                                     Declared “FY2023 100% Renewable                                  Aim to achieve goal by FY2023
                                             Energy Challenge”
                                                                                                  ►   Will convert to renewable energy in all data
                                                                                    Offices
                                                                                     5.0%
                                                                                              ▶       centers
                                     Electricity
                                   consumption               Data center 95.0%                    ►   Offices will purchase renewable energy
                                  in Yahoo Japan *2                                                   certificates

*1 Global initiative that promotes 100% renewable energy in corporate activities.
*2 Yahoo Japan Corporation and some group companies sharing the Kioicho Office.                                                                      46
Acknowledgment as a sustainable company

Named for the first time to DJSI World Index,
a leading global index of ESG investment

              ◆◆◆
                                           Also selected as Industrial Leader                                                                     ◆◆◆
                                 in Interactive Media, Services & Home Entertainment sector
                                                                                             Received the highest evaluation in the following categories:

                                                                                               Governance & Economic Dimension

                                                                                               Information Security/Cybersecurity & System Availability

                                                                                               Environment

                                                                                               Environmental Reporting

                                                                                               Social

                                                                                               Corporate Citizenship and Philanthropy

Note: DJSI is a world leading index of ESG investment jointly developed by Dow Jones in the United States and RobecoSAM, an asset management company in Switzerland. Based on
long-term shareholder value, the index makes a comprehensive analysis of economic, environmental and social performance of listed companies in the world, and selects leading
sustainable companies.                                                                                                                                                          47
Acknowledgment as a sustainable company

                                                               MSCI Japan Empowering
FTSE4Good Index Series      FTSE Blossom Japan Index                                         ISS ESG Corporate Rating
                                                                 Women Index (WIN)

                                         2020 Health & Productivity Stock Selection
                                                             &
                                                                                       Digital Transformation Stocks
     SNAM Sustainability Index             2020 Certified Health and Productivity
                                                                                              (DX Stocks) 2020
                                       Management Organization Recognition Program
                                                (Large Enterprise Category)
                                                                                                                        48
Disclaimer

 Statements made at the meeting or included in the documents that are not historical facts are
 forward-looking statements about the future performance of Z Holdings Corporation (Company,
 Z Holdings, ZHD) and its consolidated subsidiaries and affiliates.
 The Company cautions you that a number of important factors could cause actual results to differ
 materially from those discussed in the forward-looking statements.
 Such factors include, but are not limited to, the items mentioned in “Risk Factors” in “Consolidated
 Financial Statements and Independent Auditor's Report” (Japanese only). Unauthorized use of the
 information or the data in this document is not permitted.

 Unless otherwise specified, English-language documents are prepared solely for the convenience
 of non-Japanese speakers.
 If there is any inconsistency between the English-language documents and the Japanese-language
 documents, the Japanese-language documents will prevail.
Unleashing the infinite potential of all people,
  with the power of information technology
You can also read