FY2022 First Quarter Earnings Call - February 4, 2022 - Automotive News

Page created by Clara Bradley
 
CONTINUE READING
FY2022 First Quarter Earnings Call - February 4, 2022 - Automotive News
FY2022 First Quarter
Earnings Call

February 4, 2022

   Adient – PUBLIC     1
FY2022 First Quarter Earnings Call - February 4, 2022 - Automotive News
Important Information

Adient has made statements in this document that are forward-looking and, therefore, are subject to risks and uncertainties. All statements in this document other than statements of historical fact are statements that are, or
could be, deemed “forward- looking statements” within the meaning of the Private Securities Litigation Reform Act of 1995. In this document, statements regarding Adient’s expectations for the recently completed strategic
transactions in China and its deleveraging activities, the timing, benefits and outcomes of those activities, as well as its future financial position, sales, costs, earnings, cash flows, other measures of results of operations, capital
expenditures or debt levels and plans, objectives, market position, outlook, targets, guidance or goals are forward-looking statements. Words such as “may,” “will,” “expect,” “intend,” “estimate,” “anticipate,” “believe,”
“should,” “forecast,” “project,” “plan” or “commit” or terms of similar meaning are also generally intended to identify forward-looking statements. Adient cautions that these statements are subject to numerous important
risks, uncertainties, assumptions and other factors, some of which are beyond Adient’s control, that could cause Adient’s actual results to differ materially from those expressed or implied by such forward-looking statements,
including, among others, risks related to: whether recently completed strategic transactions in China and deleveraging activities may yield additional value for shareholders at all or on the same or different terms as those
described herein, the timing, benefits and outcomes of the strategic transactions in China and/or the activities relating to our capital structure, the effects of local and national economic, credit and capital market conditions
on the economy in general, and other risks and uncertainties, the continued financial and operational impacts of and uncertainties relating to the COVID-19 pandemic on Adient and its customers, suppliers, joint venture
partners and other parties, the ability of Adient to execute its turnaround plan, work stoppages, including due to supply chain disruptions and similar events, energy and commodity (particularly steel) prices, the availability of
raw materials (including petrochemicals) and component products (including components required by our customers for the manufacture of vehicles (i.e., semiconductor chips)), automotive vehicle production levels, mix and
schedules, as well as our concentration of exposure to certain automotive manufacturers, the ability of Adient to effectively launch new business at forecast and profitable levels, the ability of Adient to meet debt service
requirements, the terms of future financing, the impact of tax reform legislation, uncertainties in U.S. administrative policy regarding trade agreements, tariffs and other international trade relations, general economic and
business conditions, the strength of the U.S. or other economies, shifts in market shares among vehicles, vehicle segments or away from vehicles on which Adient has significant content, changes in consumer demand, global
climate change and related emphasis on ESG matters by various stakeholders, currency exchange rates and cancellation of or changes to commercial arrangements, and the ability of Adient to identify, recruit, and retain key
leadership. A detailed discussion of risks related to Adient’s business is included in the section entitled “Risk Factors” in Adient’s Annual Report on Form 10-K for the fiscal year ended September 30, 2021 filed with the U.S.
Securities and Exchange Commission (the “SEC”) on November 23, 2021, and in subsequent reports filed with or furnished to the SEC, available at www.sec. gov. Potential investors and others should consider these factors in
evaluating the forward-looking statements and should not place undue reliance on such statements. The forward-looking statements included in this document are made only as of the date of this document, unless otherwise
specified, and, except as required by law, Adient assumes no obligation, and disclaims any obligation, to update such statements to reflect events or circumstances occurring after the date of this document.

In addition, this document includes certain projections provided by Adient with respect to the anticipated future performance of Adient’s businesses. Such projections reflect various assumptions of Adient’s management
concerning the future performance of Adient’s businesses, which may or may not prove to be correct. The actual results may vary from the anticipated results and such variations may be material. Adient does not undertake
any obligation to update the projections to reflect events or circumstances or changes in expectations after the date of this document or to reflect the occurrence of subsequent events. No representations or warranties are
made as to the accuracy or reasonableness of such assumptions, or the projections based thereon.

This document also contains non-GAAP financial information because Adient’s management believes it may assist investors in evaluating Adient’s on-going operations. Adient believes these non-GAAP disclosures provide
important supplemental information to management and investors regarding financial and business trends relating to Adient’s financial condition and results of operations. Investors should not consider these non-GAAP
measures as alternatives to the related GAAP measures. A reconciliation of non-GAAP measures to their closest GAAP equivalent are included in the appendix. Reconciliations of non-GAAP measures related to FY2022
guidance have not been provided due to the unreasonable efforts it would take to provide such reconciliations.

FY2022 First Quarter Earnings Call                                                                           Adient – PUBLIC                                                                                      Feb. 4, 2022            2
FY2022 First Quarter Earnings Call - February 4, 2022 - Automotive News
Agenda

> Introduction
  Mark Oswald
    VP, Treasurer & Investor Relations

> Business Update
  Doug Del Grosso
    President and CEO

> Financial Review
  Jeff Stafeil
    Executive VP and CFO

> Q&A

FY2022 First Quarter Earnings Call       Adient – PUBLIC   Feb. 4, 2022   3
FY2022 First Quarter Earnings Call - February 4, 2022 - Automotive News
Driving forward with focus while encouraging signs of stabilization
for the industry emerge
                          As expected entering FY22, numerous macro factors including supply chain
signs of stabilization

                          disruptions (and resulting operating inefficiencies), elevated commodity prices,                            Key Q1 FY22
   Macro factors:

                          increased freight costs, and labor availability / inflation continue to influence the                     Financial Metrics
                          industry and Adient’s near-term results
                                                                                                                   Modest improvements in certain macro headwinds (i.e.,
                              > As Q1FY22 progressed, early signs of stabilization began to emerge for certain
                                                                                                                   severity and magnitude of unplanned customer
                                headwinds (i.e., modestly softer steel prices and modest stabilization in
                                                                                                                   production stoppages and softening steel prices) provide
                                customer production schedules)                                                     early signs of stabilization for the industry
                              > Despite the encouraging signs, Q1FY22 results were impacted by roughly
                                ~$185M in lost volume, temporary operating inefficiencies and elevated                 Consolidated ~$3.5B
                                commodity prices                                                                           Revenue (down 10% y-o-y; down 12% vs.
                                                                                                                                    Q1FY21 pro forma) 1
                         Despite the continued difficult operating environment, Adient continues to execute
foundation for FY22

                         actions within its control to position the company for sustained success:                                        $146M 2
                            > Intense focus on launch execution, cost/operational improvement, and customer              Adj. EBITDA      (down $232m y-o-y; down
    Building a

                              profitability management                                                                                    $179m vs. Q1FY21 pro forma) 1
                            > Subsequent to the quarter, Adient launched debt tender offers targeting any and
                              all 9% USD secured notes ($600M in principal outstanding) and up to €177M of             Cash Balance ~$2.1B
                                                                                                                                          (at Dec. 31, 2021)
                              3.5% EUR unsecured notes, continuing its capital structure transformation
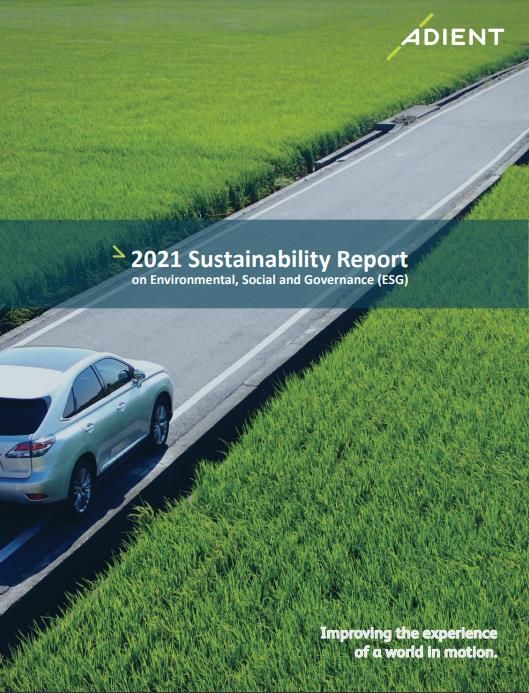
                            > Adient issued its 2021 Sustainability Report — highlighting the company’s             Gross Debt and ~$3.7B and ~$1.6B,
                              commitment to operating its business in an environmentally responsible manner               Net Debt respectively
                              (see slide 6)
1 – Pro forma adjusted for portfolio actions executed in FY21, see appendix for detail
2 – For Non-GAAP and adjusted results, see appendix for detail and reconciliation to U.S. GAAP
FY2022 First Quarter Earnings Call                                                               Adient – PUBLIC                                           Feb. 4, 2022       4
FY2022 First Quarter Earnings Call - February 4, 2022 - Automotive News
Macro environment remains challenging

   As expected, the operating
                                                                           Trending                                           Headwinds                                 Q1FY22 Impact*
    environment in early FY22
                                                                                                     > Supply chain disruptions (semiconductor and
 remains challenging. Despite                                                                          petrochemical shortages) resulting in production
 “green shoots” of stabilization                                             Early signs of
                                                                                                       downtime and lost volume at many customers
                                                                             stabilization
     emerging (i.e., modestly                                                                                                                                               Revenue
                                                                                                     > Operating inefficiencies resulting from production
  softer steel prices and fewer                                                                                                                                             ~$(680)M
                                                                                                       stoppages
 abrupt stoppages in customer
  production schedules), near-                                                                       > COVID-19 related costs                                              Adj.-EBITDA
                                                                           COVID rates
   term results continue to be                                            rising; freight            > Increased freight costs (premiums associated with                    ~$(185)M
     significantly impacted by                                          and labor remain               supply chain disruptions)
                                                                           challenging
       temporary operating                                                                           > Labor shortages
  inefficiencies, COVID related                                                                      > Material economics — steel and chemical prices
 costs, increased freight, labor                                                                       remain elevated
                                                                              Modest
      concerns and elevated                                                                            >   Q1FY22 results better vs. expectations; aided by timing of
                                                                            softening of                                                                                   Adj.-EBITDA
         commodity costs.                                                   steel prices                   certain commercial recoveries
                                                                                                       >   Modest dip in steel prices combined with additional               ~$(3)M
                                                                                                           customer negotiations expected to lessen commodity
*Management’s estimated impact to revenue and Adj.-EBITDA resulting from adverse key events (i.e.,
supply chain disruptions, COVID-19, lost volume, ocean bid, etc.)                                          headwind in FY22 to $95M (previously $125M)
FY2022 First Quarter Earnings Call                                                                          Adient – PUBLIC                                                  Feb. 4, 2022   5
FY2022 First Quarter Earnings Call - February 4, 2022 - Automotive News
Adient’s commitment to sustainability

 Adient is committed to long-term sustainable transformation, which will continue to influence both our products and our operations.
 Our goal is not only to drive environmental change by lessening the impact our business has on the planet, but also to focus on social
 and economic change. Read our Sustainability Report for details.
                                                                                                                  During FY21, Adient conducted a
                                     Adient will continue to meet, collaborate with, and participate with         materiality assessment identifying
                                                                                                                  and prioritizing ESG issues that
                                     organizations around the globe concerning our responsibility and
                                                                                                                  matter most to our business and
                                     commitment to sustainability. Commitments include, but are not
                                                                                                                  stakeholders. We are focused on:
                                     limited to:
                                                                                                              >     Climate Action
                                     > The United Nations (UN) Global Compact, where Adient has               >     Sustainable Materials and
                                       reaffirmed its corporate responsibility to place human rights,               Circular Economy
                                       labor, the environment and anti-corruption considerations at the
                                                                                                              >     Human Rights
                                       top of its mindset
                                                                                                              >     Health and Safety at Work
                                     > The Science-Based Target Initiative (SBTi), where Adient has
                                       committed to ambitious emissions-reduction targets to help limit > Diversity and Inclusion
                                       global warming to 1.5 degrees Celsius                             > Corporate Governance
                                     > The Carbon Disclosure Project (CDP), where Adient reports the
                                       company’s environmental performance to customers and            Adient announced that Tammi
                                       shareholders                                                    Dukes joined the company as Vice
                                                                                                            President, Global Sustainability in
                                                                                                            January 2022

FY2022 First Quarter Earnings Call                                  Adient – PUBLIC                                                     Feb. 4, 2022   6
FY2022 First Quarter Earnings Call - February 4, 2022 - Automotive News
Strengthening our leading position

Adient continues to win new and replacement
                                                               RAM 1500                           Renault Arkana
business in line with internal expectations and
                                                                                              Complete Seat, Foam, Trim,
with continued focus on sustainable / profitable             Complete Seat                             Metals
programs.
In Q1, Adient was awarded the replacement RAM
1500 complete seat business in the Americas,
representing the company’s largest platform by
revenue in FY21.
Adient continues to win EV programs including
platforms introduced by legacy OEMs and new
entrants.

      Porsche E-CUV                  Audi Q8 e-tron   FAW-VW Magotan B9       Mitsubishi Pajero       Ford New EV Crossover
          Metals                        Metals           Complete Seat         Complete Seat              Complete Seat

FY2022 First Quarter Earnings Call                          Adient – PUBLIC                                       Feb. 4, 2022   7
FY2022 First Quarter Earnings Call - February 4, 2022 - Automotive News
In process and upcoming launches

                                      Infiniti QX60             Launch execution continues to be an intense focus for Adient,
                                     Complete Seat              and a key building block to winning new and replacement
                                                                business. While the company is focused on launch processes,
                                                                semiconductor shortages have challenged customer volumes in
                                                                the recent ramp-up periods, creating challenges that we are
                                                                successfully managing through.

                                                                Despite the challenging production environment, Adient
                                                                continues to execute launches at a very high level.

               Ford Everest                       Ford Ranger             Mercedes GLC                 Opel Astra
                   Asia                               Asia                   China                       EMEA

FY2022 First Quarter Earnings Call                              Adient – PUBLIC                                          Feb. 4, 2022   8
FY2022 First Quarter Earnings Call - February 4, 2022 - Automotive News
2022 and beyond
Well-positioned to capitalize on industry recovery - driving shareholder value

                      INDUSTRY INFLUENCES
  > Underlying fundamentals of the auto industry remain strong:
     > Strong consumer demand (supply constrained vs. demand
        constrained)
     > Robust mix of vehicles being produced
     > Inventories at historic lows

                    ADIENT SPECIFIC INFLUENCES
  > Advancing Adient’s “Back to Basics” strategy
      > Focused on operational excellence
      > Disciplined and profitable growth (evidenced by key platform
         wins – new, incumbent, conquest)
      > Solidly on track to transform the balance sheet, enabling
         opportunity to enhance capital allocation strategy                         Significant opportunity to drive
  > Successfully managing through the near-term macro headwinds                   shareholder value underpinned by
    impacting the industry
      > Proactively executing necessary actions to partially offset the            increased earnings and cash flow
         negative impact
FY2022 First Quarter Earnings Call                              Adient – PUBLIC                              Feb. 4, 2022   9
FY2022 First Quarter Earnings Call - February 4, 2022 - Automotive News
Financial Review
FY2022 First Quarter

                       Adient – PUBLIC
Q1 FY2022 Key Financials

                                                              As Reported                                  As Adjusted 1
                 $ millions, except per share data
                                                         Q1 FY22          Q1 FY21               Q1 FY22       Q1 FY21      B/(W)
                        Consolidated
                                                     $       3,480 $           3,848               3,480 $        3,848     (10)%
                        Revenue                                                                                                      $3,975 Q1FY21 pro
                                                                                                                                     forma adjusted for
                        EBIT                         $             40 $           282                61 $           295     (79)%    strategic/footprint
                                                                                                                                           actions
                        Margin                                 1.1%               7.3%              1.8%            7.7%

                        EBITDA                                 N/A               N/A                146 $           378     (61)%
                                                                                                                                       $325 Q1FY21 pro
                        Margin                                                                      4.2%            9.8%
                                                                                                                                      forma adjusted for
                                                                                                                                      strategic/footprint
                        Memo: Equity Income 2        $             33 $             97               34 $            94     (65)%           actions

                        Tax Expense                  $             21 $             52               25 $            51
                        ETR                                        NM           23.1%                NM            21.5%

                        Net Income (Loss)            $         (54) $             150               (36) $          162       NM

                        EPS Diluted                  $       (0.57) $            1.58              (0.38) $         1.71      NM

FY2022 First Quarter Earnings Call                                            Adient – PUBLIC                                       Feb. 4, 2022            11
Q1 FY2022 Revenue:
Consolidated and unconsolidated sales
                                                                                                                                       Regional Performance
                          Consolidated sales                                                                   (consolidated sales y-o-y growth (vs. Q1 FY21 pro forma) by region) 1, 2

                   $127
                                                                                                                                           Q1                        Q1 IHS Production
                                          $(422)     $(73)
                                                                                         Americas                                       -12.6%                                    -14.7%
     $3,848                      $3,975                      $3,480
                                                                                         EMEA                                           -18.4%                                    -26.6%
                                                                                         Asia                                            7.2%                                      -8.4%
                                                                                         Note: China                                      6.3%                                     -5.6%

                                                                                         Note: Asia excl. China                           8.3%                                     -12.4%
     Q1 FY21     Pro Forma   Q1 FY21      Volume /     FX    Q1 FY22
                           1
                Adjustments Pro Forma      Pricing                                          Adient consolidated sales in line with internal expectations:
                               Adj.

                                                                       consolidated
                                                                                            > Achieved growth over market in each region
            Unconsolidated seating sales 1
                                                                                            > Adient’s customer mix in Korea and Japan were less impacted by supply chain disruptions --
                                                                                              driving outperformance in the region; China benefited from increased volumes on startup EV
                                              Year-over-year                                  platforms with Adient content (NIO and Xpeng)
                                                increase ~4%                                2 – Growth rates at constant foreign exchange, and adjusted for pro forma strategic actions (Asia - $193M, EMEA - $(43)M, Americas - $(20)M)
                                              (adjusted for fx
                               $1,208 M        and pro forma           unconsolidated
               $1,161 M                     strategic/footprint                             > Unconsolidated sales increased y-o-y when adjusting for strategic portfolio changes.
                                                   actions)                                 > The y-o-y increase was driven by outperformance in China, primarily underpinned by strong
                Pro Forma        Q1FY22                                                       sales at Adient’s Keiper joint venture
                 Q1FY21
   1 - See Appendix for pro forma adjustment details
FY2022 First Quarter Earnings Call                                                      Adient – PUBLIC                                                                                                     Feb. 4, 2022               12
Q1 FY22 Adjusted-EBITDA
Q1FY22 adjusted EBITDA of $146M, down $179M y-o-y (adjusting for
portfolio actions executed in FY21)
                                                                                                                                      $(53)
>       As expected entering the quarter, numerous macro factors including            $ in millions
                                                                                                                       $378
        supply chain disruptions (and resulting operating inefficiencies) and                                                                       $325          $(102)
        increased freight costs had a significant impact on the quarter                                                                                                           $(60)          $(9)          $(5)            $(3)
                                                                                                                                                                                                                                           $146
Key drivers of the y-o-y comparison:
                                                                                                                      Q1FY21 Pro Forma            Q1FY21         Volume /  Business             SG&A           Equity       FX /     Q1FY22
>    Lower volume primarily driven by supply chain disruptions at our                                                        Adjustment            1 Forma
                                                                                                                                                 Pro               Mix    Performance                         Income     Commodities
     customers of ~$102M                                                                                                                            Adj.

>       Adverse business performance of ~$60M, driven by:                                      $378
         > Temporary operating inefficiencies (resulting from unplanned
             production stoppages at our customers) and increased freight                                                              $325                  $1
             of ~$38M                                                                                              $(53)
         > Lower y-o-y commercial settlements (Q1FY21 abnormally high
             and contained $30M of non-recurring settlements)
                                                                                              9.8%
Other headwinds included higher SG&A costs of ~$9M (primarily driven by                                                                                                       $(118)
                                                                                                                                      8.2%                                                                                                   $146
adverse events in Q1FY22 (Malaysia flooding and certain legal settlements)
                                                                                                                                                                                                    $(61)                $(1)
and modestly lower equity income of ~$5M
Net commodity headwind ($3M in Q1FY22) was better than initially                                                                                                                                                                             4.2%
expected -- aided by better-than-expected commercial recoveries and
contractual agreement in Europe (Q1FY22 prices negotiated in early 2021;
                                                                                            Q1FY21            Pro Forma   Q1FY21                            Asia             Americas              EMEA                  Corp              Q1FY22
increase set to take effect in Q2FY22)                                                                                  1
                                                                                                             Adjustments Pro Forma
                                                                                                                            Adj.
        1 - See Appendix for pro forma adjustment details          Note: Corporate includes central costs that are not allocated back to the operations, currently including executive offices, communications, finance, corporate development, and legal
    FY2022 First Quarter Earnings Call                                                         Adient – PUBLIC                                                                                                          Feb. 4, 2022              13
Cash flow

                                                        Free Cash Flow (1)                                               Key drivers impacting Q1FY22 FCF:
                                                                                     FY22              FY21
                    (in $ millions)                                                 Q1 FY22           Q1 FY21            (-) Lower y-o-y earnings (driven by lower
                                                                                                                         volumes -- supply chain related)
                    Adjusted-EBITDA                                             $        146      $        378
                                                                                                                         (-) Timing and level of commercial settlements
                    (+/-) Net Equity in Earnings                                         (32)              (93)
                                                                                                                         (-) Lower level of equity income (driven by
                    (-) Restructuring                                                    (24)              (55)
                                                                                                                         China strategic transactions)
                    (+/-) Net Customer Tooling                                                2               (8)
                    (+/-) Trade Working Capital (Net AR/AP + Inventory)                     75             250           (-) Typical month-to-month working capital
                    (+/-) Accrued Compensation                                           (61)              (19)
                                                                                                                         movements
                    (-) Interest paid                                                    (41)              (66)          (+) Reduced interest expense as balance sheet
                    (-) Taxes paid                                                          (8)            (12)          transformation takes shape
                    (-) Non-income related taxes (VAT)                                      36             (67)          (+) Lower restructuring, (trending to
                    (-) Commercial settlements                                           (54)                 (9)        normalized levels)
                    (+/-) Other                                                          (53)              (68)
                                                                                                                         (+) Reduced VAT tax payments (related to
                    Operating Cash flow                                         $        (14)     $        231
                                                                                                                         government approved deferrals into FY23)
                    (-) CapEx (2)                                                        (60)              (71)
                                                                                                                         (+) Reduced CapEx
                    Free Cash flow                                              $        (74)     $        160

    1 - Free cash flow defined as operating cash flow less CapEx
    2 - CapEx by segment for the quarter: Americas $23M, EMEA $24M, Asia $13M

FY2022 First Quarter Earnings Call                                                                     Adient – PUBLIC                                    Feb. 4, 2022    14
Debt and capital structure
                                                                                                                                         Net Debt
         ($ in millions)                                             12/31/2021
                                                                                                  Includes $625M                             December 31    September 30
         Cash & Debt Profile                                          Amount                        of proceeds        (in $ millions)           2021           2021
         Cash & Cash Equivalents                                    $       2,080                 collected as final
                                                                                                   payment from        Cash                  $      2,080   $       1,521
         ABL Revolver, incl. FILO due 2024 (1)                                -                       the China
         Term Loan B due 2028                                                 995                      strategic       Total Debt                   3,656           3,696
         9.00% Secured Notes due 2025                                         600                   transaction
                                                                                                                       Net Debt              $      1,576   $       2,175
         Total Secured Debt                                                 1,595
                                                                                                 > Total liquidity of ~$3.0B at December 31, 2021 (cash on hand of
         European Investment Bank Loan                                        152                  ~$2.1B and ~$880M of undrawn capacity under the revolving
         3.50% Notes (€1,000mm) due 2024                                    1,132
                                                                                                   line of credit)
         4.875% Notes due 2026                                                795
         Other LT debt                                                            1              > Subsequent to the quarter, Adient initiated $800M in debt
         Other Bank Borrowings                                                 11                  tender offers targeting any and all 9.0% notes ($600M in
         Deferred issuance costs                                              (30)                 principal outstanding), and up to €177M of 3.5% Euro notes
         Total Debt                                                         3,656
         (1)
                                                                                                 > In January 2022, Adient completed its agreement with Boxun to
           Subject to ABL borrowing base availability. As of December 31, 2021, there
         were no draws outstanding and approximately $880 million was available under
                                                                                                   purchase Boxun’s 25% equity interest in CQADNT (ADNT’s stake
         the ABL Credit Agreement.                                                                 now at 100%); total payment to Boxun of ~$200M for their
                                                                                                   equity interest, historical dividends and other ($15M paid in
                                                                                                   Q1FY22, the balance paid in Q2FY22)

                                     Adient is solidly on track to make a transformational change to its capital structure
FY2022 First Quarter Earnings Call                                                      Adient – PUBLIC                                                     Feb. 4, 2022    15
FY22 Outlook – key financial metrics

                Consolidated sales                                             ~$14.8B                                         >        FY22 guidance updated to reflect Adient’s YTD
                                                                               No change
                                                                                                                                        results thru December 31, 2021, planned debt
                                                                    Modestly lower vs. FY21 pro
                     Adj.-EBITDA                                     forma results of $810M
                                                                                                                                        paydown and current market conditions
                                                                            No change
                                                                                                                               >        Consolidated sales of ~$14.8B (based on Jan. IHS
                    Equity Income                                                ~$90M                                                  forecast)
                  Incl. in Adj.-EBITDA                                     Prior: ~$80-90M
                                                                                                                               >        Interest expense forecast at ~$150M (reflects
                  Interest Expense                                             ~$150M                                                   ~$1B of debt repayments planned in FY22)
                                                                                No change
                                                                                                                               >        Cash taxes forecast at ~$80M
                       Cash taxes                                                ~$80M                                         >        Capital expenditures forecast between ~$300M -
                                                                                No change
                                                                                                                                        $325M (primarily driven by customer launch
                           CapEx                                       ~$300M - $325M                                                   plans)
                                                                                No change

                Despite early signs certain macro factors impacting the industry are beginning to stabilize, the current operating
          environment remains challenging (i.e., ongoing supply chain disruptions, limited visibility of customer production schedules
             and labor concerns). As such, providing specific full year fiscal 2022 guidance for Adj.-EBITDA and free cash flow with
               reasonable confidence is not possible at this time. Adient will provide updates as appropriate as FY22 progresses
  Reconciliations of non-GAAP measures related to FY2022 guidance have not been provided due to the unreasonable efforts it would take to provide such reconciliations

FY2022 First Quarter Earnings Call                                                                                           Adient – PUBLIC                                            Feb. 4, 2022   16
Influences that could change the narrative on FY2022

                                                     Positive influences                        Negative influences

                                             > Faster–than-expected ramp in
                                               vehicle production (supply chain          > Prolonged supply chain disruptions
                                               issues resolved or substantially
                                                                                         > Instability in vehicle production (if
                                               improved)
                                                                                           production ramps too fast) driven
                                             > Steady and consistent operating             from lack of underlying support
                                               patterns at Adient’s customers –            such as labor or non-chip related
                                               ability to run at rate                      part shortages
                                             > Significant pull-back in COVID-19         > Significant increase in COVID-19
                                               cases – driving down absenteeism            cases – driving up absenteeism
                                             > Stabilization of labor (availability &    > Geopolitical shock to financial
                                               cost)                                       markets / economy
                                             > Significant drop in commodity prices

               Although we are encouraged signs of stabilization for certain macro factors are emerging, we continue
                to monitor a number of external influences that could significantly change the narrative on FY2022

FY2022 First Quarter Earnings Call                                Adient – PUBLIC                                      Feb. 4, 2022   17
Appendix and
financial reconciliations
FY 2022 First Quarter

                            Adient – PUBLIC
Q1 FY22 Adjusted-EBITDA: Americas
                                                                                                                      Despite improved launch performance and lower tooling,
Q1FY22 of $9M, down $118M y-o-y (adjusting for portfolio
                                                                                                                      business performance was significantly impacted by temporary
actions executed in FY21)                                                                                             operating inefficiencies resulting from supply chain disruptions,
>    As expected entering the quarter, numerous macro                                                                 nonrecurrence of FY21 commercial settlements, and continued
                                                                   $ in millions                                      constrained production environment
     factors including supply chain disruptions (and
     resulting operating inefficiencies) and increased freight
     costs had a significant impact on the quarter                  $132
                                                                                                     $127             $4
Key drivers of the y-o-y comparison:
>    Adverse business performance of $62M driven by:
        > Lower y-o-y commercial settlements of ~$37M
                                                                                     $(5)
            (Q1FY21 abnormally high due to timing /
            calendarization of settlements)
        > Temporary operating inefficiencies and
            premiums (resulting from unplanned production            7.6%
            stoppages at our customers) of $10M                                                          7.4%
                                                                                                                                      $(62)
        > Increased freight, labor costs, volume driven
            inefficiencies, and other costs
>    Lower volume and mix primarily driven by supply chain
     disruptions at our customers of ~$54M (mix adversely
     impacted by certain Q1FY22 launches)                                                                                                                                                        $9
>    To a lesser extent, the y-o-y comparison was impacted                                                                                              $(54)               $(6)                 0.6%
     by increased commodity prices of ~$5M (Q1FY22 was             Q1FY21           Pro Forma 1 Q1FY21               SG&A         Business             Volume /           FX /                  Q1FY22
     aided by timing of certain recoveries) and unfavorable                        Adjustments Pro Forma                         Performance             Mix           Commodities
     FX of ~$1M                                                                                   Adj.
>    These negative headwinds were partially offset by
     improved launch performance, tooling and improved           1 - See Appendix for pro forma adjustment details
     SG&A performance

FY2022 First Quarter Earnings Call                                                     Adient – PUBLIC                                                                           Feb. 4, 2022         19
Q1 FY22 Adjusted-EBITDA: EMEA
Q1FY22 of $43M, down $61M y-o-y (adjusting for
                                                                $ in millions
portfolio actions executed in FY21)
>    As expected entering the quarter, numerous macro
     factors including supply chain disruptions (and              $114
     resulting operating inefficiencies) and increased                                                                            $2
                                                                                                     $104               $4
     freight costs had a significant impact on the quarter
Key drivers of the y-o-y comparison:                                              $(10)
>    Lower volume and mix of ~62M driven primarily by
     supply chain disruptions at our customers
>        Equity income was lower for the quarter by ~$5M         7.1%
         resulting from lower volumes and fx                                                        6.7%
>        These headwinds were partially offset by lower                                                                                                                  $43
         SG&A costs of ~$4M due to improved efficiencies                                                                                   $(62)
>        Commodities were favorable by ~$4M in Q1FY22 --
                                                                                                                                                       $(5)
                                                                                                                                                                         3.5%
         Q1FY22 commodity contracts negotiated in early
         FY21, price increases expected to take effect in
         Q2FY22
                                                                Q1FY21           Pro Forma 1 Q1FY21                SG&A         FX /       Volume /    Equity           Q1FY22
>        Business performance included ~$18M of favorable
                                                                                Adjustments Pro Forma                        Commodities     Mix      Income
         y-o-y commercial settlements and other business                                       Adj.
         performance, generally offset by temporary
         operating inefficiencies and increased freight costs

                                                                    1 - See Appendix for pro forma adjustment details

    FY2022 First Quarter Earnings Call                                                   Adient – PUBLIC                                                 Feb. 4, 2022      20
Q1 FY22 Adjusted-EBITDA: Asia

Q1FY22 of $114M, up $1M y-o-y (adjusting for         $ in millions
portfolio actions executed in FY21)
Key drivers of the y-o-y comparison:                  $151
>    Increased volume and mix of about $14M
     (Adient customer mix benefited the quarter)                                                                      $14
                                                                                               $113                                                                                                       $114
>    The positive impact of improved volume and                                                                                            $(7)
                                                                           $(38)                                                                                $(4)                 $(2)
     mix was partially offset by increased SG&A of
     ~$7M, primarily related to the impact of
     Malaysia flooding (insurance deductible) and    10.8%*
     increased engineering costs                                                                                                                                                                          9.9%*
                                                                                               10.2%*
>    Business performance was down ~$4M,
     negatively impacted by increased freight and
     launch costs (timing of certain launches)
>    FX and commodities were a net ~$2M
     headwind
                                                     Q1FY21            Pro Forma   Q1FY21                          Volume /                $-
                                                                                                                                          SG&A            Business       $-/
                                                                                                                                                                        FX                             Q1FY22
                                                                                 1
                                                                      Adjustments Pro Forma                          Mix                                 Performance Commodities
                                                                                     Adj.

                                                              * Excluding equity income. Including equity income, margins of 27.3%, 15.0% and 14.5% for Q1FY21, Q1FY21 pro forma adjusted and Q1FY22, respectively

                                                        1 - See Appendix for pro forma adjustment details

 FY2022 First Quarter Earnings Call                                                Adient – PUBLIC                                                                                         Feb. 4, 2022              21
Non-GAAP financial measurements
Adjusted EBIT, Adjusted EBIT margin, Adjusted EBITDA, Adjusted EBITDA margin, Adjusted net income attributable to Adient, Adjusted effective tax rate, Adjusted earnings per share, Adjusted equity income,
Adjusted interest expense, Free cash flow and Net debt as well as other measures presented on an adjusted basis are not recognized terms under U.S. GAAP and do not purport to be alternatives to the most
comparable U.S. GAAP amounts. Since all companies do not use identical calculations, our definition and presentation of these measures may not be comparable to similarly titled measures reported by other
companies. Management uses the identified non-GAAP measures to evaluate the operating performance of the Company and its business segments and to forecast future periods. Management believes these
non-GAAP measures assist investors and other interested parties in evaluating Adient's on-going operations and provide important supplemental information to management and investors regarding financial and
business trends relating to Adient's financial condition and results of operations. Investors should not consider these non-GAAP measures as alternatives to the related GAAP measures. Reconciliations of non-
GAAP measures to their closest U.S. GAAP equivalent are presented below. Reconciliations of non-GAAP measures related to guidance for any future period have not been provided due to the unreasonable
efforts it would take to provide such reconciliations.

Adjusted EBIT is defined as income before income taxes and noncontrolling interests excluding net financing charges, restructuring, impairment and related costs, purchase accounting amortization, transaction
gains/losses, other significant non-recurring items, and net mark-to-market adjustments on pension and postretirement plans. Adjusted EBIT margin is adjusted EBIT as a percentage of net sales.
Adjusted EBITDA is defined as adjusted EBIT excluding depreciation and stock based compensation. Certain corporate-related costs are not allocated to the business segments in determining Adjusted EBITDA. Adjusted
EBITDA margin is adjusted EBITDA as a percentage of net sales. Adjusted EBITDA excluding adjusted equity income, each as defined herein, is also presented.
Adjusted net income attributable to Adient is defined as net income attributable to Adient excluding restructuring, impairment and related costs, purchase accounting amortization, transaction gains/losses, expenses
associated with becoming an independent company, other significant non-recurring items, net mark-to-market adjustments on pension and postretirement plans, the tax impact of these items and other discrete tax
charges/benefits.
Adjusted effective tax rate is defined as adjusted income tax provision as a percentage of adjusted income before income taxes.
Adjusted earnings per share is defined as Adjusted net income attributable to Adient divided by diluted weighted average shares.
Adjusted equity income is defined as equity income excluding amortization of Adient's intangible assets related to its non-consolidated joint ventures and other unusual or one-time items impacting equity income.
Adjusted interest expense is defined as net financing charges excluding unusual or one-time items impacting interest expense.
Free cash flow is defined as cash provided by operating activities less capital expenditures.
Net debt is calculated as gross debt (short-term and long-term) less cash and cash equivalents.
Adient is also making pro forma adjustments to fiscal 2021 financial information to reflect the impacts of certain transactions as described below. Adient believes these pro forma adjustments provide helpful comparisons
between the current year and prior year results by adjusting the prior year to be on a consistent basis with the current year.
"Americas footprint actions" and "EMEA footprint actions" refer to miscellaneous closures / roll off of business.
"EMEA deconsolidation" refers to sale of a metals business in Turkey effective October 1, 2021 to a nonconsolidated JV in which Adient retains a noncontrolling interest.
"China strategic transaction" refers to the disposition of the YFAS JV and consolidation of CQADNT and LFADNT, all of which were effective on September 30,2021.
"China footprint actions" refers to divestitures of smaller, non-core businesses (i.e., remaining fabrics business and Futuris entity).

   FY2022 First Quarter Earnings Call                                                                 Adient – PUBLIC                                                                             Feb. 4, 2022        22
Non-GAAP Reconciliations - EBIT, Adj.-EBIT, Adj.-EBITDA, Adj.-Equity Income, and Adj.-EBITDA excluding
 Adj.-Equity Income
                                                                                                            Three months ended December 31
                                                                                                          2021                          2020
       (in $ millions)                                                                     GAAP           Adj.    Adjusted    GAAP      Adj.          Adjusted

       Net sales                                                                       $ 3,480        $       -    $ 3,480     $ 3,848     $     -    $ 3,848
       Cost of sales (1)                                                                 3,307               (1)     3,306       3,507           5      3,512
                                                                                                                                                                               Adjusted EBITDA excluding adjusted Equity Income
       Gross profit                                                                          173              1         174         341         (5)        336                                                       Three Months Ended
       Selling, general and administrative expenses           (2)
                                                                                             162            (15)        147         149        (14)        135                                                           December 31
       Restructuring and impairment costs (3)                                                     4          (4)          -           7         (7)          -    (in $ millions)                                     2021        2020
                              (4)
       Equity income (loss)                                                                   33              1          34          97        (3)          94
       Earnings (loss) before interest and income taxes (EBIT)                         $      40      $      21    $     61    $    282    $   13     $    295
                                                                                                                                                                  Adjusted EBITDA                                $    146     $         378
                                                                        Ebit margin:        1.15%                      1.75%       7.33%                  7.67%
                                                Ebit margin excluding Equity Income:        0.20%                      0.78%       4.81%                  5.22%   Adjusted Equity Income                               34                94

       Memo accounts:                                                                                                                                             Adj. EBITDA Excluding Adj. Equity Income       $    112     $         472
       Depreciation                                                                                                      75                                 70                                                        3.2%              7.4%
       Stock based compensation costs                                                                                    10                                 13
       Adjusted EBITDA                                                                                             $    146                           $    378
                                                           Adjusted EBITDA margin:                                     4.20%                              9.82%
                                    Adjusted EBITDA margin excluding Equity Income:                                    3.22%                              7.38%
                                                                                                            Three months ended December 31
                                                                                                          2021                          2020
       Restructuring related charges                                                                  $      (1)                           $    (3)
       Brazil indirect tax recoveries                                                                         1                                  8
       Other                                                                                                 (1)                                 -
       1
           Cost of sales adjustment                                                                   $      (1)                           $     5
       Purchase accounting amortization                                                               $     (13)                           $   (10)
       Transaction costs                                                                                     (2)                                (4)
       2
           Selling, general and administrative adjustment                                             $     (15)                           $   (14)
       Restructuring charges                                                                          $       3                            $    (1)
                                                                                                                                                 -
       Held for sale and other adjustments                                                                   (7)                                (6)
       3
           Restructuring and impairment costs                                                         $      (4)                           $    (7)
       Gain on previously held interest at YFAS in an affiliate                                       $       -                            $    (5)
       Restructuring related charges                                                                          -                                  1
       Purchase accounting amortization                                                                       1                                  1
       4
           Equity income adjustment                                                                   $       1                            $    (3)
FY2022 First Quarter Earnings Call                                                                                                   Adient – PUBLIC                                                                     Feb. 4, 2022          23
Non-GAAP Reconciliations - Adjusted Net Income and Adjusted EPS

                                                  Adjusted Net Income                                                                                Adjusted Diluted EPS
                                                                                       Three Months Ended                                                                      Three Months Ended
                                                                                           December 31                                                                             December 31
      (in $ millions)                                                                    2021       2020                                                                        2021        2020
      Net income (loss) attributable to Adient                                         $    (54)    $    150         Diluted earnings (loss) per share as reported             $ (0.57)    $      1.58
      Restructuring and impairment costs                                                      4            7         Restructuring and impairment costs                           0.04            0.07

      Purchase accounting amortization                                                       14           11         Purchase accounting amortization                             0.15            0.12
      Restructuring related charges                                                           1            4         Restructuring related charges                                0.01            0.04
      Derivative loss on Yanfeng transaction                                                  3             -        Derivative loss on Yanfeng transaction                       0.03               -

      Interest accretion on deferred consideration                                             -          (1)        Interest accretion on deferred consideration                     -        (0.01)
      Other items (1)                                                                         2           (9)        Other items (1)                                              0.02         (0.09)

      Impact of adjustments on noncontrolling interests (2)                                  (2)          (1)        Impact of adjustments on noncontrolling interests (2)        (0.02)       (0.01)
      Tax impact of above adjustments and other tax items (3)                                (4)           1         Tax impact of above adjustments and other tax items (3)     (0.04)           0.01
      Adjusted net income (loss) attributable to Adient                                $    (36)    $    162         Adjusted diluted earnings (loss) per share                $ (0.38)    $      1.71
                                                                                       Three Months Ended
                                                                                           December 31
                                                                                         2021       2020
      Transaction Costs                                                                $     (2) $      (4)
      Brazil indirect tax recoveries                                                          1          8
      Gain on previously held interest at YFAS in an affiliate                                -          5
      Other                                                                                  (1)         -
      1
          Other items                                                                  $     (2)    $      9
      2
       Reflects the impact of adjustments, primarily purchase accounting amortization on noncontrolling interests.
      Brazil indirect tax recoveries                                                   $     (3) $         3
      Other reconciling items                                                                (1)          (2)
      3
          Income tax provision (benefit)                                               $     (4)    $      1

FY2022 First Quarter Earnings Call                                                                 Adient – PUBLIC                                                                 Feb. 4, 2022          24
Non-GAAP Reconciliations - Adjusted Income before Income Taxes and Effective Tax Rate

                                                                        Adjusted Income before Income Taxes

                                                                                                            Three Months Ended December 31
                          (in $ millions)                                                          2021                                       2020
                                                                                    Income (loss)                               Income (loss)
                                                                                   before Income Tax impact Effective          before Income Tax impact Effective
                                                                                        Taxes                tax rate               Taxes                tax rate
                                                        As reported                $           (9) $    21     NM              $          225 $     52    23.1%

                                                      Adjustments (1)                           24              4     16.7%               12              (1)   -8.3%
                                                        As adjusted                $            15 $        25        NM       $         237 $        51        21.5%

                                                                                                                 Three Months Ended December 31
                                                                                                         2021                                      2020

                          Brazil indirect tax recoveries                                             $          (3)                            $          3
                          Other reconciling items                                                               (1)                                       (2)
                          1
                              Tax provision (benefit) adjustment                                     $          (4)                            $          1

FY2022 First Quarter Earnings Call                                                 Adient – PUBLIC                                                                      Feb. 4, 2022   25
Non-GAAP Reconciliations - Pro forma fiscal year 2021 reconciliations

(in $ millions)
Net Sales                              Q1            Q2            Q3            Q4           FY2021                Adjusted EBITDA                   Q1          Q2          Q3              Q4              FY2021

Americas - as reported:                $ 1,737       $ 1,644       $ 1,440       $ 1,343      $    6,164            Americas - as reported:           $    132    $     64    $        23      $        13    $   232
  Americas footprint actions               (20)          -             -              (1)            (21)             Americas footprint actions            (5)          1         -                    (1)        (5)
Americas - pro forma                     1,717         1,644         1,440         1,342           6,143            Americas - pro forma                   127          65             23               12        227

EMEA - as reported:                         1,604         1,636         1,328          996         5,564            EMEA - as reported:                    114         141             22           -             277
  EMEA JV deconsolidation                     (25)          (28)          (11)         (35)          (99)             EMEA JV deconsolidation               (4)         (5)        -                    (8)       (17)
  EMEA footprint actions                      (18)           (7)           (6)           1           (30)             EMEA footprint actions                (6)         (2)            (1)              (1)       (10)
EMEA - pro forma                            1,561         1,601         1,311          962         5,435            EMEA - pro forma                       104         134             21               (9)       250

Asia - as reported:                          554           588           516           465         2,123            Asia - as reported:                    151         121          92              122           486
   China strategic transactions              234           199           231           227           891               China strategic transactions        (31)         (2)         10              (38)          (61)
   China footprint actions                   (44)          (33)          (31)          (13)         (121)              China footprint actions              (7)         (5)         (2)             -             (14)
Asia - pro forma                             744           754           716           679         2,893            Asia - pro forma                       113         114         100                84          411

Elimination/corporate:                        (47)          (49)          (42)         (33)         (171)           Elimination/corporate:                 (19)        (23)        (19)             (17)          (78)

Total Adient - as reported                  3,848         3,819         3,242         2,771       13,680            Total Adient - as reported             378         303         118              118           917
Total Adient - pro forma                    3,975         3,950         3,425         2,950       14,300            Total Adient - pro forma               325         290         125               70           810

  FY2022 First Quarter Earnings Call                                                              Adient – PUBLIC                                                                            Feb. 4, 2022         26
Segment Performance
                                                                            Q1 2021                                                                    Q1 2022
                                                                                            Corporate/                                                                 Corporate/
                                                   Americas     EMEA           AP                        Consolidated       Americas      EMEA            AP                        Consolidated
                                                                                           Eliminations                                                               Eliminations
                          Net Sales                    1,737      1,604             554             (47)        3,848           1,498       1,230              784             (32)        3,480
                          Adjusted EBITDA                132        114             151             (19)          378               9          43              114             (20)          146
                          Adjusted Equity Income         -            3              91             -              94              (1)         (1)              36             -              34
                          Depreciation                     28        33               9             -              70              31          31               13             -              75
                          Amortization                      3         3               4             -              10               3           1                9             -              13
                          Capex                            36        31               4             -              71              23          24               13             -              60

                                                                            Q2 2021                                                                    Q2 2022
                                                                                            Corporate/                                                                 Corporate/
                                                   Americas     EMEA           AP                        Consolidated       Americas      EMEA            AP                         Consolidated
                                                                                           Eliminations                                                               Eliminations
                          Net Sales                    1,644      1,636             588             (49)        3,819
                          Adjusted EBITDA                  64       141             121             (23)          303
                          Adjusted Equity Income         -            2              51             -              53
                          Depreciation                     28        32               9             -              69
                          Capex                            29        20               6             -              55

                                                                            Q3 2021                                                                    Q3 2022
                                                                                            Corporate/                                                                 Corporate/
                                                   Americas     EMEA           AP                        Consolidated       Americas      EMEA            AP                         Consolidated
                                                                                           Eliminations                                                               Eliminations
                          Net Sales                    1,440      1,328             516             (42)        3,242
                          Adjusted EBITDA                  23        22              92             (19)          118
                          Adjusted Equity Income         -            1              38             -              39
                          Depreciation                     32        33               6             -              71
                          Capex                            32        20               8             -              60

                                                                            Q4 2021                                                                    Q4 2022
                                                                                            Corporate/                                                                 Corporate/
                                                   Americas     EMEA           AP                        Consolidated       Americas      EMEA            AP                         Consolidated
                                                                                           Eliminations                                                               Eliminations
                          Net Sales                    1,343       996              465             (33)        2,771
                          Adjusted EBITDA                 13       -                122             (17)          118
                          Adjusted Equity Income          (1)         1              85             -              85
                          Depreciation                    33         34               8             -              75
                          Capex                           34         32               8             -              74

                                                                          Full Year 2021                                                             Full Year 2022

                                                                                            Corporate/                                                                 Corporate/
                                                   Americas     EMEA           AP                        Consolidated       Americas      EMEA            AP                        Consolidated
                                                                                           Eliminations                                                               Eliminations
                          Net Sales                    6,164      5,564          2,123             (171)       13,680           1,498       1,230              784             (32)        3,480
                          Adjusted EBITDA                232        277            486              (78)          917               9          43              114             (20)          146
                          Adjusted Equity Income          (1)         7            265              -             271              (1)         (1)              36             -              34
                          Depreciation                   121        132             32              -             285              31          31               13             -              75
                          Capex                          131        103             26              -             260              23          24               13             -              60

FY2022 First Quarter Earnings Call                                                                                      Adient – PUBLIC                                                             Feb. 4, 2022   27
You can also read