Impacts of simulated erosion and soil amendments on greenhouse gas fluxes and maize yield in Miamian soil of central Ohio - CyberLeninka
←
→
Page content transcription
If your browser does not render page correctly, please read the page content below
www.nature.com/scientificreports

                        OPEN          Impacts of simulated erosion and
                                      soil amendments on greenhouse
                                      gas fluxes and maize yield in
Received: 5 September 2017
Accepted: 18 December 2017            Miamian soil of central Ohio
Published: xx xx xxxx
                                      Yanru Liang1, Rattan Lal2, Shengli Guo1,3, Ruiqiang Liu2 & Yaxian Hu3

                                      Erosion-induced topsoil loss is a threat to sustainable productivity. Topsoil removal from, or added to,
                                      the existing surface is an efficient technique to simulate on-site soil erosion and deposition. A
                                      15-year simulated erosion was conducted at Waterman Farm of Ohio State University to assess impacts
                                      of topsoil depth on greenhouse gas (GHG) emissions and maize yield. Three topsoil treatments were
                                      investigated: 20 cm topsoil removal, 20 cm topsoil addition, and undisturbed control. Results show
                                      that the average global warming potential (GWP) (Mg CO2 Eq ha−1 growing season−1) from the topsoil
                                      removal plot (18.07) exhibited roughly the same value as that from the undisturbed control plot
                                      (18.11), but declined evidently from the topsoil addition plot (10.58). Maize yield decreased by 51% at
                                      the topsoil removal plot, while increased by 47% at the topsoil addition plot, when compared with the
                                      undisturbed control (7.45 Mg ha−1). The average GWP of erosion-deposition process was 21% lower
                                      than that of the undisturbed control, but that greenhouse gas intensity (GHGI) was 22% higher due
                                      to lower yields from the topsoil removal plot. Organic manure application enhanced GWP by 15%,
                                      and promoted maize yield by 18%, but brought a small reduction GHGI (3%) against the N-fertilizer
                                      application.

                                      In agricultural ecosystem, sustainable food production and mitigation of greenhouse gas (GHG) emissions
                                      have been concerned by agricultural or environmental scientists, especially under future climate conditions.
                                      Accelerated erosion is one of the most prevalent forms of soil degradation in the world1,2, which poses major
                                      threat to food security3 and a significant impact on GHG emissions4. Erosion translocate sediment and soil
                                      organic C laterally across landscapes (0.5–0.6 Pg C year−1)5, potentially causing approximately 0.8–1.2 Gt C
                                      year−1 emissions into the atmosphere, while burying 0.4–0.6 Gt C year−1 by deposition processes2. Although
                                      erosion-induced GHG emissions are dominated by CO2, the fluxes of CH4 and N2O are also considerable6. IPCC
                                      (Intergovernmental Panel on Climate Change) (2007) stated7 that the emissions of N2O and CH4 have global
                                      warming potentials (GWPs) of 310 and 21 times that of CO2, which have not yet been adequately investigated.
                                      Soil erosion comprises three stages: detachment, transport/redistribution, and deposition8. The first two stages,
                                      detachment and transportation, lead to increased mineralization and emission of CO2. However, the prevalence
                                      of anaerobic conditions at the depositional stage reduces the emission of CO2 and leads to flux of CH4 and N2O9.
                                      Up to now, there is no systematically assessment on grain yield and GHG emissions under soil erosion-deposition
                                      events.
                                          In fact, it is difficult to detect the decline of productivity that results from erosion directly, because the pro-
                                      ductivity reduction caused by erosion often occurs so slowly that it may not be recognized until crop production
                                      is no longer economically viable10. Moreover, improved technology often masks productivity decline caused by
                                      erosion, leading to increased rather than decreased yields4,10. Various indirect methods (e.g., the comparative-plot
                                      method, transect method, and desurfacing experiments) have been carried out extensively in the study of
                                      erosion-productivity relationships10. The simplest method is to artificially remove topsoil (which is also referred

                                      1
                                       College of Natural Resources and Environment, Northwest A&F University, Yangling, 712100, Shaanxi, P.R. China.
                                      2
                                       Carbon Management and Sequestration Center, School of Environment and Natural Resources, The Ohio State
                                      University, Columbus, 43210, OH, USA. 3Institute of Soil and Water Conservation, Northwest A&F University,
                                      Yangling, 712100, Shaanxi, P.R. China. Rattan Lal and Shengli Guo contributed equally to this work. Correspondence
                                      and requests for materials should be addressed to R.L. (email: lal.l@osu.edu) or S.G. (email: slguo@ms.iswc.ac.cn)

        Scientific REpOrtS | (2018) 8:520 | DOI:10.1038/s41598-017-18922-6                                                                                 1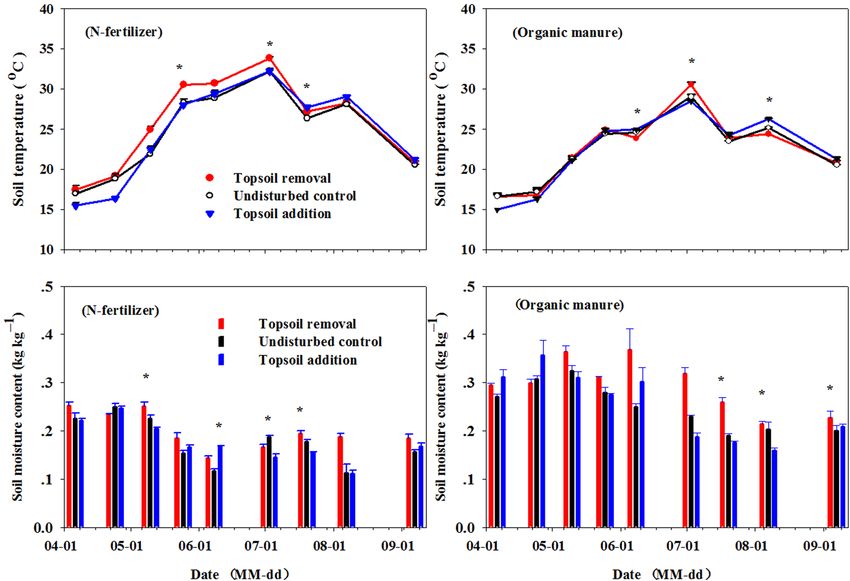
www.nature.com/scientificreports/
Figure 1. Daily temperature and precipitation distribution in 2012; the inset shows the cumulative monthly
precipitation and the mean monthly temperature.
to as desurfacing experiments10,11). Previous studies have reported that the yield reduction rate was faster after the
top 40 cm soil was eroded, but became slower if the deeper soil was lost12. Moreover, desurfacing approach can
also help eliminate the inherent variability of topsoil depth and landscape position13.
Restoration of degraded soils is a high priority in global scale4. When soil carbon pool in degraded crop-
land increased by one ton, crop yield would increase by 20–40 kg ha−1 for wheat, 10–20 kg ha−1 for maize, and
0.5–1 kg ha−1 for cowpeas2. Substantial studies have reported the restored productivity of de-surfaced soils by
amending with fertilizer or manure14–16.
In this study, we investigated the impacts of simulated soil erosion-deposition (after 15 years of establishment)
on greenhouse gas (GHG; CO2, N2O, and CH4) emissions and maize yield, via topsoil depth (TSD) removal and
addition8,17 treatments during the growing season, under N-fertilizer and organic manure amendments with
no-till management.
Results
Soil temperature, moisture and GHG emissions. Figure 1 displays the diurnal air temperature and
precipitation distribution in 2012; the inset shows the cumulative monthly precipitation and mean monthly tem-
perature in 2012 (OARDC). Mean air temperature showed an increase from April (11.55 °C) to July (26.53 °C),
followed by a decrease thereafter. Monthly cumulative precipitation varied between 3.69 and 7.96 cm from April
to September, with the highest precipitation in September and lowest precipitation in August.
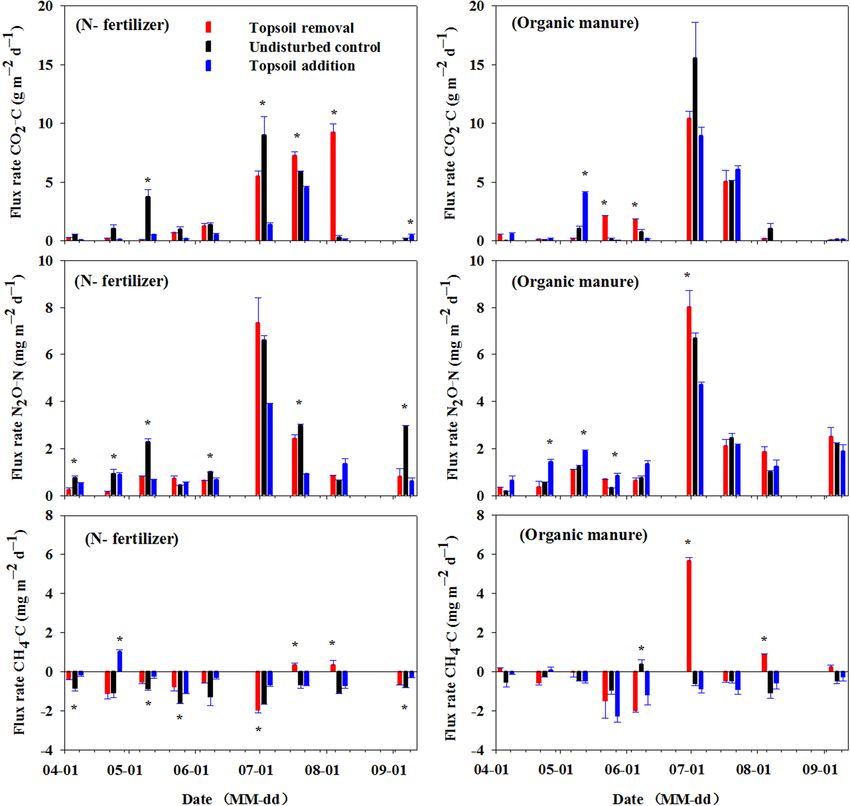
Figure 2 shows the variation of soil temperature and soil moisture content at 0–10 cm impacted by simu-
lated erosion under N-fertilizer and organic manure application during the growing season in 2012. Like air
temperature, soil temperature showed an increase from April to July, followed by a decrease thereafter. During
the growing season, mean soil temperatures for the three TSD treatments were 25.65, 24.75, and 24.92 °C respec-
tively for top soil removal, undisturbed control, and topsoil addition. Obviously higher soil temperature trend
was observed for topsoil removal under N-fertilizer application. While, mean soil moisture content for topsoil
removal was significantly higher than other two TSD treatments (P = 0.0372) at 10 cm depth.
Figure 3 shows the effects of simulated erosion on CO2 fluxes under N-fertilizer and organic manure appli-
cation during the growing season in 2012. All three TSD treatments were persistent CO 2 sources both for
N-fertilizer and organic manure application during the study. Soil CO2 fluxes differed among seasons, which
stirred by fertilizer application and reached the maxima at the peak of air temperature and corn growth18. Under
N-fertilizer application, CO2 fluxes in all three TSD treatments were below 4 g C m−2 d−1 from April 6th to June
8th, 2012. CO2 fluxes increased sharply from July to August, and observed the maximum fluxes (g C m−2 d−1) on
August 7th (9.22), July 3rd (8.98) and July 20th (4.55) respectively for topsoil removal, undisturbed control and
topsoil addition. For organic manure application, peak CO2 fluxes (g C m−2 d−1) appeared on July 3rd, which were
10.4, 15.54 and 8.94 respectively for topsoil removal, undisturbed control and topsoil addition. For N-fertilizer
application, there was a 19% increase in the topsoil removal treatment and a 67% decrease in the topsoil addi-
tion treatment compared with undisturbed control (Table 1). For soil receiving organic manure, no significant
difference observed among the three TSD treatments (Table 1). Average cumulative CO2 emissions for the entire
growing season significantly differed among the three TSD treatments (P = 0.0003) (Table 2).
Figure 3 shows the effects of simulated erosion on N2O fluxes under N-fertilizer and organic manure appli-
cation during the growing season in 2012. Three TSD treatments were also persistent sources of N2O fluxes both
for receiving N-fertilizer and organic manure during the study. Soil N2O fluxes also displayed a small increase
on May 10th after the fertilizer application, and a peak flux coincided with the peak air and soil temperatures in
July. The results indicate that the CO2 and N2O fluxes were stimulated by fertilizer application and soil temper-
ature rise. N2O fluxes fluctuated below 3 mg N m−2 d−1 from April to June, and rose rapidly from June 8th, got
the maxima fluxes on July 3rd both under N-fertilizer application (7.35, 6.59 and 3.90 mg N m−2 d−1 respectively
for topsoil removal, undisturbed control and topsoil addition) and organic manure application (8.02, 6.70 and
4.71 mg N m−2 d−1 respectively for topsoil removal, undisturbed control and topsoil addition), then declined to
the original level (
www.nature.com/scientificreports/

                              Figure 2. Soil temperature and soil moisture content affected by simulated erosion under N-fertilizer and
                              organic manure application during the growing season in 2012. The error bar represent the standard error
                              (n = 3). The asterisk (*) represents statistical significance within a sampling date at p ≤ 0.05.

                              the N2O emission often characterized by a short time of very high flux rates that make up a substantial part of the
                              total annual loss19. Under N-fertilizer application, cumulative N2O emission decreased by 19% and 42% respec-
                              tively for topsoil removal and topsoil addition treatments, compared with the undisturbed control (Table 1). For
                              organic manure application, cumulative N2O emission increased by 16% for topsoil removal compared with the
                              undisturbed control, and no significant difference was observed between the undisturbed control and topsoil
                              addition (Table 1). Average cumulative N2O emissions for the entire growing season significantly differed among
                              the three TSD treatments (P < 0.0001) (Table 2).
                                  Figure 3 shows the effects of simulated erosion on CH4 fluxes under N-fertilizer and organic manure applica-
                              tion during the growing season in 2012. Under N-fertilizer application, CH4 fluxes in the three TSD treatments
                              were generally low (i.e., averaged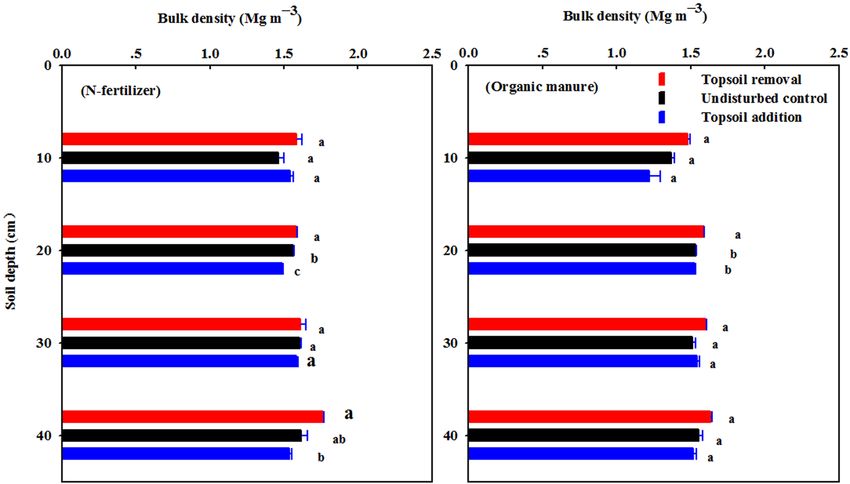
www.nature.com/scientificreports/

                              Figure 3. Daily CO2, N2O and CH4 fluxes affected by simulated erosion under N-fertilizer and organic manure
                              application during the growing season in 2012. The error bar represent the standard error (n = 3). The asterisk
                              (*) represents statistical significance within a sampling date at p ≤ 0.05.

                               Treatment             CO2–C (Mg ha−1)   N2O–N (kg ha−1)    CH4–C (kg ha−1)   GWP     GHGI
                               N-fertilizer
                               Topsoil removal       5.11 ± 0.03a      2.73 ± 0.09b       −0.92 ± 0.00b     20.04   5.12
                               Undisturbed control   4.30 ± 0.06b      3.38 ± 0.01a       −1.78 ± 0.01a     17.36   2.40
                               Topsoil addition      1.44 ± 0.02c      1.95 ± 0.01c       −0.58 ± 0.04c     6.21    0.69
                               Organic manure
                               Topsoil removal       3.98 ± 0.01       3.41 ± 0.01a       0.57 ± 0.13a      16.27   4.98
                               Undisturbed control   4.80 ± 0.42       2.94 ± 0.00b       −0.77 ± 0.13b     19.01   2.48
                               Topsoil addition      3.72 ± 0.04       2.98 ± 0.00b       −1.24 ± 0.18b     15.06   1.16

                              Table 1. Effects of simulated erosion on cumulative greenhouse gas (GHG) emissions, global warming
                              potential (GWP), greenhouse gas intensity (GHGI) under two fertilizer application during a growing season.
                              Values are given as mean ± s.e.m. (n = 3). Values in each column followed by different letters are statistically
                              different at p ≤ 0.05. GWP (Mg CO2 Eq ha−1 growing season−1) = CH4 × 21 + N2O × 310 + CO2 GHGI (Mg
                              CO2 Eq Mg grain yield growing season−1) = GWP/grain yield

                              among the three TSD treatments both under N-fertilizer (at 20 and 40 cm soil layer depth), and organic manure
                              (20 cm soil layer depth) application. Soil bulk density for soil receiving organic manure was lower than soil with
                              N-fertilizer application at every soil layer depth from 0–40 cm, with significant difference observed at 0–10 cm
                              soil layer depth.

Scientific REpOrtS | (2018) 8:520 | DOI:10.1038/s41598-017-18922-6                                                                               4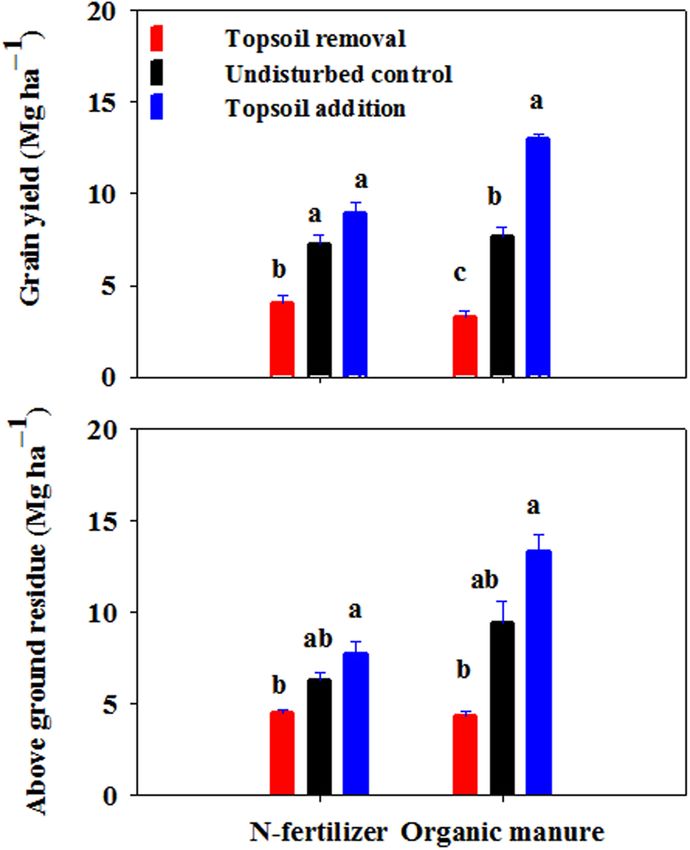
www.nature.com/scientificreports/

                                                  P>F
                                                  Grain yield   Above ground residue CO2   N2O     CH4
                               Fertilizer         NS            0.0151              0.0345
www.nature.com/scientificreports/
Figure 5. SOC and SON affected by simulated erosion under N-fertilizer and organic manure application.
The error bars represent the standard error (n = 3). Values in each soil depth followed by different letters are
statistically different at p ≤ 0.05.
The above ground residue decreased (by 28% under N-fertilizer, by 54% under organic manure) for topsoil
removal, and increased (by 23% under N-fertilizer, by 41% under organic manure) for topsoil addition, compared
with the undisturbed control (6.31 Mg ha−1 under N-fertilizer, 9.46 Mg ha−1 under organic manure. The average
above ground residue of topsoil removal and topsoil addition decreased by 2% under N-fertilizer application,
and decreased by 7% under organic manure application compared with the undisturbed control (6.31 Mg ha−1
under N-fertilizer, 9.46 Mg ha−1 under organic manure). Significant difference were observed among three TSD
treatments both for grain yield (P < 0.001) and above ground residue (P = 0.0256) (Table 2).
Discussion
Topsoil remove and addition can not only significantly affect the greenhouse gases emissions, but also changes
the crop yield (Table 1 and Fig. 6), which indicated that the erosion-deposition process can significantly alter the
global warming effects, soil nutrient status and soil productivity during the erosion events.
The average cumulative CO2 emission in our study was 3.89 Mg C ha−1 growing season−1; the value fell into
the range of seasonal CO2 emission reported by several global studies20,25–27. In the present study, cumulative CO2
emission significantly increased following 20 cm topsoil removal and decreased following 20 cm topsoil addi-
tion throughout the maize growing season compared with the undisturbed soil under N-fertilizer application
(Table 1). The difference of cumulative CO2 emissions among three TSD treatments could be explained by the
soil temperature variation that caused by aboveground coverage shade28. Soil temperature was the primary drive
Scientific REpOrtS | (2018) 8:520 | DOI:10.1038/s41598-017-18922-6 6www.nature.com/scientificreports/
Figure 6. Grain yield and above ground residue affected by simulated erosion under N-fertilizer and organic
manure application in 2012. The error bars represent the standard error (n = 3). Values in each soil depth
followed by different letters are statistically different at p ≤ 0.05.
to CO2 flux21,28–31. The enhanced cumulative CO2 emission at the eroded site may primarily result from its higher
soil temperature of 25.9 °C (from 17.5 to 33.9 °C) with less aboveground coverage shade. The reduced cumulative
CO2 emission at the depositional site probably due to its lower soil temperature of 24.7 °C (from 15.5 to 32.2 °C)
owing to its dense above ground coverage shade (Figs 2 and 6). In addition, the reduced cumulative CO2 emis-
sions at depositional site probably also caused by their lower substrate availability (e.g., SOC)28 in surface soil
(Table 1 and Fig. 5). While, under organic manure application, no significant difference observed among the three
TSD treatments for cumulative CO2 emissions (Table 1), which probably due to their similar average soil temper-
atures (respectively 22.6, 22.5 and 22.5 °C) (Fig. 2). It was worthwhile to note that the cumulative CO2 emission
for the organic manure applied plot (4.16 Mg C ha−1 growing season−1) was much greater than that from the
plot receiving N-fertilizer (3.62 Mg C ha−1 growing season−1) (P = 0.0345). This was probably due to the greater
carbon substrate (SOC) under organic manure application20 (Fig. 5). Soil moisture content did not respond to the
cumulative CO2 emission in our study, probably because the soil seldom underwent prolonged drought28. Similar
results also reported by Sheng et al. (2010). Smith et al. reported that the release of CO2 by aerobic respiration is
primarily driven by soil temperature, but becomes moisture-dependent as soil dries out32.
Among the three TSD treatments, undisturbed plot exhibited the largest cumulative N2O emission under
N-fertilizer application. This can possibly attribute to the greater SOC and total N content in 0–20 cm soil layer
depth (Table 2 and Fig. 5), as N2O emission depended on SOC and total nitrogen contents, bulk density, clay
fraction and soil moisture content that regulates N2O production via microbial de-nitrification as well as nitrifi-
cation33. The second largest cumulative N2O emission was at the eroded site under N-fertilizer, which might due
to its higher soil temperature32 and greater soil bulk density (Table 2, Figs 2 and 4). The results are in good line
with previous studies conducted with an intensively farmed organic soil in North Central Ohio, which reported
that N2O flux was positively related to soil temperature and CO2 flux34. The least cumulative N2O emission at the
depositional site may be determined by its lower soil temperature and lower SOC, total N content (Table 2, Figs 2
and 5). In addition, the eroded site displayed the highest cumulative N2O emission under organic manure appli-
cation, probably ascribed to the anaerobic conditions35 in soil pore space caused by higher soil moisture content
and greater soil bulk density (Figs 2 and 4). The result is in agreement with a previous report that N2O emissions
as a result of denitrification occurred in compaction treatment36. Flessa et al., reported that total N2O emission
from the potato field during the growing season was 2.0 (kg N ha−1 growing season−1) in 199819, and Kumar et
al., resulted 2.89 (kg N ha−1 year−1) of N2O emission from corn–corn cropping rotation in an Alfisol of Ohio in
201226, which were similar to our results of average cumulative N2O emission (2.9 kg N ha−1 growing season−1)
in corn field in 2012.
In this study, cumulative CH4 emission was positive at the eroded site under organic manure application,
which was probably due to the hypoxic conditions35 that may have been caused by the relatively greater soil
moisture (Fig. 2). Cumulative CH4 emissions from other TSD treatments were negative, which indicated the net
CH4 sink during the growing season (Table 1). The low values and net uptake of CH4 reported in our study were
consistent with those reported for cultivated soils25,37. Toma et al., (2011) reported that CH4 fluxes in grassland
soils were −1.07 (kg C ha−1 growing season−1) in 2008 and −1.62 (kg C ha−1 growing season−1) in 200935, which
Scientific REpOrtS | (2018) 8:520 | DOI:10.1038/s41598-017-18922-6 7www.nature.com/scientificreports/
was similar to our results of average cumulative CH4 emission (−0.79 kg C ha−1 growing season−1) in agricultural
soils in 2012. Despite the very low N2O flux from, and CH4 adsorption by, the corn land in our study, the flux of
N2O and CH4, as two major greenhouse gases, should be studied further.
In our study, the average GWP at the eroded site (18.07 Mg CO2 Eq ha−1 growing season−1) generated roughly
the same value with the undisturbed control (18.11 Mg CO2 Eq ha−1 growing season−1), but declined dramatically
at the depositional site (10.58 Mg CO2 Eq ha−1 growing season−1). The cumulative GHG emission at the eroded
site might be stimulated via the higher soil temperature caused by its less aboveground coverage shade, but lim-
ited by its lower available C substrate. The cumulative GHG emission at the depositional site declined because of
its lower soil temperature and lower available C substrate in surface. In addition, the cumulative GHG emission
may also be influenced by soil bulk density and soil moisture content. The results displayed that eroded site can
neither play a net sink nor net source of greenhouse gases emission, while depositional site can be a net sink of
GHG emission.
It is critical to consider the overall (net) effect of the erosion and deposition processes in comparison with
undisturbed soil (the control). Therefore, in this paper, we compared important parameters for undisturbed con-
trol with the average values observed for the combination of the topsoil removal and topsoil addition conditions.
The average value of GWP of eroded and depositional site was 21% lower than that of the undisturbed control,
indicated the erosion- deposition process could be net sink of GHG emission.
Average GWP for soil receiving organic manure was increased by 15%, compared with that with N-fertilizer
application. This might be due to the greater SOC and total N content and the higher soil moisture content after
organic manure application (Figs 2 and 5).
Given the limited accessibility to the experimental field, gas fluxes were only collected once every 2 weeks.
There might be other peaks in GHG fluxes that were not captured during our sampling regime. More frequent
sampling intervals are highly recommended in the further study.
In our study, the average maize yield significantly decreased by 51% at eroded site, and significantly increased
by 47% at depositional site compared with the undisturbed control (7.45 Mg ha−1) (P < 0.0001), which was
coincide with maize yields on two Alfisols in central Ohio38, and consistent with the finding that the corn yield
declined by nearly half (46%) on removal of 20 cm of the topsoil in an eroded farmland of Chinese Mollisols16.
Crop yield usually adversely affected by the impedance of root growth, water and nutrient deficits, high bulk
density, penetrometer resistance, and low field moisture capacity under erosion10,11,16. On the one hand, topsoil
removal significantly declined the SOC and total N content, increased the soil bulk density, and further reduced
the maize yield at the eroded site. On the other hand, the topsoil addition buried the former topsoil under plough
depth, preserved SOC from decomposition and mineralization22–24,39, promoted deep root growth, and conse-
quently resulted to greater crop productivity (Figs 4, 5 and 6). This result agree with the findings that the impacts
of erosion on agricultural land are usually negative for eroded sites and may be positive for depositional sites40,41.
The average value of maize yield of eroded and depositional site declined by 2% compared with the undis-
turbed control (7.45 Mg ha−1), which indicate the erosion-deposition process resulted the equivalent production
with the uneroded site.
Maize yield at the organic manure applied plot (7.97 Mg ha−1) increased by 18% compared with that from the
plot receiving N-fertilizer (6.74 Mg ha−1). This was probably caused by the improved SOC, total N content and
soil moisture content with organic manure application (Figs 2 and 5).
The average value of GHGI was 4.96, 2.43 and 0.96 Mg CO2 Eq Mg−1 grain yield growing season−1, respec-
tively for eroded site, undisturbed control and depositional site. The eroded site enhanced the GHGI because of
its lower grain yield, while the depositional site declined the GHGI due to its lower GWP and higher grain yield.
The average GHGI of erosion-depositional site increased by 22% compared to the undisturbed control. The aver-
age GHGI for soil receiving organic manure exhibited a small reduction of 3% compared with that of N-fertilizer
application.
In summary, our results displayed that eroded site can neither play a net sink nor net source of greenhouse
gases emission, while depositional site can be a net sink of GHG emission. Eroded site significantly reduced maize
yield, while depositional site significantly enhanced the maize yield. The erosion-deposition process declined the
GWP, not changed maize yield, and increased the GHGI. Soil with organic manure application enhanced GWP,
improved maize yield and slightly reduced GHGI compared with soil receiving N-fertilizer.
It was worthwhile to note that our results were merely concluded based on the assumption that the area of
erosion equals the area of deposition. However, in natural field, eros ion tends to be dissipated over much wider
area, while eroded materials often end in areas not suitable for crop growth (river beds, estuaries, etc.) or water
bodies (wetlands, reservoirs, ocean). The weight of GHG emissions from eroded area could have been much
larger, and depositional zone may have led to additional CH4 emissions. This calls for systematic investigation in
the future study.
Methods
Study area. The study was conducted in an on-going long-term experiment at Waterman Farm of the Ohio
State University, Columbus, OH, USA (N + 40° 1′ 5.52″ E −83° 2′ 29.72″). The experiment was initiated in 1997
on the Crosby soil series (deep, fine, mixed, active, mesic, Aeric Epiaqualf). The deep soil developed on nearly
level topography (0% to 2% slopes) is of silt loam texture, poorly drained and derived from glacial till. The mean
annual rainfall is 1016 mm and the mean annual air temperature is 11 °C 8.
The experiments were designed in a split-plot arrangement with completely randomized blocks. Three TSD
levels were carried out as main plots and two amendment types as subplots. The 18 × 9 m main plots were sub-
divided into 6 × 4.5 m subplots, with three replications for each treatment combination. The main plots were
separated by 2.7 m long border strips8,38. Three TSD levels created once at the beginning of the experiment to sim-
ulated soil erosion- deposition process, which were: (1) topsoil removal (eroded site) created by physically remove
Scientific REpOrtS | (2018) 8:520 | DOI:10.1038/s41598-017-18922-6 8www.nature.com/scientificreports/
of 20 cm topsoil with a landscape loader; (2) undisturbed control (uneroded site); and (3) topsoil addition (dep-
ositional site) achieved by deposit of 20 cm topsoil on soil surface. Two amendments were applied in this study:
N-fertilizer and organic manure. For the plots receiving N-fertilizer, 150 kg N ha−1 urea-ammonium nitrate (28%
N) was side-banded on the soil surface at the 3rd to 4th leaf stage of corn growth. For the plots receiving organic
manure, dry matter compost (20 Mg ha−1) was uniformly top dressed during April each year.
CO2, N2O and CH4 flux measurements. Soil-air samples for the assessment of CO2, N2O and CH4 fluxes
were collected using the static chamber method42. Gas chambers were made of polyvinyl chloride (PVC) pipes
of 15 cm diameter and 30 cm length. The top lid was made of a PVC cap, and the lower end was trimmed to be
inserted into the soil. A machine-trimmed PVC trough was coupled around the outer ring of the pipe, approxi-
mately 5 cm from the top. The PVC cap was equipped with a sampling port and a rubber septum on the top, and
the cap bottom could be fitted into the trough when the cap was in place42,43.
The chambers were inserted 10 cm deep into the ground at each sampling point, with three replications for
each treatment. Chambers were installed 1 month before gas sampling, and the chambers remained in place
with the cap opened during the entire growing season, except for temporary removal during seeding or fertilizer
application. Chambers were reinstalled in the same place immediately after the fertilizer and seeding operations
were completed34.
When sampling, closed the chamber lid, taken approximately 10 cm3 soil-air samples from each chamber
headspace at 0 and 30 minutes, and transferred it to crimp sealed pre-evacuated 10 ml vials fitted with butyl
rubber septa. The vials were evacuated to a pressure of −172 kPa and prepared 1 day before sampling. Soil-air
samples were obtained between 11 AM and 2 PM when fluxes were expected to be maximal43 biweekly during the
entire growing season. Three replications were taken for each treatment.
The CO2 and CH4 in soil-air samples were analyzed using a GC-2014 gas chromatograph (GC; Shimadzu,
Kyoto, Japan) equipped with a thermal conductivity detector for CO2, and a flame ionization detector for CH4.
N2O was analyzed on a GC fitted with a 63Ni electron capture detector34.
Soil temperature and moisture measurements. Soil samples for measurements of soil temperature
and soil moisture content were collected biweekly in conjunction with soil-air sampling18. Soil temperatures at
10 cm soil depth were monitored by using a digital thermometer near each chamber simultaneously with gas
sampling. Gravimetric soil moisture content was also determined by collecting soil samples close to the chambers
at 0–10 cm depth.
Analysis of soil properties. Bulk and intact core samples were obtained separately in June 2012 to measure
soil properties. Intact core soil samples for bulk density analysis were collected at 0–40 cm depth (10 cm intervals)
using a manually-driven core sampler with diameter and height both 5 cm. Gravimetric soil moisture content
(SMC) was measured by drying a portion of trimmed core samples at 105 °C for 24 h19. Wet bulk density was
computed as the ratio of soil wet weight to core volume, and soil bulk density was calculated from the wet bulk
density and soil moisture content, ρb = ρb′/(1 + w), where ρb is soil bulk density, ρb′ is soil wet bulk density, and w
is the gravimetric moisture content. Total porosity was calculated from the equation44: f = 1 − (ρb′/ρs), where ρs
is the soil particle density and is estimated at 2.65 g cm−3. Bulk soil samples were air-dried at room temperature,
ground with a wooden hammer, and sieved through a 2 mm sieve before physical and chemical analysis38. Soil
total C and N contents were analyzed by the dry combustion method using a vario Max CN analyzer (Elementar,
Hanau, Germany)18. The SOC was assumed to be equal to the total C as inorganic C concentration was negligible
with the soil pH was below 738.
Crop yield. Corn (Zea mays L.) was grown from about mid-May to October in 2012 without any major dis-
turbances, and no tillage operation was performed. Corn plants from the center two rows of each plot were hand
harvested. Crop residue after the harvest was left on the soil surface.
Corn ears were separated from the stover and weighed. Corn ears were shelled, and grains were weighed sepa-
rately from other parts of the ear after air drying. Subsamples of grain were weighed and then oven-dried at 60 °C
for 48 h to determine the water content38. Grain yields are reported in Mg ha–1 at 12% moisture content.
Data calculations and statistical analysis. Daily gas fluxes (q) (in units of g CO2–C m−2 d−1 or mg
N2O − N m−2 d−1 or mg CH4 − C m−2 d−1) were computed using Eq. (1)34,42:
ΔCO2 − C or ΔN2O − N or CH4 − C V
q = k
Δt A (1)
where (ΔCO2–C or ΔN2O–N or ΔCH4–C)/Δt is the rate of gaseous accumulation inside the chamber (e.g., g
CO2–C m−3 air min−1, mg N2O–N m−3 air min−1 or mg CH4–C m−3 air min−1), V is the volume of the chamber
(m3), A is the surface area coverd by the chamber (m2), and k is a time conversion factor (1440 min day−1).
Seasonal gas emissions were estimated as the cumulative amount of CO2, N2O or CH4 emitted during the
growing season. Recalculations were made through linear interpolation of two neighboring measured fluxes and
numerical integration over time, per Eq. (2)45:
n
N N
CO2 − C or N2O − N or CH4 − C = ∑(xi + xi+1) × + + (xn −1 + xn) ×
2 2
i (2)
Scientific REpOrtS | (2018) 8:520 | DOI:10.1038/s41598-017-18922-6 9www.nature.com/scientificreports/
where i = date of the first measurement taken of CO2 or N2O or CH4 rate, n = date of the last measurement taken
of CO2, N2O or CH4 rate; x = CO2 rate (g m2 d−1), N2O rate (mg m2 d−1) or CH4 rate (mg m2 d−1); and N = num-
ber of days between the two consecutive CO2, N2O or CH4 rate measurements.
The CO2 equivalents were computed by Eq. (3), converting the cumulative GHG emission to GWP, using
factors of 310 and 21 for N2O and CH4, respectively34:
GWP = CH4 × 21 + N2O × 310 + CO2(Mg CO2Eq ha−1growing season−1) (3)
The greenhouse gas intensity (GHGI) was calculated by dividing GWP by crop yield using Eq. (4) : 46
GHGI = GWP/grain yield(Mg CO2 Eq Mg grain yield growing season−1) (4)
Statistical analysis was performed using the analysis of variance (ANOVA) procedure available in SAS 8.01
for Windows (1999–2000, SAS Institute Inc., Cary, NC, USA). Mean and interactive effects of treatments were
separated using the F-protected least significant difference test. The probability level (P) chosen to designate sig-
nificance was ≤0.05. Correlation and regression analyses were performed on selected variables at P ≤ 0.1 using
the same package.
Data availability statement. The datasets generated during the current study are available from the cor-
responding author on reasonable request.
References
1. Gregorich, E. G., Greer, K. J., Anderson, D. W. & Liang, B. C. Carbon distribution and losses: erosion and deposition effects. Soil Till.
Res. 47, 291–302 (1998).
2. Lal, R. Soil carbon sequestration impacts on global climate change and food security. Science 304, 1623–1627 (2004).
3. Vogel, E., Deumlich, D. & Kaupenjohann, M. Bioenergy maize and soil erosion - Risk assessment and erosion control concepts.
Geoderma 261, 80–92 (2016).
4. Lal, R. Soil Erosion Impact on Agronomic Productivity and Environment Quality. Crit. Rev. Plant Sci. 17, 319–464 (1998).
5. Van Oost, K. et al. The impact of agricultural soil erosion on the global carbon cycle. Science 318, 626–629 (2007).
6. Worrall, F., Burt, T. P. & Howden, N. J. K. The fluvial flux of particulate organic matter from the UK: the emission factor of soil
erosion. Earth Surf. Proc. Land. 41, 61–71 (2016).
7. IPCC. Climate Change: The Physical Science Basis. Contribution of Working Group I to the Fourth Assessment Report of the
Intergovernmental Panel on Climate Change. Cambridge, United Kingdom and New York, NY, USA, Cambridge University Press
(2007).
8. Srinivasan, V., Maheswarappa, H. P. & Lal, R. Long term effects of topsoil depth and amendments on particulate and non particulate
carbon fractions in a Miamian soil of Central Ohio. Soil Till. Res. 121, 10–17 (2012).
9. Lal, R. & Pimentel, D. Soil Erosion: A Carbon Sink or Source? Science 319, 1040–1042 (2008).
10. Bakker, M. M., Govers, G. & Rounsevell, M. D. A. The crop productivity-erosion relationship: an analysis based on experimental
work. Catena 57, 55–76 (2004).
11. Oyedele, D. J. & Aina, P. O. Response of soil properties and maize yield to simulated erosion by artificial topsoil removal. Plant Soil
284, 375–384 (2006).
12. Gao, X. F., Xie, Y., Liu, G., Liu, B. Y. & Duan, X. W. Effects of soil erosion on soybean yield as estimated by simulating gradually
eroded soil profiles. Soil Till. Res. 145, 126–134 (2015).
13. Larney, F. J., Olson, B. M., Janzen, H. H. & Lindwall, C. W. Early impact of topsoil removal and soil amendments on crop
productivity. Agron. J. 92, 948–956 (2000).
14. Larney, F. J., Janzen, H. H., Olson, B. M. & Olson, A. F. Erosion-productivity-soil amendment relationships for wheat over 16 years.
Soil Till. Res. 103, 73–83 (2009).
15. Salako, F. K. et al. Soil strength and maize yield after topsoil removal and application of nutrient amendments on a gravelly Alfisol
toposequence. Soil Till. Res. 94, 21–35 (2007).
16. Sui, Y. Y. et al. Differentiating the early impacts of topsoil removal and soil amendments on crop performance/productivity of corn
and soybean in eroded farmland of Chinese Mollisols. Field Crop Res. 111, 276–283 (2009).
17. Mukherjee, A., Lal, R. & Zimmerman, A. R. Effects of biochar and other amendments on the physical properties and greenhouse gas
emissions of an artificially degraded soil. Sci. Total Environ. 487, 26–36 (2014).
18. Shrestha, R. K., Lal, R. & Rimal, B. Soil carbon fluxes and balances and soil properties of organically amended no-till corn
production systems. Geoderma 197, 177–185 (2013).
19. Flessa, H. et al. N2O and CH4 fluxes in potato fields: automated measurement, management effects and temporal variation.
Geoderma 105, 307–325 (2002).
20. Ding, W., Meng, L., Yin, Y., Cai, Z. & Zheng, X. CO2 emission in an intensively cultivated loam as affected by long-term application
of organic manure and nitrogen fertilizer. Soil Biol. Biochem. 39, 669–679 (2007).
21. Bajracharya, R. M., Lal, R. & Kimble, J. M. Erosion effects on carbon dioxide concentration and carbon flux from an Ohio alfisol. Soil
Sci. Soc. Am. J. 64, 694–700 (2000).
22. Lal, R. Soil erosion and the global carbon budget. Environ. Int 29, 437–450 (2003).
23. SalomÉ, C., Nunan, N., Pouteau, V., Lerch, T. Z. & Chenu, C. Carbon dynamics in topsoil and in subsoil may be controlled by
different regulatory mechanisms. Global Change Biol. 16, 416–426 (2010).
24. Vandenbygaart, A. J., Kroetsch, D., Gregorich, E. G. & Lobb, D. Soil C erosion and burial in cropland. Global Change Biol. 18,
1441–1452 (2012).
25. Omonode, R. A., Vyn, T. J., Smith, D. R., Hegymegi, P. & Gál, A. Soil carbon dioxide and methane fluxes from long-term tillage
systems in continuous corn and corn–soybean rotations. Soil Till. Res. 95, 182–195 (2007).
26. Kumar, S., Nakajima, T., Kadono, A., Lal, R. & Fausey, N. Long-term tillage and drainage influences on greenhouse gas fluxes from
a poorly drained soil of central Ohio. J. Soil Water Cons. 69, 553–563 (2014).
27. Lenka, N. K. & Lal, R. Soil aggregation and greenhouse gas flux after 15 years of wheat straw and fertilizer management in a no-till
system. Soil Till. Res. 126, 78–89 (2013).
28. Sheng, H. et al. The dynamic response of soil respiration to land-use changes in subtropical China. Global Change Biol. 16,
1107–1121 (2010).
29. Shrestha, B. M., Sitaula, B. K., Singh, B. R. & Bajracharya, R. M. Fluxes of CO2 and CH4 in soil profiles of a mountainous watershed
of Nepal as influenced by land use, temperature, moisture and substrate addition. Nutr. Cycl. Agroecosys. 68, 155–164 (2004).
30. Boone, R. D., Nadelhoffer, K. J., Canary, J. D. & Kaye, J. P. Roots exert a strong influence on the temperature sensitivity of soil
respiration. Nature 396, 570–572 (1998).
Scientific REpOrtS | (2018) 8:520 | DOI:10.1038/s41598-017-18922-6 10www.nature.com/scientificreports/
31. Kirschbaum, M. U. F. The temperature dependence of soil organic matter decomposition and the effect of global warming on soil
organic matter storage. Soil Biol. Biochem. 27, 753–760 (1995).
32. Smith, K. A. et al. Exchange of greenhouse gases between soil and atmosphere: interactions of soil physical factors and biological
processes. Eur. J. Soil Sci. 54, 779–791 (2003).
33. Gu, J. et al. Regulatory effects of soil properties on background N2O emissions from agricultural soils in China. Plant Soil 295, 53–65
(2007).
34. Elder, J. W. & Lal, R. Tillage effects on gaseous emissions from an intensively farmed organic soil in North Central Ohio. Soil Till.
Res. 98, 45–55 (2008).
35. Toma, Y. O. et al. Carbon budget and methane and nitrous oxide emissions over the growing season in a Miscanthus sinensis
grassland in Tomakomai, Hokkaido, Japan. GCB Bioenergy 3, 116–134 (2011).
36. Ruser, R. et al. Emission of N2O, N2 and CO2 from soil fertilized with nitrate effect of compaction, soil moisture and rewetting. Soil
Biol. Biochem. 38, 263–274 (2006).
37. Jacinthe, P. A. & Lal, R. Labile carbon and methane uptake as affected by tillage intensity in a Mollisol. Soil Till. Res. 80, 35–45 (2005).
38. Jagadamma, S., Lal, R. & Rimal, B. K. Effects of topsoil depth and soil amendments on corn yield and properties of two Alfisols in
central Ohio. J. Soil Water Conserv. 64, 70–80 (2009).
39. Quinton, J. N., Govers, G., Van Oost, K. & Bardgett, R. D. The impact of agricultural soil erosion on biogeochemical cycling. Nat.
Geosci. 3, 311–314 (2010).
40. Quine, T. A. & van Oost, K. Quantifying carbon sequestration as a result of soil erosion and deposition: retrospective assessment
using caesium-137 and carbon inventories. Global Change Biol. 13, 2610–2625 (2007).
41. Ritchie, J. C., McCarty, G. W., Venteris, E. R. & Kaspar, T. C. Soil and soil organic carbon redistribution on the landscape.
Geomorphology 89, 163–171 (2007).
42. Jacinthe, P. A. & Dick, W. A. Soil management and nitrous oxide emissions from cultivated fields in southern Ohio. Soil Till. Res. 41,
221–235 (1997).
43. Jacinthe, P. A. & Lal, R. Spatial variability of soil properties and trace gas fluxes in reclaimed mine land of southeastern Ohio.
Geoderma 136, 598–608 (2006).
44. Beare, M. H., Gregorich, E. G. & St-Georges, P. Compaction effects on CO2 and N2O production during drying and rewetting of soil.
Soil Biol. Biochem. 41, 611–621 (2009).
45. Mancinelli, R., Marinari, S., Di Felice, V., Savin, M. C. & Campiglia, E. Soil property, CO2 emission and aridity index as
agroecological indicators to assess the mineralization of cover crop green manure in a Mediterranean environment. Ecol. Indic. 34,
31–40 (2013).
46. Shang, Q. et al. Net annual global warming potential and greenhouse gas intensity in Chinese double rice-cropping systems: a 3-year
field measurement in long-term fertilizer experiments. Global Change Biol. 17, 2196–2210 (2011).
Acknowledgements
The authors sincerely thank Mr. Basant Rimal for technical help in analyzing the samples.
Author Contributions
R.L.1 and S.G. conceived and designd the experiments; Y.L. conducted the experiments and wrote the manuscript;
Y.L. and S.G. interpreted the results; R.L.1, S.G. and Y.H. commented on the manuscript; R.L.2 took part in the
experiments; and all authors reviewed the manuscript. (R.L.1 is Rattan Lal; R.L.2 is Ruiqiang Liu).
Additional Information
Competing Interests: The authors declare that they have no competing interests.
Publisher's note: Springer Nature remains neutral with regard to jurisdictional claims in published maps and
institutional affiliations.
Open Access This article is licensed under a Creative Commons Attribution 4.0 International
License, which permits use, sharing, adaptation, distribution and reproduction in any medium or
format, as long as you give appropriate credit to the original author(s) and the source, provide a link to the Cre-
ative Commons license, and indicate if changes were made. The images or other third party material in this
article are included in the article’s Creative Commons license, unless indicated otherwise in a credit line to the
material. If material is not included in the article’s Creative Commons license and your intended use is not per-
mitted by statutory regulation or exceeds the permitted use, you will need to obtain permission directly from the
copyright holder. To view a copy of this license, visit http://creativecommons.org/licenses/by/4.0/.
© The Author(s) 2018
Scientific REpOrtS | (2018) 8:520 | DOI:10.1038/s41598-017-18922-6 11You can also read