Gas network 2021-26 access arrangement proposal - AER public forum - 4 August 2020 Phillip Deamer Acting General Manager, Economic Regulation

Page created by Anita Riley
 
CONTINUE READING
Gas network 2021-26 access arrangement proposal - AER public forum - 4 August 2020 Phillip Deamer Acting General Manager, Economic Regulation
Gas network 2021–26 access
arrangement proposal
AER public forum – 4 August 2020

Phillip Deamer
Acting General Manager, Economic Regulation
Gas network 2021-26 access arrangement proposal - AER public forum - 4 August 2020 Phillip Deamer Acting General Manager, Economic Regulation
Today's briefing

• Evoenergy, our customers and
  network
• What our plan means for
  customers
• What shaped our plan
• Major components of our plan
• Further planned engagement
                         https://www.evoenergy.com.au/about-us/
                         about-our-network/gas-five-year-plan

2
Gas network 2021-26 access arrangement proposal - AER public forum - 4 August 2020 Phillip Deamer Acting General Manager, Economic Regulation
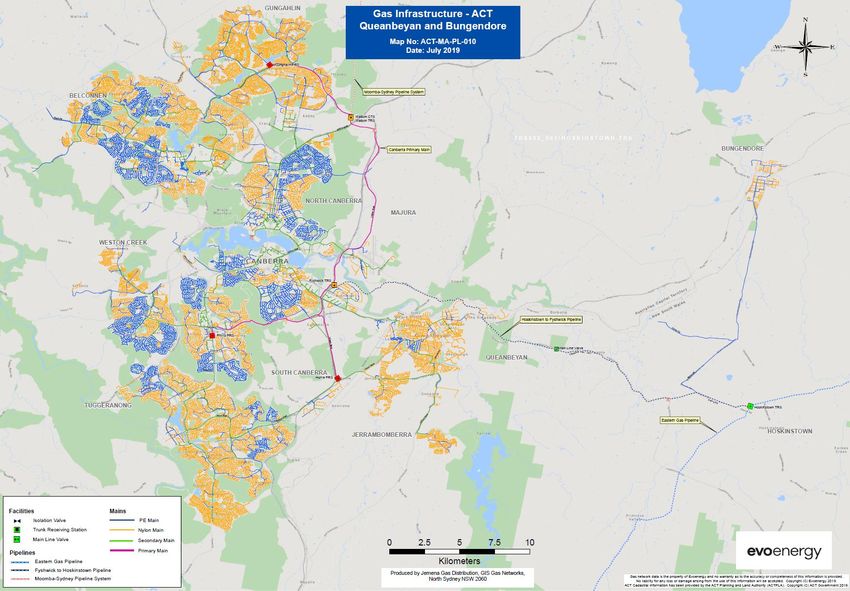
Evoenergy network and customers

                                                                       Gas makes up over 40% of the
 Evoenergy is the Canberra-           Our gas network charges
                                                                       ACT’s annual energy demand,
based distributor of electricity    make up around one quarter
                                                                       and around 60% of demand in
          and gas.                 of a typical customer's gas bill.
                                                                                 winter.

                                                                        The network's penetration
     Evoenergy's gas network       The Evoenergy gas network               rate of 75% within its
      customer base is 98%            has more than 150,000             reticulated area. customer
    residential, with no heavy     customer connections and is         density is 31 connections/km
       industrial customers.         over 4,500 km in length.           of main (Australian average
                                                                               density is 56).

3
Gas network 2021-26 access arrangement proposal - AER public forum - 4 August 2020 Phillip Deamer Acting General Manager, Economic Regulation
4
Gas network 2021-26 access arrangement proposal - AER public forum - 4 August 2020 Phillip Deamer Acting General Manager, Economic Regulation
What our plan means for customers

• Continuing safe and reliable gas supply while costs are minimised
• Reduced expenditure, resulting in lower network charges
• Responsible market expansion and gas usage assumptions while we are
  in transition to net zero emissions
• Time to progress our roadmap for transition to net zero emissions by
  2045
• Simplified tariffs
• A declining value of assets – good news for future bills
• Capital and operating expenditure sharing schemes to further promote
  efficiency

5
What our plan means for customers
– indicative bill impacts
    Indicative typical residential gas bill
    Based on 28 GJ per year, excluding the impacts of inflation

                                               2020/21       2021/22       2022/23   2023/24   2024/25   2025/26
Residential annual gas bill                       1,257           1,243      1,243     1,243     1,243     1,243
Evoenergy component                                 334             320       320       320       320       320
Residual component                                  923             923       923       923       923       923
Annual change $                                                      -14        0         0         0         0
Annual change %                                                   -1.1%      0.0%      0.0%      0.0%      0.0%

    Indicative typical small business gas bill
    Based on 469.8GJ per year excluding the impacts of inflation

                                                2020/21      2021/22       2022/23   2023/24   2024/25   2025/26
Small business annual gas bill                   13,861           13,730    13,730    13,730    13,730    13,730
Evoenergy component                               3,195            3,063     3,063     3,063     3,063     3,063
Residual component                               10,667           10,667    10,667    10,667    10,667    10,667
Annual change $                                                     -131         0        0         0         0
Annual change %                                                   -0.9%      0.0%      0.0%      0.0%      0.0%

6
What shaped our plan
– climate change policy environment
4B    Reduce emissions from gas

4.3   Amend planning regulations to remove the mandating of        By 2020     Complete
      reticulated gas in new suburbs.

4.4   Conduct a campaign to support the transition from gas by     From 2020   In progress
      highlighting electric options and savings opportunities to
      the ACT community.

4.5   Develop a plan for achieving zero emissions from gas use     By 2024     In progress
      by 2045, including setting timelines with appropriate
      transition periods for phasing out new and existing gas
      connections.

      Actions set out in
                                                                                    Gas
         the climate
                                                                                    Significant reductions in gas use in the residential sector to 2030, and
       change strategy                               Scenario                       reduction of commercial gas use in later years towards 2045.
                                                  contemplated                      • Around 60,000 existing households not connected to gas by 2025,
                                                  in the climate                      increasing to around 90,000 in 2030 and all houses by 2045.
                                                 change strategy                    • A decline in new houses connecting to gas, with no houses
                                                                                      connected to gas by 2045

7
We have taken a conservative
approach to demand forecasts
                Total gas usage (GJ)
    9,000
                  Historical   Forecast
    8,000

    7,000

    6,000
            Use Lev’s new version
    5,000

    4,000                              Potential

    3,000

    2,000

    1,000

       0

8
What shaped our plan
– broad and innovative engagement
     Citizens’ Jury – an         Energy Consumer        Partnership with
    Australian first for the    Reference Council –    ACTCOSS – needs of
        energy sector          informed consumers     vulnerable customers

     Business events –                                Engagement with ACT
      Energy Matters,                                   Government and
                                  Online survey
     ACTsmart Business                                Queanbeyan-Palerang
           Expo                                         Regional Council

    Evoenergy draft plan
                                                       Deep dives on key
    2021-26 – published        Community roadshow
                                                            issues
       February 2020

9
Key themes of feedback

         Environmental sustainability

         Responsible transition

         Safe and reliable service

         Affordability and fairness

10
Key themes of feedback

                 • Support for environmental
                   sustainability and for this to
                   be a key driver for
 Environmental     Evoenergy’s GN21 plan
  sustainability   development
                 • General support for ACT
                   climate change strategy

11
Key themes of feedback

                   • Most expected minimal (or no) network expansion
                     while the future transition roadmap is determined
                   • Some questioned whether our assumptions are
                     consistent with ACT climate change strategy
                   • Mixed feedback on proposal to accelerate
     Responsible     depreciation
                   • Support for minimising capital investment
      transition   • Consumers want us to continue to research and
                     consult on options and costs for transition
                     pathways
                   • Consumers are concerned about transition
                     impacts, particularly for vulnerable consumers

12
Key themes of feedback

                • Consumers value a safe and
                  reliable gas supply and expect
     Safe and     us to continue to prioritise
                  reliability and safety
     reliable   • Consumers want us to continue
      service     to maintain infrastructure while
                  we consider the future of the
                  gas network.

13
Key themes of feedback

                 • Consumers are concerned about affordability and
                   are seeking reduced network charges
                 • Some consumers expressed concern that the
                   declining block tariff is not progressive and may not
                   equally benefit low-income households who have
 Affordability     lower gas usage per quarter
                 • Consumers support simplification of our tariffs
 and fairness    • Consumers expect us to continue to operate
                   efficiently and look for opportunities to drive
                   further efficiency.
                 • They support the proposed operating and capital
                   efficiency schemes

14
Principles for transition roadmap to
net zero emissions from gas
Keep communications open

Gather and share information on options

Investigate all options, don’t pick winners

Respond to uncertainty by minimising investment and shortening asset lives on new
investment

Maintain safety and reliability of network

Connect new customers when requested, where economic

15
Major components of our proposal
Parameter             Proposal
Revenue requirement   $294m ($2020/21) (unsmoothed), 10% real below 2016 final
                      decision
Real network prices   4% real decline in 2021/22, zero in later years
Net capex             $63.3m ($2020/21), 18% below actual and 28% lower allowed
                      capex for 2016–21 period
Opex                  $175m ($20/21), $5m or 3% higher than 2016–21 allowance
Total gas use         13% fall overall (2019/20–2025/26), 16% fall in annual gas
                      usage/customer, 3% rise in customer numbers.
Rate of return        4.68% (nominal vanilla WACC) in 2021/22 (average 5.95% over
                      2016–21)
Capital base          $369m ($2020/21) at end of 2021–26, down 4% in real terms (6%
                      per customer) relative to the end of 2016–21.

16
Major components – revenue requirement

                          Our plan delivers lower network costs for the business and customers
                          350
                          300      326                           6             3            2
                                                - 37                                                     -7             294
     $millions, 2020-21

                          250
                          200
                          150
                          100                                          10% lower*
                           50
                            -
                                  2016-21     Return on    Depreciation     Operating   Efficiency   Tax allowance     2021-26
                                  revenue      capital                       costs      carryover                      forecast
                                requirement                                                                            revenue
                                                                                                                     requirement

                                  2016-21                                                                            2021-26
                                               Average annual revenue per customer

                                   $437                               13% lower*                                      $380

                                 *Based on unsmoothed revenue requirement

17
Major elements of our plan – opex
                                        Actual and forecast total opex and opex per customer
                                                         2016-17 to 2025-26
                          40                                                                                        300

                          35
                                                                                                                    250
                          30
$ million, real 2020-21

                                                                                                                    200

                                                                                                                          $, real 2020-21
                          25

                          20                                                                                        150

                          15
                                                                                                                    100
                          10
                                                                                                                    50
                          5

                          0                                                                                         0
                               2016-17 2017-18 2018-19 2019-20 2020-21 2021-22 2022-23 2023-24 2024-25 2025-26

                                    Actual / estimate    Forecast      Allowance      Opex per customer (RH axis)

18
Major components – opex
                                                  2021-26 opex forecast build up
                                                                                                       Using CEG estimate
                     200                          Made up of
                     180                          government charges,
                     160                          UAG and IT asset                57.9              1.0          176.1
$millions, 2020-21

                                                  utilisation fee
                     140
                     120
                     100       113.0              2.0           2.3
                                                                                            UNFT accounts
                      80                                                                    for $45.3m of
                      60                                                                    these costs, or
                      40                                        Change in                   26% of total opex
                                                                treatment of
                      20                                        pigging costs
                       0
                            Base opex        Trending Step changes              Category       Debt raising Total forecast
                                            base opex                            specific        costs
                     Opex to account for labour
                                                                                forecasts
                     price and output growth,
                     offset by 0.5% annual
                     productivity improvement

19
Major components – capex

                                            Current and forecast period capex
                      25
 $ million, 2020/21

                      20
                                                                                                AER Allowance
                      15
                                                                                                Actual/Estimate
                      10

                       5                                                                        Forecast

                       0

                      $ million (2020/21)                     AER       Actuals     Forecast
                                                           allowance    2016-21     2021-26
                                                            2016-21
                      Market expansion                           49.7        45.9        26.3      28% lower than
                      Capacity development                        7.1         7.2         0.9
                      Stay-in-business - network renewal         17.0         8.2        12.9      current period
                      Stay-in-business - meter renewal           18.2        17.4        23.6
                                                                                                     allowance
                      Non-system                                  0.6         0.0         0.0
                      Gross capex                                92.6        78.7        63.8
                      less capital contributions                  4.5         1.7         0.5
                      Net capex                                  88.1        77.0        63.3
20
Major components
– capital base and depreciation
                                Capital base total value and per customer over                            Our plan proposes to shorten
                                   current and forecast regulatory period                                 the asset lives of three asset
                                                                                                          categories for new
                          450                                                    3000
                                                                                                          investment:
                          400
                                                                                 2500
$ million, real 2020-21

                          350                                                                                High pressure mains from

                                                                                        $, real 2020-21
                          300                                                    2000                         80 years to 50 years;
                          250
                                                                                 1500
                          200                                                                                Medium pressure mains
                          150                                                    1000                         from 50 to 30 years; and
                          100
                                                                                 500
                          50                                                                                 Medium pressure
                           0                                                     0                            services from 50 to 30
                                                                                                              years

RAB value will decrease by 4% over the 2021-26
                Total, $ million real 2020-21 (LHS)
period, or 7% on a per customer basis
                                           Per customer, $ real 2020/21 (RHS)

21
Next steps – further engagement

• We have already held Q&A sessions with key
  consumer representative groups in July
• We are planning further engagement (deep dive
  workshops) on asset stranding

22
You can also read