CLIMATE CHANGE IMPACTS ON SYDNEY'S WATER SUPPLY - WaterNSW
←
→
Page content transcription
If your browser does not render page correctly, please read the page content below
CLIMATE CHANGE IMPACTS ON SYDNEY’S WATER SUPPLY
Selvaratnam Maheswaran 1, Jason Martin 1, Golam Kibria 1
1. Sydney Catchment Authority, Penrith, NSW, Australia
INTRODUCTION
The drinking water for Sydney’s 4 Million residents is primarily supplied by surface water sources in the
Nepean Hawkesbury river system. Sydney, as well as many parts of Australia and many other countries, is
exposed to high rainfall variability and multiyear droughts. A recent study by Australian Green House Office
(AGO) suggested that Australia will have to face to some degree of climate change over the next 30 to 50
years. The scale of change is not known fully but the Third Assessment Report (TAR, IPCC) summarizes a
number of outcomes including possible reduction in rainfall and increase of severe weather events in many
parts of the world. The changes in rainfall and evaporation and eventually inflows to dams will directly impact
water utilities. This study was a collaboration between the Commonwealth Scientific and Industrial Research
Organisation (CSIRO), the Australian Government Department of Climate Change, the NSW Department of
Environment, Climate Change and Water (DECCW), NSW Office of Water (NoW), Sydney Catchment
Authority (SCA), Sydney Water Corporation (SWC) and the University of NSW (UNSW).The study aimed to
provide important insights into the potential impacts of climate variability and climate change on Sydney’s
predominantly rain-fed water supply system, and on Greater Sydney’s future demand for water. The findings
have been incorporated into the 2010 review of the Metropolitan Water Plan. The supply side impact
assessment is discussed in this paper.
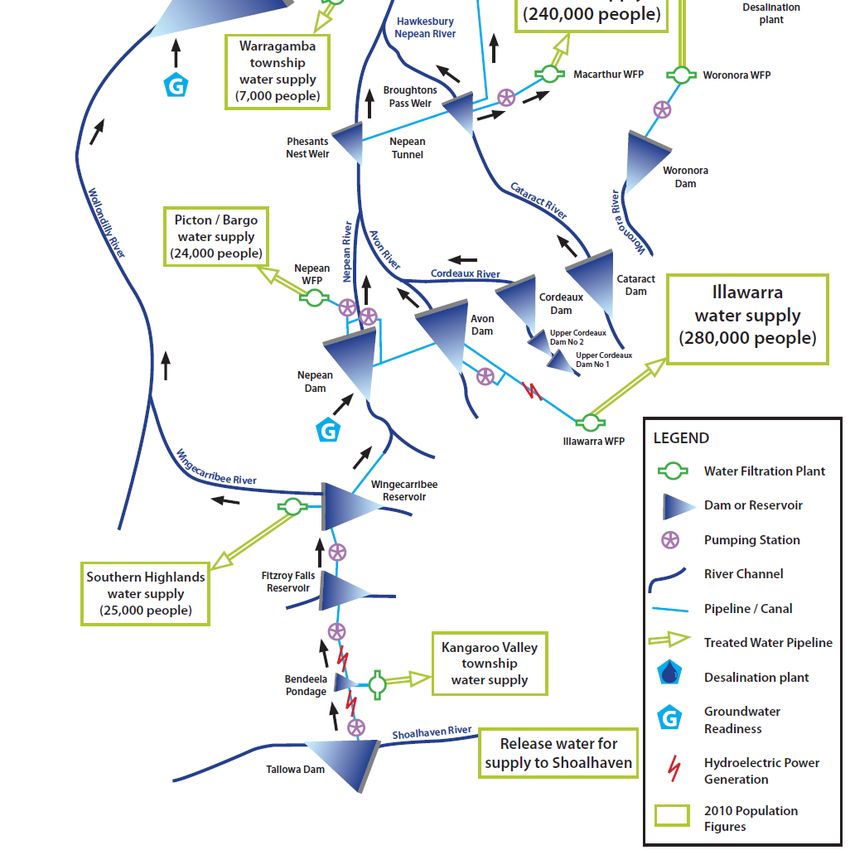
The Sydney Water Supply System incorporates the Shoalhaven System, the Warragamba and Blue
Mountains dams, the four Upper Nepean Dams, Prospect Dam, Woronora Dam and a desalination plant with
a capacity of 250ML/d. Bulk raw water is supplied from the SCA system of 10 major dams and 2 diversion
weirs, through a network of pipelines, canals and tunnels, to water filtration plants. Figure 1 shows locations
of water supply infrastructure.
METHODOLOGY
Yield assessment methodology
For long-term planning, the water supply system is designed to meet service standards to ensure supply
continuity and to minimise the frequency and duration of water restrictions. The NSW Independent Pricing
and Regulatory Tribunal (IPART) as the Operating Licence Regulator for the SCA sets the service standards
for the raw water delivery system. These service standards are defined by the system design criteria:
security, reliability and robustness. These are:
Reliability is defined as the percentage of the months, on average, that water restrictions will not need to
be applied (not more than 30 months in 1000 months).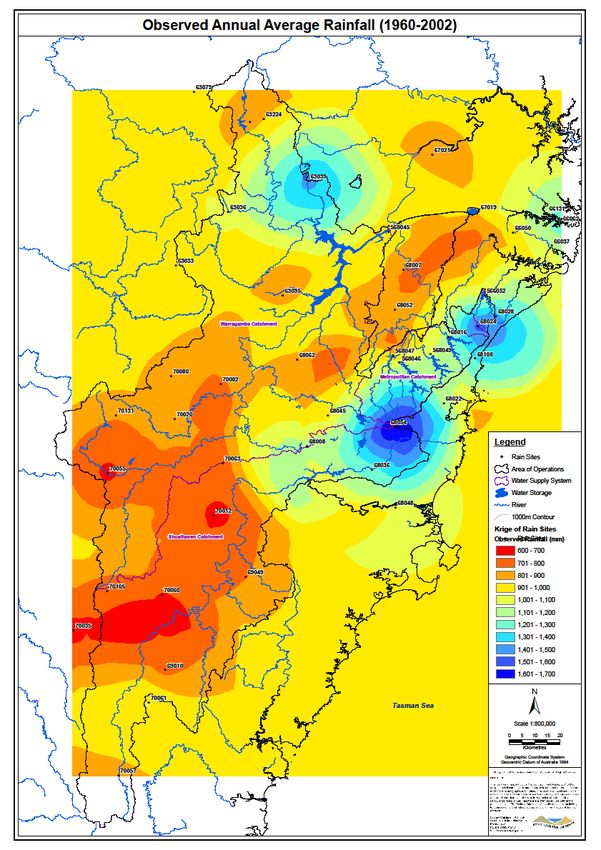
Robustness is defined as the percentage of the years, on average, that restrictions will not need to be
applied (not more than 10 years in 100 years).
Security is defined by the chance that the operating storage will not fall below 5% (no more often than
one month in 100,000 months).
The water supply system yield is defined as the maximum annual average demand that can be supplied by
the system whilst conforming to these design criteria. For long term planning purposes, water supply system
yield is kept in balance with demand by demand management and system augmentation options.
The levels of probability for the design criteria require a stochastic approach to be used for the performance
analysis. Synthetically generated streamflows provide water resources planners with alternative sequences
of having the same statistical properties as the historical records, in partcular the presense of muti year
droughts. For synthetic generation of monthly streamflows for multiple sites, the SCA uses annual
autoregressive lag one AR(1) model coupled with disaggregation.
Climate change impact assessment methodology
The adopted methodology included techniques of interpretation of regional GCM estimates, statistical
downscaling of GCM results to catchment scale, plus catchment rainfall-runoff and water supply system
modelling. The system yield was assessed for two future timeframes of 21-year period centred around 2030
(2020-2040) and 2070 (2060-2080) for 3 climate change scenarios B1, A2, A1B. To better represent the
uncertainty in possible climates, 100 replicates of rainfall and evaporation estimates were produced for the
current climate and for each the future climate change scenarios in 2030 and 2070. These rainfall and
evaporation estimates were used in calibrated HSPF models for each of the SCA’s supply catchments to
produce 100 replicates of dam inflows.
RESULTS
In developing and demonstrating the robustness of the GCM downscaling techniques, continuous daily
rainfall data was produced for 45 long term monitoring locations for 100 replicates for a period of 43 years.
Similarly, daily evaporation was produced for 19 stations for the same period. The downscaled and
observed annual average rainfall distribution is shown in Figure 2. The downscaling process was used to
generate 100 rainfall and evaporation daily sequences for climate scenarios A2 for the 2030 and 2070
assessment periods. An annual average catchment rainfall for each scenario was calculated. It was found
that the Warragamba and Shoalhaven catchment average rainfalls were slightly reduced. However,
Metropolitan catchment rainfall is slightly increased. Figure 2 displays the annual rainfall distribution for both
2030 and 2070. In general, the inland regions consisting of the majority of the Warragamba and Shoalhaven
catchments tend to become drier with less average rainfall and more evaporation. The coastal regions,
consisting of: the Metropolitan catchments; regions around Wingecarribee Dam; the easternmost sections of
the Warragamba catchment; plus Fitzroy Falls Dam catchment and Kangaroo River which are part of the
Shoalhaven catchment, tend to be slighter wetter with higher average rainfall offset with higher evaporation.
The changes in rainfall, evaporation and inflows are sumarised in Table 1.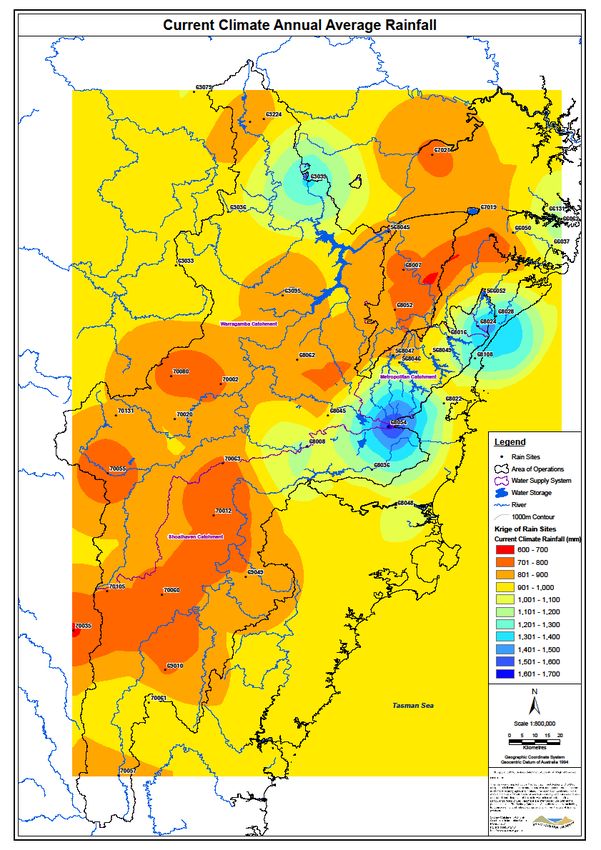
One of the key limitations was the inability of current climate modelling to simulate drought persistence.
Persistence is the relationship between rainfall and inflows in one year and those in adjacent years. This
factor leads to long periods of drought in Sydney and is a key factor in the robust assessment of large water
supply systems with many years of storage capacity. The persistence of low inflow sequences is statistically
measured as a correlation between each year’s flow and flows for previous years. It was found that
downscaled rainfall for climate change scenarios at the catchment level did not pick up this persistence
factor. As a consequence, it was necessary to complete the project by assuming that the persistence of
drought sequences in the future would be similar to the historic pattern. While the results have provided
some information about the potential impact of climate change on yield, the limitations, assumptions and
uncertainties are significant. Further work to address these is needed before reliable quantitative
assessments can be derived or adopted.

CONCLUSION
Climate modelling and international responses to climate change will continue to evolve beyond the
completion of this study. The SCA will continue to participate in further studies in the future, addressing
limitations of this study. Nevertheless, the results of this study have provided an early indication of the
potential impact of climate change on evaporation, rainfall and runoff, and highlighted the limitations and
uncertainties to be addressed in future work in this area.
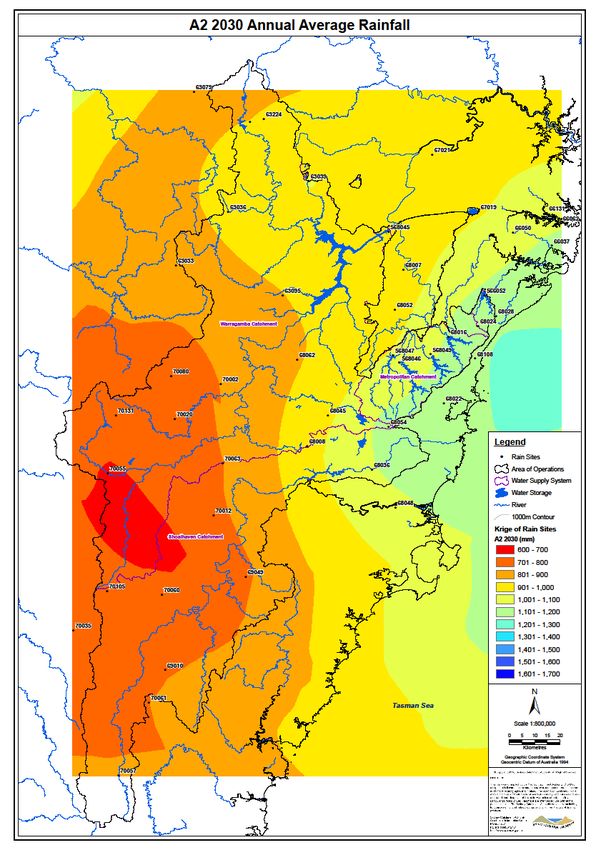
Figure 1: Water Supply System for Sydney
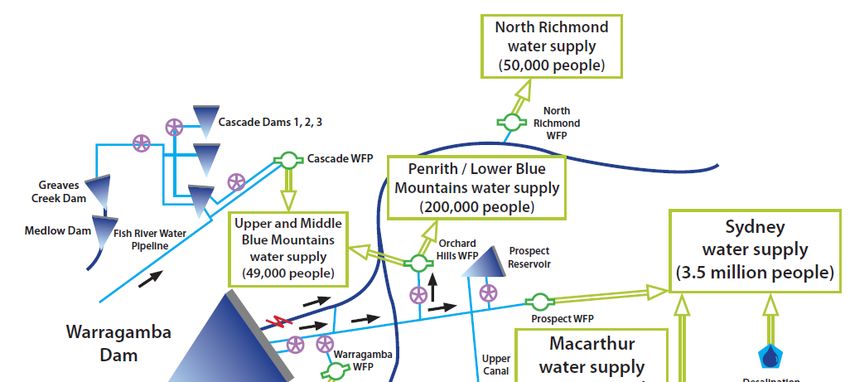
Figure 2 Annual rainfall contour maps for the observed and current climate

Figure 3 Annual rainfall distribution of the A2 Climate Change Scenario in 2030 and 2070
Change in annual        Change in annual average           Change in annual average
                 average rainfall             evaporation                        stream flow
 Catchment         (mm/year)
                 2030        2070         2030             2070             2030              2070
Warragamba       -3%         -4%          +3%              +6%              -21%             -26%
Shoalhaven       -5%         -6%          +7%              +14%             -20%             -24%
Metropolitan     +2%         +5%          +3%              +6%              +1%              +5%

    Table 1 Estimated changes for the A2 Climate Change Scenario in comparison with current climate
You can also read