Climate Change Impact upon Hydrological Systems hosting Aquaculture (Salmon farming) - Departamento de Geofísica
←
→
Page content transcription
If your browser does not render page correctly, please read the page content below
Departamento de Geofísica
        Facultad de Ciencias Físicas y Matemáticas
                   Universidad de Chile

Climate Change Impact upon
Hydrological Systems hosting
Aquaculture (Salmon farming)
René D. Garreaud
Department of Geophysics, Universidad de Chile
Center for Climate and Reslience Research, CR2
                                                     12th International Sea Lice Conference
                                                       Nov. 4, 2018 – Punta Arenas, Chile
Climate Change Impact upon Hydrological
Systems hosting Aquaculture (Salmon farming)
• Climate Change?
• Global and Local observations
• What next? Model based projections
   o The future is uncertain – Climate Scenarios
   o Impacts upon aquaculture regions
• Discussion
   o Extreme events
   o Climate variability
Greenhouse effect and Global Warming
CO2, CH4, H20 and other gasses absorb longwave radiation emitted by the surface….

                                                                      Ruddiman: Earth’s Climate, Chapter 4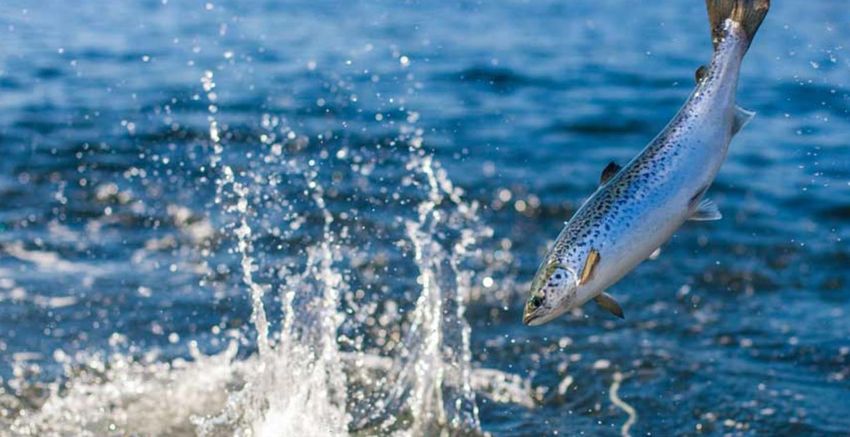
Greenhouse effect and Global Warming
CO2, CH4, H20 and other gasses absorb longwave radiation emitted by the surface….

                                                                      Ruddiman: Earth’s Climate, Chapter 4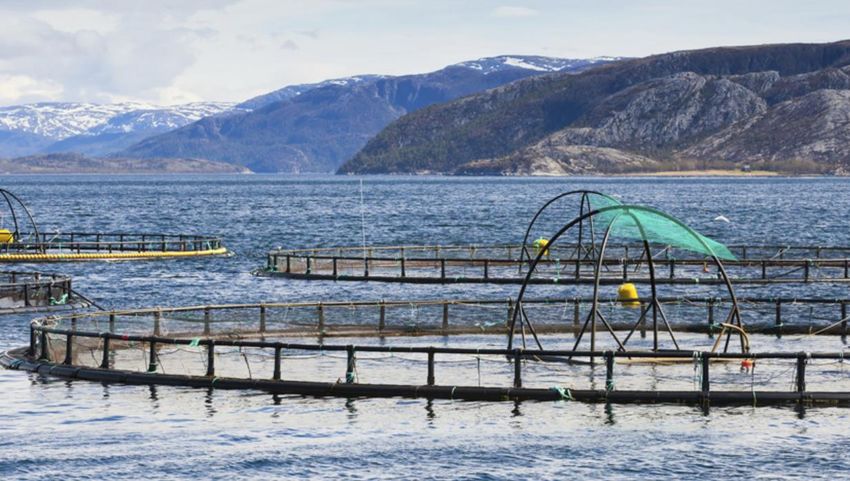
Greenhouse effect and Global Warming
The direct, radiative effect of increasing CO2 (and other GHG) is well known, but not their feedbacks
Easy part….
Radiative model
T0(2CO2) +1.25°C
Ruddiman: Earth’s Climate, Chapter 4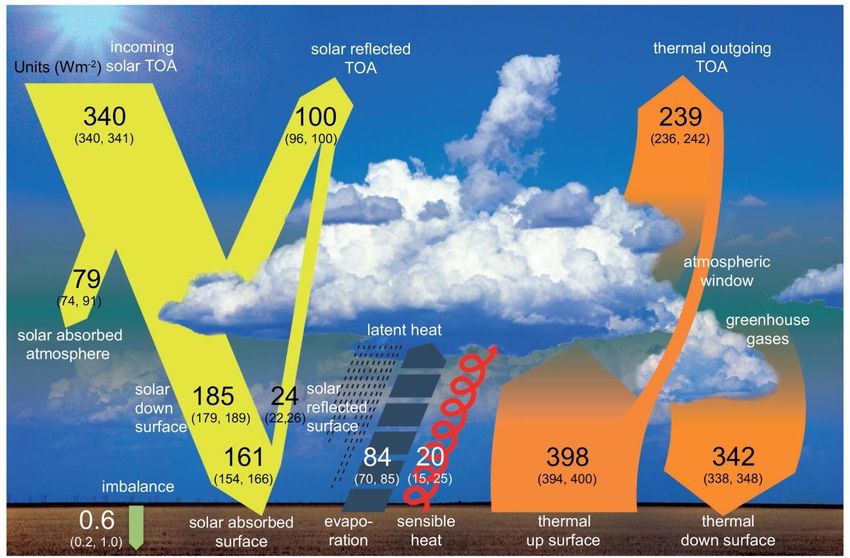
Greenhouse effect and Global Warming
To quantify its effects we use numerical models of the atmosphere/ocean general circulation (GCMs)
16.0
                                   Earth average
                                   temperature (ºC)

                          15.5

OUR CHANGING                                                                                     20
                                                                                                       Mean sea
CLIMATE                   15.0
                                                                                                 10
                                                                                                       level [mm]

Global signs during the
                                                                       8.12          Ocean
Antropocene                                                                          mean pH

                                                                       8.07                      0

                                                                                                 10.5

                                                                    Artic ocean sea ice
                                                                    Mill km2)
                                                                                                 7.5

                                 1900      1920       1940   1960        1980        2000      2020

                                                                                                        © RGS. DGF-UCh / CR2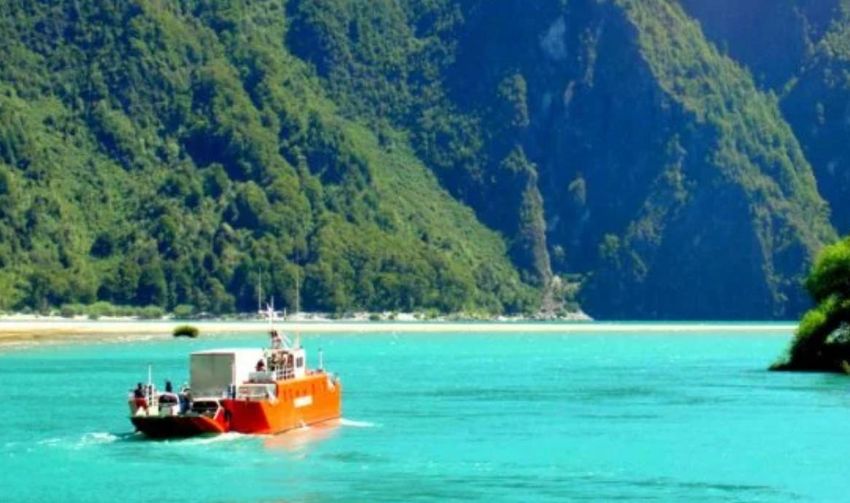
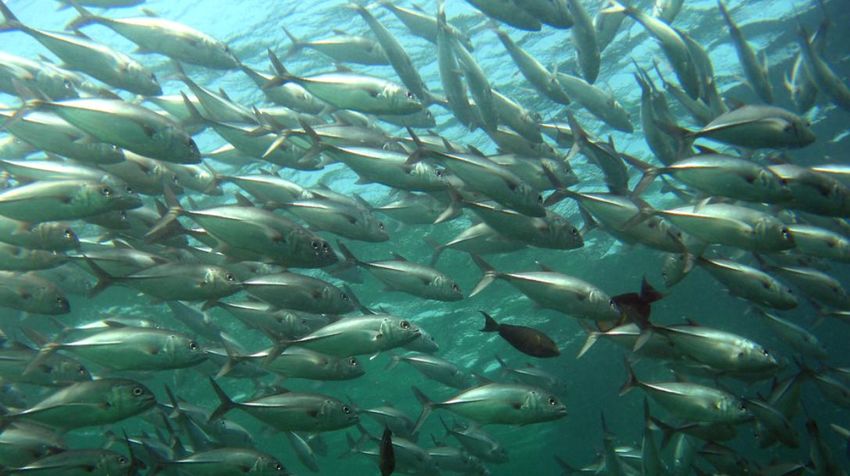
Aquaculture 101
7%
     43%
           Salmon farm concentrated in just a
           few regions in the Northern and
      9%
           Southern Hemisphere

                 35%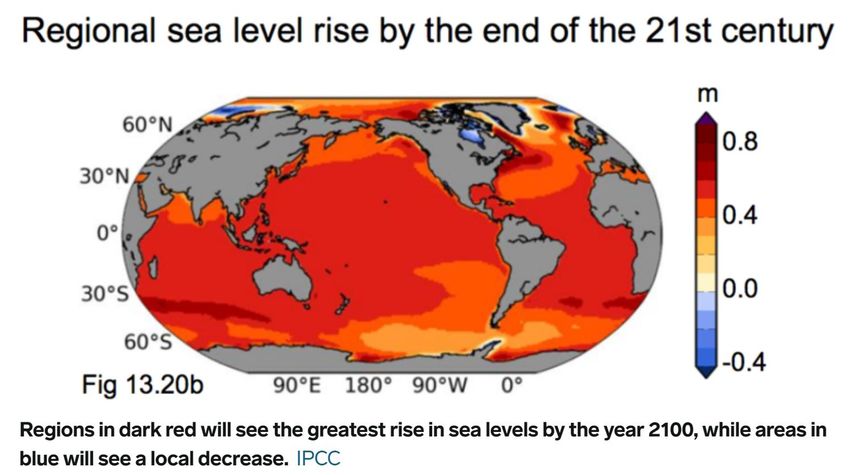
Aquaculture 101
                                      Salmon farms in cool SST regions

              0      8         28°C
                  Anual mean SST

Long term annual mean
ERSTT-NOAA, 1960-2010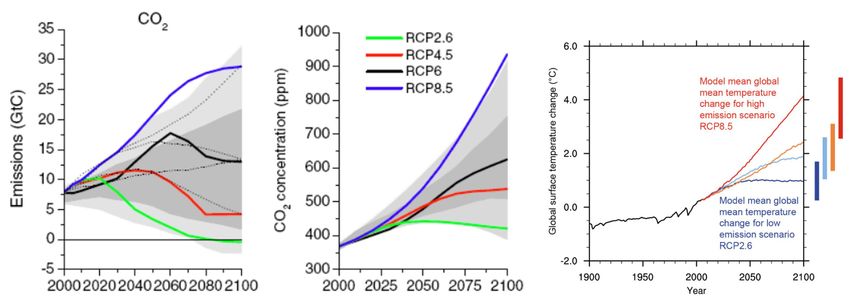
Aquaculture 101
                                       Salmon farms in cool SST regions
                                       with plenty of fresh water available

              100         2000 mm/yr
               Annual mean rainfall

Long term annual mean
NCEP-NCAR Reanalysis, 1960-2010
Observed changes during the 20th Century (IPCC, AR5)
Warming everywhere Mixed signal
but variable (0.5-2ºC) (dry/wet)Drying in central-southern Chile (GHG+O3+Nat Variability)
Puerto Montt annual rainfall and Puelo mean discharge Rainfall trend 1960-2016
(Fuente: Antonio Lara, UACH) Boisier et al. 2018
2600
Precipitación Caudal anual
2400
900 r=0.71
2200
800
Precipitación (mm)
2000
Caudal (m3/seg)
700 1800
1600
600
1400
500
1200
400 1000
Trend and Variability
300
1930 1940 1950 1960 1970 1980 1990 2000
YearJust in case you are interested in Central Chile
Promedio Histórico
1960-2000
Promedio Temperatura máxima de Invierno [°C]
19
SANTIAGO 18
Estación Quinta Normal
Fuente: DMC
Templado 17
Promedio Histórico
1960-2000
Semiárido
Mediterráneo 16
Años
1950-2009
15
0 100 200 300 400 500 600 700 800
Precipitación anual [mm]Just in case you are interested in Central Chile
Promedio Temperatura máxima de Invierno [°C]
19
Años M-Sequía
2010-2018(*) 2015
SANTIAGO 18 2018 ??
Estación Quinta Normal
Fuente: DMC
17
La Mega Sequia Promedio Histórico
1960-2000
2010-201X
16
Años
1950-2009
15
0 100 200 300 400 500 600 700 800
Precipitación anual [mm]And What Next?
The major source of uncertainty
How much CO2 will be emitted in the future ?How much CO2 will be emitted in the future ?
Socio-economic Climate
development pathways Scenarios
Balance
De Masa GCMs (more than 40)Projected Changes SST
Average [2050-2100] minus [1960-
2005] under RCP8.5 scenario. Warming
everywhere but stronger in the NH,
weaker in Patagonia
-4 0 +4°C
Multi Model Mean
40 CMIP5 models – IPCC 5ARRCP8.5
Projected Changes in
                                     Surface wind stress
                                   Average [2050-2100] minus [1960-
                                        2005] under RCP8.5 scenario.
                                              Strong signal in the SH.

          -20     0      +20 tau

Multi Model Mean
40 CMIP5 models – IPCC 5AR
Projected Changes Rainfall
Average [2050-2100] minus [1960-2005]
under RCP8.5 scenario.
Mixed signals between and within
salmon farm regions
-300 0 +300 mm/yr
Multi Model Mean
40 CMIP5 models – IPCC 5AR+50%
+25%
* 0%
Climate -25%
Projections for
-50%
continental Chile
End of century (2070-2100) under heavy
GHG scenario (A2 / RCP8.5)
Central Chile
Surface temperatura increase: 2.5-3.5°C
Rainfall deficit 25-35%
̶ rain + temperature = hydrological changes
Estudio DGF/UCh-CONAMA 2007 empleando PRECISProjected Changes Salinity
Surface value-open ocean.
Average [2050-2100] minus
[1960-2005] under RCP8.5 scenario.
Strong freshening in the
North Atlantic.
Little changes in the SH
-1 0 +1 PSU
Multi Model Mean
40 CMIP5 models – IPCC 5ARSummary of Climate Change Impact upon main Salmon farming
regions. End of 21st Century under Heavy GHG scenario
Offshore Off. Surface Rainfall Sea level
Region
SST (ºC) Salinity (PSU) (mm/yr) (m)
Southern Chile (Los Lagos) 1.5 < +0.2 -250 0.2
Southern Chile (Magallanes) 1.0 < +0.1 +50 0.2
Norway 2.3 -0.5 +70 0.5
UK + Faroe Island 2.0 -0.4 +50 0.5
Canada (BC) 2.7 -0.6 +90 0.3
United States (East coast) 2.7 ±0.4 +70 0.6
Japan 2.8 -0.2 +40 0.5
Australia + New Zealand 1.8 0 +70(?) 0.5Aquaculture 102: Sea Lice
Brooker et al. 2005
Low Salinity Fresh
Cool water water
Input
Upwelling Sea lice
Sweet spot
Cold water
High Salinity
Nutrient rich
Adapted from
Groner et al. 2016Summary of Climate Change Impact upon main Salmon farming
regions. End of 21st Century under Heavy GHG scenario
Offshore Off. Surface Rainfall Sea Lice
Region
SST (ºC) Salinity (PSU) (mm/yr) growth
Southern Chile (Los Lagos) 1.5 < +0.2 -250 ++
Southern Chile (Magallanes) 1.0 < +0.1 +50 +
Norway 2.3 -0.5 +70 ++
UK + Faroe Island 2.0 -0.4 +50 +
Canada (BC) 2.7 -0.6 +90 ++
United States (East coast) 2.7 ±0.4 +70 ++
Japan 2.8 -0.2 +40 ++
Australia + New Zealand 1.8 0 +70(?) +But
Remember:
The future
is open
RCP2.6 RCP4.5 RCP6.0 RCP8.5105
100
95
Change in central Chile Rainfall
But 90
Remember: 85
The future 80 Promedio
Mega Sequía
is open 75
2010-2015
Cambio de precipitación y aumento de 70 RCP8.5
temperatura a fines de siglo (2070-2100)
con respecto a clima actual (1970-2000).
65
Sin acción
Círculos indican promedio multi-modelo
para cada escenario (32 modelos). Barras
60
de error indican desviación estándar entre
modelos .
0.5 1 1.5 2 2.5 3 3.5 4 4.5 5
Increase in Global Mean Temperature105
100
RCP2.6
95
Change in central Chile Rainfall
But 90 Impacto
RCP4.5
Remember:
COP21
85
The future 80
RCP6.0
Promedio
Mega Sequía
is open 75
2010-2015
Cambio de precipitación y aumento de 70 RCP8.5
temperatura a fines de siglo (2070-2100)
con respecto a clima actual (1970-2000). Promesa
65 COP21
Sin acción
Círculos indican promedio multi-modelo
para cada escenario (32 modelos). Barras
60
de error indican desviación estándar entre
modelos .
0.5 1 1.5 2 2.5 3 3.5 4 4.5 5
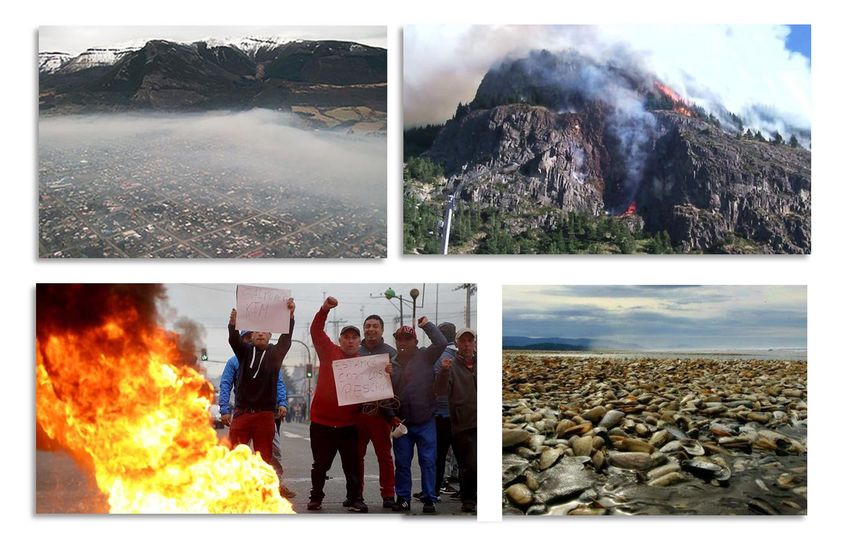
Increase in Global Mean TemperatureWhat about extreme events? Let’s consider the terrible summer-fall 2016 when the worst ever recorded Harmful Algal Bloom (Pseudochattonella cf. verruculosa + Alexandrium catenella) affected southern Chile, decimating 10% of the Chilean Salmon production and causing social unrest and economic losses.
Aquaculture 103: HAB
Atmosphere/Land Boundary Conditions
Heat Solar Momentum Fresh Water Consumption
Radiation Poisoning
Photosynthesis
Zooplankton
SXT
Grazing Advecction
Bloom accumulation
Transport
Pelagic
fish Shell fish
Competition Filtering
Consumption Cell
growth
Ocean state variables Uptake
Other Algae
communities
• Temperature Turbulence
• Stratification ((z)) Upwelling Aquaculture
Nutrients
Alexandrium
• Vertical velocity Catenella Encystment Mortality
(P,N)
• Currents Feeding
• pH Zygote
Agriculture
Runoff
Excystment Sedimentation
Macro algae
Physical processes
Cyst Dormancy Biological processes
© RGarreaud / DGF-UCh + CR2Aquaculture 103: HAB Atmosphere/Land Boundary Conditions
Solar
Fresh Water
Radiation
Bloom
Ocean state variables
• Temperature Turbulence
Upwelling
• Stratification ((z)) Nutrients
Alexandrium
• Vertical velocity Catenella
(P,N)
• Currents
• pH
Physical processes
Biological processes
© RGarreaud / DGF-UCh + CR2What about extreme events?
(a) Precipitation anomalies
El Niño!
Natural….
The drought of summer Puerto
2016, as most climate Chiloe
Island
Montt
NW Patagonia
extreme, occurred by the
Coyhaique
superposition of natural Aysen
variability (e.g. ENSO) upon River
Antrophogenic
climate change. SAM!
-90 0 +90 %What about extreme events?
1950-2017 RCP 8.5
100%
Thus, extreme events may Simulated Strong
Probability of non-exceedance
be more frequent and/or El Niño in future
75%
climate
intense in the future, but
the change depend on the 50%
region and the phenomena
in play. Observed Strong El
25% Niño (2016)
0%
100 200 300 400 500 600 700 800
Streamflow Jan-May (m3 s-1)Temperature and precipitation trends forced by GHG/O3 have
began to emerge at the global and local scale
Climate models indicate that such trends will continue during the
21st century, possibly causing an increase in sea lice (expansion?
Intensity? Seasonality?)
CONCLUSIONS The magnitude and timing of the global climate change effects
depends on the emission rate of GHG (and hence of the socio-
economic development pathways)
Local impacts (e.g., upon salmon production on a specific region)
require further analyses of the climate-environment-industry
relationships.Departamento de Geofísica
Facultad de Ciencias Físicas y Matemáticas
Universidad de ChileYou can also read