Temperature and Precipitation - gov.epa.cfpub
←
→
Page content transcription
If your browser does not render page correctly, please read the page content below
Report on the Environment              https://www.epa.gov/roe/

Temperature and Precipitation
Air temperature and precipitation are fundamental measurements for describing the climate, and can
have wide-ranging effects on human life and ecosystems. For example, increases in air temperature
can lead to more intense heat waves (see the Heat Waves indicator in EPA’s Climate Change
Indicators in the United States), which can cause illness and death, especially in vulnerable
populations. Rainfall, snowfall, and the timing of snowmelt can all affect the amount of water
available for drinking, irrigation, and industry. Annual and seasonal temperature and precipitation
patterns also determine the types of animals and plants (including crops) that can survive in
particular locations. Changes in temperature and precipitation can disrupt a wide range of natural
processes, particularly if these changes occur more quickly than plant and animal species can adapt.
Concentrations of heat-trapping greenhouse gases are increasing in the Earth’s atmosphere (see the
Atmospheric Concentrations of Greenhouse Gases indicator). In response, average temperatures at
the Earth’s surface are rising and are expected to continue rising (USGCRP, 2017). As average
temperatures at the Earth’s surface rise, more evaporation occurs, which, in turn, increases overall
precipitation. Therefore, a warming climate is expected to increase precipitation in many areas.
However, because climate change causes shifts in wind patterns and ocean currents that drive the
world’s climate system, some areas are warming more than others, some have experienced cooling,
and precipitation patterns will vary across the world. In addition, higher temperatures lead to more
evaporation, so increased precipitation will not necessarily increase the amount of water available
for drinking, irrigation, and industry. Increased evaporation can also produce more intense
precipitation events—for example, heavier rain and snow storms that can damage crops and increase
flood risk—even if the total amount of precipitation in an area does not increase.
This indicator shows trends in temperature and precipitation based on instrumental records. Air
temperature and precipitation trends are summarized for entire the contiguous U.S., nine regions of
the contiguous U.S. (these climate regions are different from the 10 EPA Regions), Alaska, and
smaller regions within each state, which are known as climate divisions. For context, this indicator
shows trends in global temperature (over land and sea) and global precipitation (over land). This
indicator uses instrumental records that start at 1901 except for Alaska, where reliable statewide
records are available back to 1925. The indicator extends through 2020 for temperature and
precipitation in the United States and global temperature, and 2019 for global precipitation. For
comparison, this indicator also displays satellite measurements that can be used to estimate the
temperature of the Earth’s lower atmosphere since 1979.
This indicator shows annual anomalies, or differences, compared with the average temperature and
precipitation from 1901 to 2000. For example, an anomaly of +2.0 degrees means the average
temperature was 2 degrees higher than the long-term average. Anomalies have been calculated for
each weather station. Daily temperature measurements at each site were used to calculate monthly
anomalies, which then were averaged to find an annual temperature anomaly for each year.
Precipitation anomalies were calculated from total annual precipitation at each site, in inches.
Anomalies for the contiguous 48 states and Alaska have been determined by calculating average
anomalies for areas within each state based on station density, interpolation, and topography. These
regional anomalies are then averaged together in proportion to their area to develop national results.
Similarly, global anomalies have been determined by dividing the world into a grid, averaging the
data for each cell of the grid, and then averaging the grid cells together.
Long-term trends in temperature and precipitation were calculated from the annual data by linear
regression (the straight line that fits the data best). For each of the nine climate regions and Alaska,
this indicator also shows a smoothed time series, which was created using a nine-year weighted
average.
What the Data Show
Since 1901, the average surface temperature across the contiguous 48 states has risen at an average
rate of 0.16°F per decade (1.6°F per century) (Exhibit 1). Average temperatures have risen more
quickly since the late 1970s (0.31 to 0.54°F per decade since 1979). Eight of the top 10 warmest
years on record for the contiguous 48 states have occurred since 1998, and 2012 and 2016 were the
two warmest years on record.
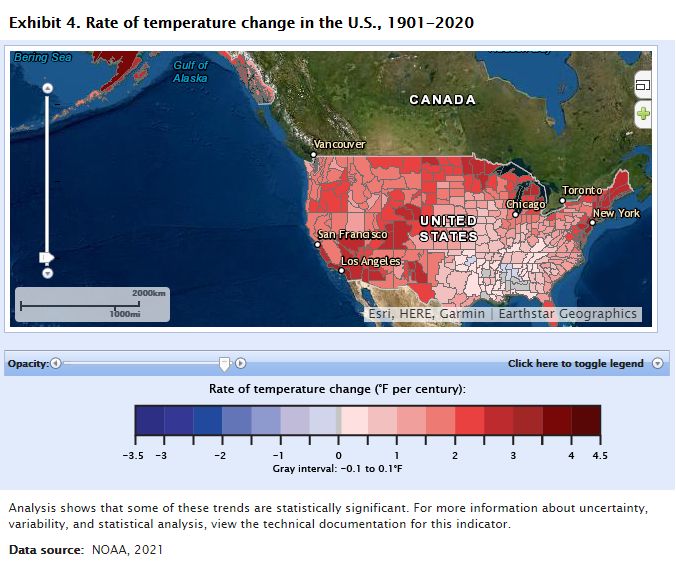
Warming has occurred throughout the U.S., with all 10 climate regions (including Alaska) showing
a statistically significant increase of more than 1°F since the start of the 20th century (Exhibit 3). The
Northeast, the West, and Alaska have seen temperatures increase the most, while some parts of the
Southeast have experienced little change (Exhibits 3 and 4).
Global average surface temperature has risen at an average rate of 0.17°F per decade since 1901
(Exhibit 2), similar to the rate of warming within the contiguous 48 states. Since the late 1970s,
however, the United States has warmed faster than the global rate. Worldwide, 2016 was the
warmest year on record, 2020 was the second-warmest, and 2011–2020 was the warmest decade on
record since thermometer-based observations began. Satellite measurements of the Earth’s lower
atmosphere reveal temperature trends similar to those observed through ground-based monitoring
(Exhibits 1 and 2).
As mean temperatures have risen, mean precipitation also has increased. This is expected because
evaporation increases with increasing temperature, and there must be an increase in precipitation to
balance the enhanced evaporation (IPCC, 2013). Since 1901, global precipitation has increased at an
average rate of 0.10 inches per decade, while precipitation in the contiguous 48 states has increased
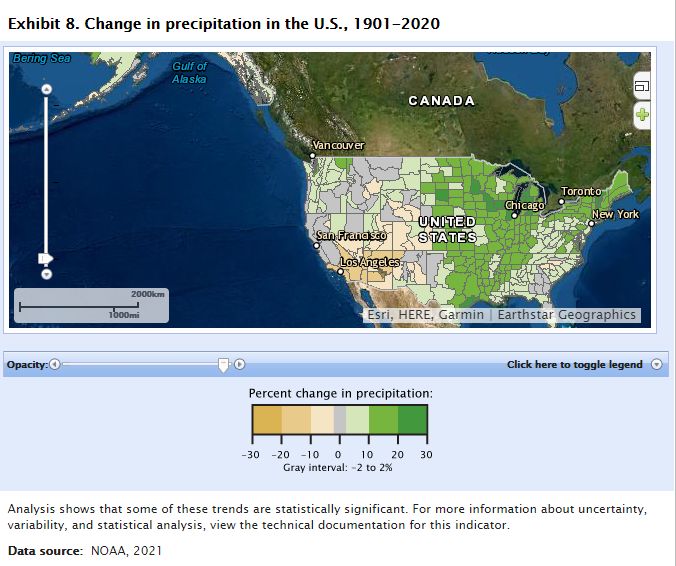
at a rate of 0.20 inches per decade (Exhibits 5 and 6). Some parts of the United States have
experienced greater increases in precipitation than others, while a few areas, such as the Southwest,
have seen a decrease in precipitation (Exhibits 7 and 8). Four of the 10 climate regions in Exhibit 3
have experienced statistically significant changes—all increases.
Limitations
Data from the early 20th century are somewhat less precise than more recent data because
there were fewer stations collecting measurements at the time, especially in the Southern
Hemisphere. The overall trends are still reliable, however. Where possible, the data have been
adjusted to account for any biases that might be introduced by factors such as station moves,
urbanization near the station, changes in measuring instruments, and changes in the exact times
at which measurements are taken.
Hawaii and U.S. territories are not included, due to limitations in available data.
Data Sources
The data for this indicator were provided by the National Oceanic and Atmospheric Administration’s
(NOAA’s) National Centers for Environmental Information (NCEI), which maintains a large
collection of climate data online at: http://www.ncei.noaa.gov. NCEI calculated global, U.S., andregional temperature and precipitation time series based on monthly values from a network of long-term monitoring stations. Data from individual stations were obtained from the Global Historical Climate Network and nClimDiv, which are NCEI’s online data sets (NOAA, 2021). Satellite data were analyzed by two independent groups—the Global Hydrology and Climate Center at the University of Alabama in Huntsville (UAH) and Remote Sensing Systems (RSS)—resulting in slightly different trend lines. References Blunden, J., and D.S. Arndt, eds. 2020. State of the climate in 2019. B. Am. Meteorol. 101(8):S1–S429. https://doi.org/10.1175/2020BAMSStateoftheClimate.1. IPCC (Intergovernmental Panel on Climate Change). 2013. Climate change 2013: The physical science basis. Working Group I contribution to the IPCC Fifth Assessment Report. Cambridge, United Kingdom: Cambridge University Press. www.ipcc.ch/report/ar5/wg1. NOAA (National Oceanic and Atmospheric Administration). 2021. Climate at a glance. Accessed February 2021. http://www.ncdc.noaa.gov/cag. USGCRP (U.S. Global Change Research Program). 2017. Climate science special report: Fourth National Climate Assessment, volume I. Wuebbles, D.J., D.W. Fahey, K.A. Hibbard, D.J. Dokken, B.C. Stewart, and T.K. Maycock (eds.). https://science2017.globalchange.gov. doi:10.7930/J0J964J6
Visit https://www.epa.gov/roe to see the full exhibit.
Visit https://www.epa.gov/roe to see the full exhibit.
You can also read