Measuring digital trade in bop - A supplementary estimate of private household's digital purchases using internet data
←
→
Page content transcription
If your browser does not render page correctly, please read the page content below
Measuring digital trade in bop
A supplementary estimate of private household’s digital purchases using
internet data
Annette Meinusch and Benny Hessel, Deutsche Bundesbank
I. Motivation Internet and digitalization fundamentally change the way people, businesses and governments interact and open new windows to trade services internationally Examples: video streaming, online games, the purchase of apps and cloud computing Especially business to consumer (B2C) micro-transactions challenge compilers: measurement often falls outside of the traditional collection systems due to high exemption thresholds On the business side these thresholds are usually of minor relevance. However, in case of services consumed by households they lead to data gaps To close these gaps the Federal Statistical Office (Destatis) and the Deutsche Bundesbank initiated a project in 2018 to improve the measurement of digital trade Annette Meinusch, Deutsche Bundesbank February 2020 Page 2
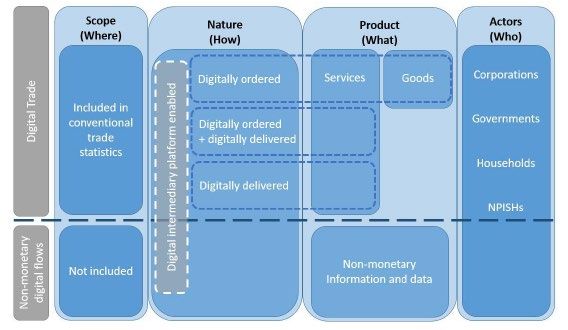
II. Definitions As a starting point, the new OECD-WTO handbook on "Measuring Digital Trade" was used to identify digital trade involved in cross-border transactions The focus was laid on micro transactions that fall below the €12,500 exemption threshold applied in Germany What: Services How: Digitally ordered, Platform enabled or digitally delivered Who: Business to Consumer Annette Meinusch, Deutsche Bundesbank February 2020 Page 3
III. Estimation Approach Bottom-up approach The online market was broken down into categories and the work between the institutions was assigned as follows: a. Video on demand b. Music on demand Deutsche Bundesbank c. Buying and using software d. Gambling Destatis e. Cloud Services Annette Meinusch, Deutsche Bundesbank February 2020 Page 4
III. Estimation Approach a) Video on Demand (VoD) Estimates are based on a 2018 consumer panel, which was carried out at the behalf of Germany’s national film funding institution (FFA) Aggregate sales for VoD for Germany in 2017 account for €0.77 billion The share of video on demand that is relevant for the balance of payments (non- resident providers) is set as being 38% (Goldmedia) of total sales €290 million Sales in € bn, Sales Year according to in € bn, consumer panel non-resident 2013 0.120 0.046 2014 0.150 0.057 2015 0.423 0.161 2016 0.545 0.207 2017 0.768 0.292 Annette Meinusch, Deutsche Bundesbank February 2020 Page 5
III. Estimation Approach b) Music on Demand Source: Federal Music Industry Association (BVMI) German digital music sales account for €0,741 billion in 2017 Included: − Music downloads − Audio streaming − Real tones − Digital audio books Roughly 90% of sales from music on demand is generated by non- resident providers (Statista) Annette Meinusch, Deutsche Bundesbank February 2020 Page 6
III. Estimation Approach
 b) Music on Demand - Adjustments

 Sales in € bn, according to
 Year Sales in € bn, non-resident
 consumer panel

 2008 0.140 0.126
 2009 0.163 0.147
 2010 0.203 0.183
 2011 0.247 0.222
 2012 0.294 0.265
 2013 0.328 0.295
 2014 0.371 0.334
 2015 0.486 0.437
 2016 0.604 0.544
 2017 0.741 0.667

Annette Meinusch, Deutsche Bundesbank
February 2020
Page 7
III. Estimation Approach
 c) Buying and using software

Buying and using software can be broken down into the following two sub-
categories

 c1. Mobile applications (incl. games) for smartphones and tablets

 c2. Video games for PC/games consoles as well as online or browser
 games

Annette Meinusch, Deutsche Bundesbank
February 2020
Page 8
III. Estimation Approach c1) Mobile applications (incl. games) for smartphones and tablets The German app market is estimated to be worth €1.17 billion Publishers of third-party apps use Android stores as sales platforms We assumed that the global market shares of Apple and Android stores are equivalent to their market shares in Germany Apple Store 41 bn US Dollar share of total app market sales of 50.6% Android Stores 40 bn US Dollar share of total app market sales of 49.4% − Apple Store sales in Germany: €0.592 billion − Android Store sales in Germany: €0.578 billion For the Android stores, using different sources, the assumption was made that 10% of sales (€0.0578 billion) are generated by German publishers and are not relevant to the balance of payments Preliminary result: The total amount of sales was estimated at € 1.11 billion Source: APPANNIE https://www.appannie.com/de/ is the leading provider of app market data Annette Meinusch, Deutsche Bundesbank February 2020 Page 9
III. Estimation Approach c1) Mobile applications (incl. games) for smartphones and tablets Adjustment for sales billed via one of the two app stores (Android Stores and iTunes) for transactions which are included in the “video on demand” and “music on demand” segment Sales Of which: Of which: Sales in € bn Year Growth acc. to Bitkom in € bn Video on demand Music on demand excl. VoD and MoD 2009 732.1% 0.017 0.006 0.011 2010 316.3% 0.072 0.007 0.065 2011 149.5% 0.180 0.009 0.171 2012 77.7% 0.319 0.011 0.308 2013 27.2% 0.406 0.001 0.013 0.392 2014 66.2% 0.675 0.001 0.015 0.659 2015 41.6% 0.955 0.009 0.017 0.929 2016 13.1% 1.081 0.011 0.022 1.048 2017 3.6% 1.110 0.016 0.027 1.067 Source: Study provided by Bitkom, Germany’s digital association Annette Meinusch, Deutsche Bundesbank February 2020 Page 10
III. Estimation Approach c2) Video games for PC / games consoles / online or browser games Sales can be broken down into seven categories Games for PC /Mac Adjustments × Share of Games for TV consoles downloads − Correction for physical games − Elimination of category “Games for mobile Games for handhelds phones / smartphones / tables“ − Correction for In-App Purchases Games for mobile phones / smartphones / − Correction for German publisher tables Subscriptions / monthly fees for online games Share of sales from German games Monthly fee for online networks developments - In-App Spending on virtual goods in games purchases 2014 2015 2016 2017 = 6.9% 6.5% 6.4% 5.4% Sales in Germany × 1 − = Source: Game - the association of the games industry Games BOP Annette Meinusch, Deutsche Bundesbank February 2020 Page 11
III. Estimation Approach d) Gambling The German Interstate Treaty on Gambling came into force on 1 July 2012 The state governments’ gambling supervisory authorities have been drawing up annual reports since then (2014-18) Those include information on − private sport and horse racing betting − online casino games − online poker − online secondary lotteries Annette Meinusch, Deutsche Bundesbank February 2020 Page 12
III. Estimation Approach d) Gambling Gross gambling revenue = gross stakes - winnings paid out Gross gambling revenue also includes a portion of sales that is generated not online but at a gambling outlet Gross gambling revenue Gross gambling revenue € million Share at Year € million Gambling outlets gambling outlets online only and online 2012 418 21% 330 2013 1,673 21% 1,322 2014 1,746 23% 1,344 2015 2,270 19% 1,839 2016 2,558 20% 2,046 2017 3,284 21% 2,594 Source: State governments’ gambling supervisory authorities, annual reports Annette Meinusch, Deutsche Bundesbank February 2020 Page 13
III. Estimation Approach e) Cloud Services Although households get a certain amount of free storage space free of charge from their internet provider some of them buy extra space To calculate purchases of extra storage space by households a model was developed which uses information from 1. ICT survey which contains information on cloud usage 2. Internet research on storage space provide free of charge by different providers prices for cloud purchases Household purchases of storage space 3. Share of German providers Year abroad € million 2010 37 Assumption: around 5% of cloud users do 2011 51 indeed purchase storage space from abroad 2012 64 2013 87 2014 123 2015 155 2016 184 2017 218 Annette Meinusch, Deutsche Bundesbank February 2020 Page 14
IV. Results I In 2019, estimated digital trade of German households amounted to € 7,426 million €m 2009 2010 2011 2012 2013 2014 2015 2016 2017 2018 2019 Apps 11 65 171 308 392 659 929 1,048 1,067 1,139 1,174 Games 258 344 390 339 370 589 690 812 995 1,219 1,443 Video 46 57 161 207 292 412 531 Music 146 182 222 264 295 334 437 544 667 779 923 Gamb 330 1,322 1,344 1,839 2,046 2,594 2,824 3,054 Cloud 0 37 51 64 87 123 155 184 218 258 298 Total 415 628 0.8 1,305 2,512 3,106 4,211 4,841 5,873 6,672 7,426 Annette Meinusch, Deutsche Bundesbank February 2020 Page 15
IV. Results II Data for digital household purchases is already included in German bop data (debits) in € m 2014 2015 2016 2017 2018 2019 Total Services 254,428 272,197 285,599 303,693 311,333 293,894 (debits) Digital Purchases 3,106 4,211 4,841 5,873 6,672 7,426 abroad Share of digital purchases in 1,2% 1,5% 1,7% 1,9% 2,1% 2,5% total service expenditures Annette Meinusch, Deutsche Bundesbank February 2020 Page 16
IV. Results III Effect of digital purchases on the net service balance (-44,2% in 2019) in € m Effect of digital purchases on the net service balance 0 2014 2015 2016 2017 2018 2019 (5’000) (10’000) (14’014) (15’000) (15’031) (16’065) (16’973) (16’802) (19’242) (20’000) (20’686) (21’814) (21’938) (22’767) (24’228) (25’000) (25’873) (30’000) Net Service Balance excl. Digital Purchases Net Service Balance Annette Meinusch, Deutsche Bundesbank February 2020 Page 17
V. Conclusions Bottom-up approach delivers a proxy for service debits of households provided via the internet Estimation model is flexible and expandable − implementation of other categories / subcategories (e.g. e - learning) − outdated categories can be excluded when appropriate Main data sources and data providers are known, which simplifies data updates in the future Use of internet data allows for a timely provision of information without the implementation of costly data collection methods such as household surveys Country breakdown is still to be calculated By using internet data compilers face the risk of losing access to data sources Quality issues: utmost care regarding sample sizes and the reputation of the data providers Project has to be seen as a first step to better measure internet induced micro-transactions in bop and provide data on digital trade according to the definitions of the handbook Annette Meinusch, Deutsche Bundesbank February 2020 Page 18
You can also read