DATA VISUALIZATION WITH ZABBIX (VIZUALIZACE DAT V ZABBIXU) - CoreIT
←
→
Page content transcription
If your browser does not render page correctly, please read the page content below

DATA VISUALIZATION WITH ZABBIX (VIZUALIZACE DAT V ZABBIXU)
1   LATEST DATA
    (Poslední hodnoty)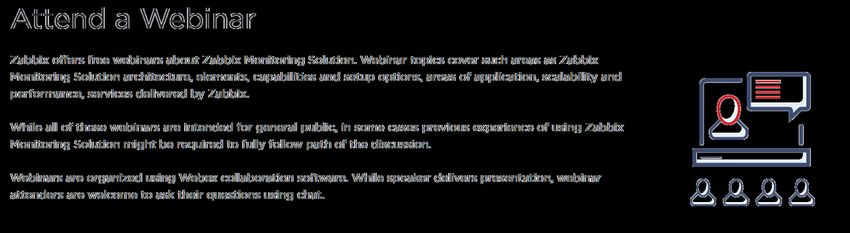
LATEST DATA
  Monitoring > Latest data
  Performance data for a selected server/group
  Simple graphs
  Plain text information
  Config details
LATEST DATA

      In the top right, there is a time period selector
      It allows to select required period with a mouse click
      This allows to show values for specific time period
SIMPLE GRAPHS
                  History (raw data)

                Trends (min, avg, max)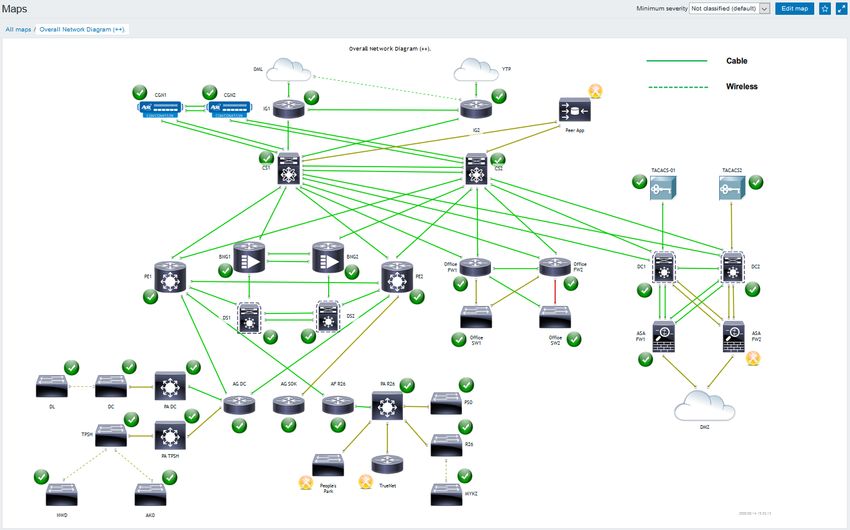
SIMPLE GRAPHS

       1

       2
                3

                    Normal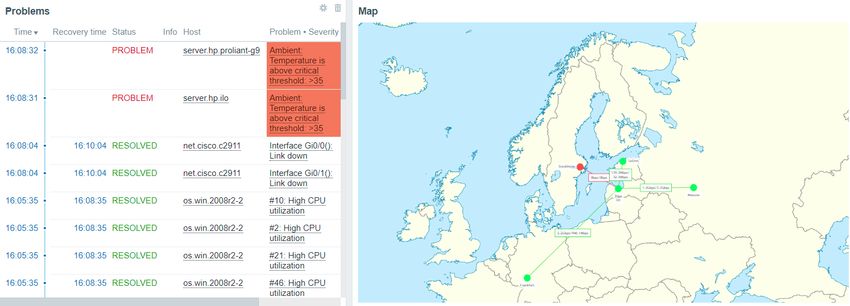
SIMPLE GRAPHS

                Stacked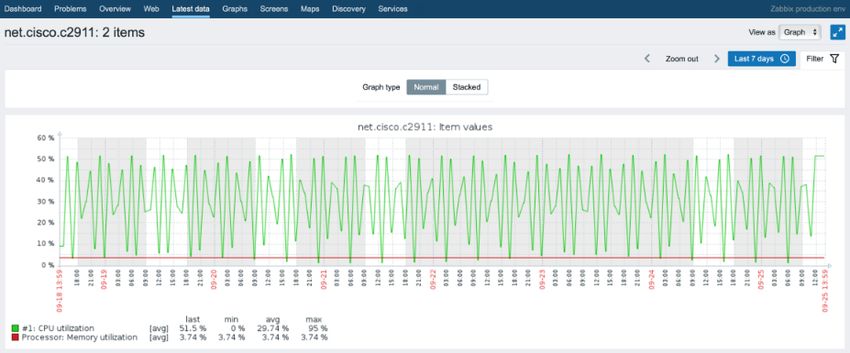
APPLICATIONS
      Group of items
      One application, many items
      One item, many applications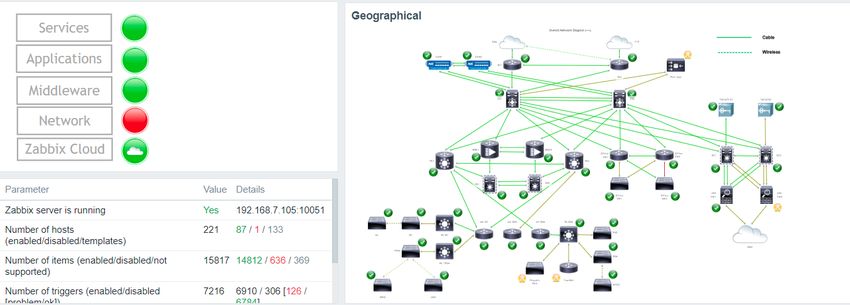
2   CLASSIC AND NEW GRAPHS
    (Grafy a nová verze grafů)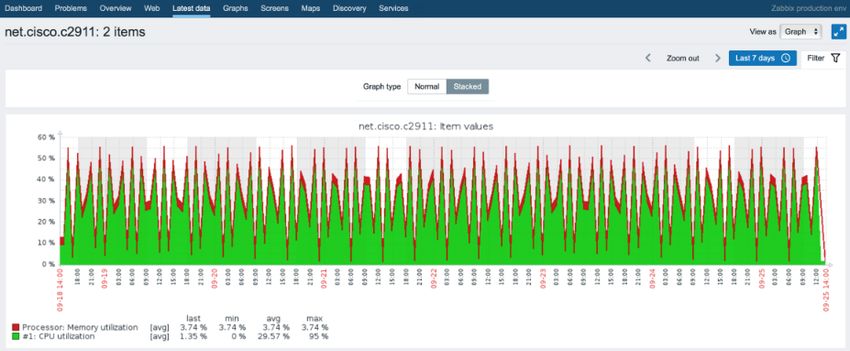
CUSTOM GRAPHS (LEGACY)
Configuration > Templates > Graphs
Multiple items in a single customized graph
Multiple graph types
     Normal
     Stacked
     Pie
     Exploded pie
CUSTOM GRAPHS (LEGACY) Legend, working time, trigger line, percentile lines (left/right) Automatic, fixed or referenced Y axis min/max Multiple items on two axis with different colors & draw styles
CUSTOM GRAPHS (LEGACY)
Ability to select what values will be displayed for Trend graphs:

     avg - display the average values
     last - display the latest values
     max - display the maximum values
     min - display the minimum values
     all - display all possible values
CUSTOM GRAPHS (NEW) In version 4.0 the graph widget was updated to use redesigned new graphs! Legacy graph widget has been renamed to Graph (classic)
CUSTOM GRAPHS (NEW)
Uses vector image file format
Displaying of values is based on Data sets, which are comprised of hosts and items
Wildcard use is supported when referencing hosts/items!

Parameters of a Data set element can be overriden in the “ Overrides” section
CUSTOM GRAPHS (NEW)
The following graph types are supported for the New graph:
  Line
  Points
  Staircase
  Bar
3   MAPS
    (Mapy)
MAPS
A Map is a graphical representation of
data
Real-time data can be shown (e.g. CPU
load, bandwidth, etc.)
If some event occurs, icon status or
link color on the map is changed
automatically
Access to scripts, as well as links to
other pagesMAPS Configuration for the entities is available under Monitoring All users in Zabbix (including non-admin users) can create network maps
MAPS
Map properties:                       Map elements:
   Name, dimensions    Icon mapping      Image
   Background          Min. trigger      Trigger
   image               severity          Host
   Icon highlighting   URLs              Host group
   Icon label type                       Map
   and location                          Shape
MAP DETAILS
 Different icons for different states
 Custom URLs & labels
 Drag and drop editing
 Moving and copy-pasting
 Icon alignment, macro expanding
 Map links with labels and different styles
 Macros in labels for elements and links
MAP OPTIONS EFFECT
               None   Highlight   Mark   Don't expand   All
      OK

    Disabled

    Problem

     Recent
    problem
ACKNOWLEDGE STATUS
MAP ICONS
Icons are used to represent map elements:
     Host - icon representing status of all triggers of the host
     Map - icon representing status of all elements of a map
     Trigger - icon representing status of one or more triggers
     Host group - icon representing status of all triggers of all hosts belonging to the selected
     group or host group elements
     Image - an icon, not linked to any resource

To add an element to map user must have at least read permission
Map elements that user does not have read permission to are displayed with a
greyed-out icon
MAP SHAPES In addition to icons, it is also possible to add shapes Shapes are just a visual representation For example, a rectangle shape can be used as a background to group some hosts
CUSTOM ICONS AND BACKGROUNDS
You can upload your own custom icons/backgrounds in the Administration –
General – Images section!

  Select the Type of the image that you wish to upload

  Upload the image
MAP HINTS
 You can define map hierarchy by using submaps
 To display data on Elements or links, use map labels, ex:
 {{HOST.HOST}:system.cpu.load.last(0)} or {Zabbix server:system.cpu.load.last(0)}
 If links are the same color as the background, they will appear only when a
 problem is active!
 Use macros in URL’s: {$HOST.CONN}, {$HOST.IP}, {$HOST.DNS}
 By default the links are a straight line - route links by using invisible icons or
 shapes
 Use icon mappings to assign icons to matching hosts automatically
4 ICON MAPPING
(Mapování ikon)ICON MAPPING Map elements can have different icons assigned to them It is possible to map Icons to host elements automatically by using icon mapping Icon mapping is based on Host inventory values Icon map has to be defined in Administration – Icon mapping The specific Icon map has to be selected in the map Properties section
INVENTORY
You can use host inventory to either populate the inventory values manually or
automatically

                         Populate inventory value manually

                                                             Populate inventory value from item

In Automatic mode, the inventory values are obtained from any item on the host
CONFIGURING ICON MAPPING Create the Icon map Assign the icon map to your map Select “Automatic icon selection” on your host element If the “Automatic icon selection” is greyed out, make sure that the icon map is assigned in the map properties section!
5   DASHBOARDS
    (Dashboardy)
DASHBOARDS Zabbix Dashboard is your central points of monitoring. You can have a wide variety of different dashboards for different user groups A dashboard for your networking team An infrastructure overview dashboard based on your Zabbix maps A dashboard displaying live statistics of your business, e.g: website traffic And much, much more!
DASHBOARD WIDGETS
Dashboards consist of widgets.
Widgets can represent data related to wide variety of different Zabbix elements,
for example:
  Graphs
  Problems
  Maps
  Latest data
  External sites
DASHBOARD WIDGETS
Most of the widgets can be filtered by hosts, host groups, items, triggers and
customized in other ways:
DASHBOARD WIDGETS
Some widgets are interactive. For example, you can use a Map navigation tree
widget to switch between maps:
6   DEMONSTRATION
    (Ukázka)
CONTACT US:
To request a quote or additional info, please contact CoreIT sales
team via phone or email:
Phone: +420 840 771 177
Web: https://www.coreit.cz/
info@coreit.cz
Email:
tomas.hermanek@coreit.cz
https://www.linkedin.com/company/coreitcz/
LinkedIn:
https://www.linkedin.com/in/hermanekt/
https://twitter.com/CoreITcz
Twitter:
https://twitter.com/hermanekt
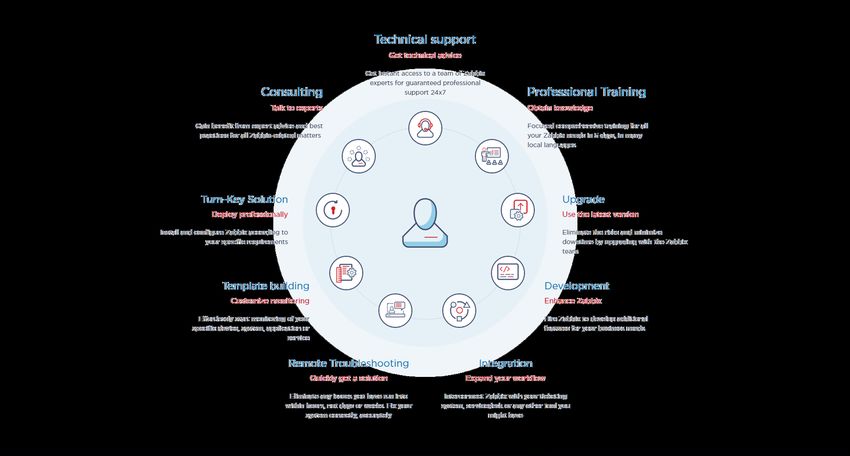
Tel. Tomáš Heřmánek: +420 732 447 184Zabbix services
Webinars

Next webinars in Czech:
https://www.zabbix.com/webinars?language=czech
Professional training program
          Zabbix training is designed to ensure knowledge transfer between the best experts in Zabbix and trainees in a
          short period of time.

                             Level 1                             Level 2                                 Level 3                             Level 4
  Zabbix Certified                     Zabbix Certified                    Zabbix Certified                        Zabbix Certified
  User (Available Online)              Specialist (Available Online)       Professional (Available Online)         Expert
  Use Zabbix frontend                  Setup & configure Zabbix            Manage big, distributed,                Design & maintain highly efficient &
  to view information.                 in SMBs or configure Zabbix         highly loaded installations             loaded setups with expertise in API,
  Know potential of Zabbix             in large companies                  in large companies                      HA/DR, and DB partitioning

  1 day                                5 days                              3 days                                  5 days

                                       Zabbix Certified                    Zabbix Certified
                                       Specialist Update                   Professional Update
                                       Designed for Zabbix 4.0 Certified   Designed for Zabbix 4.0 Certified
                                       Specialists only                    Professionals only

                                       1 day                               1 day

  Become Zabbix certified without attending the training.
  If you are certain of your knowledge, ZCU, ZCS and ZCP exams can be purchased separately.
  https://www.zabbix.com/training?language=czech#training_schedule
Zabbix demo
Video URL and more information: https://www.coreit.cz/monitoring-it-prostredi/
Live Zabbix DEMO: https://www.coreit.cz/zabbix/? Questions
(Otázky)! Thank you
(Děkujeme za pozornost)You can also read