In-situ Monitoring der Additiven Fertigung von Metallen im LPA Prozess mittels Optischer Emissionsspektrometrie (OES) und Thermografie (TT)
←
→
Page content transcription
If your browser does not render page correctly, please read the page content below
DGZfP-Jahrestagung 2021

 In-situ Monitoring der Additiven Fertigung
    von Metallen im LPA Prozess mittels
Optischer Emissionsspektrometrie (OES) und
            Thermografie (TT)
            Nils SCHEUSCHNER 1, Simon J. ALTENBURG 1, Anne STRAßE 1,
      Giuseppe PIGNATELLI 1, Christiane MAIERHOFER 1, Igor B. GORNUSHKIN 1,
                                 Andrey GUMENYUK 1
            1
              Bundesanstalt für Materialforschung und –prüfung (BAM), Berlin
                                        Kontakt E-Mail: nils.scheuschner@bam.de

Kurzfassung

Einer der aussichtsreichsten Ansätze, die Qualität und Sicherheit der gefertigten Teile in der
metallbasierten additiven Fertigung (AM) zu erhöhen und die Notwendigkeit aufwändiger
und zeitintensiver, zerstörender oder zerstörungsfreier Prüfungen (ZfP) nach der Fertigung
zu verringern, liegt in dem Einsatz von in-situ Prozessüberwachungstechniken. Viele
wichtige Prozessgrößen bei der additiven Fertigung sind thermischer Natur, wie z.B. die
Temperatur des Schmelzbades. Aufgrund der Zugänglichkeit zum Werkstück während des
Bauprozesses bieten sich optische Verfahren zur Temperaturbestimmung an. Für die
Thermografie und Optische Emissionsspektrometrie im IR-Bereich, welche für die in-situ
Anwendung prinzipiell als geeignet angesehen werden können, gibt es allerdings noch wenig
konkrete praktische Umsetzungen, da die Möglichkeiten und individuellen Grenzen dieser
Methoden, angewendet auf AM, noch nicht ausreichend erforscht sind. Aus diesem Grund
verfolgt die BAM mit dem Projekt „Process Monitoring of AM“ (ProMoAM) im Themenfeld
Material das Ziel, Verfahren des Prozessmonitorings zur in-situ Bewertung der Qualität
additiv gefertigter Metallbauteile weiterzuentwickeln.
        Im Beitrag wird der Fokus auf eine Versuchsserie gelegt, bei der Aufbau von
Probekörpern aus dem austenitischen Edelstahl 316L mittels Laser-Pulver-
Auftragschweißen (LPA) durch od. mit Hilfe von IR-Spektrometrie und Thermografie in-
situ überwacht wurde. Hierbei stellen u.a. die hohe Bandbreite der zu messenden
Temperaturen, die Bestimmung der Emissivität und ihre Änderung bei Phasenübergängen
des Metalls große experimentelle Herausforderungen dar, wobei jede Methode individuelle
Vor- und Nachteile aufweist, welche verglichen werden.

                                                                 1
Lizenz: https://creativecommons.org/licenses/by-nd/4.0/deed.de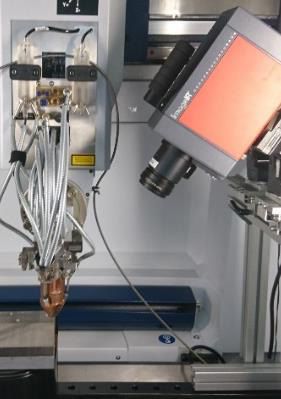
10-05-2021

    IN-SITU MONITORING DER ADDITIVEN FERTIGUNG VON METALLEN
    IM LPA PROZESS MITTELS OPTISCHER EMISSIONSSPEKTROMETRIE
    (OES) UND THERMOGRAFIE (TT)

    N. Scheuschner, S. J. Altenburg, G. Pignatelli, C. Maierhofer, A. Straße,
    I.B. Gornushkin and A. Gumenyuk

1

    Outline

    •   Introduction
         • Thermal radiation
         • The spectrum of molten pools
    •   Experimental setup and techniques
         • AM-Machine
         • Thermography cameras
         • Optical emission spectroscopy
    •   Results
         • SWIR vs MWIR thermography
         • Temperature determination using regression analysis (OES)
         • Comparison OES vs Thermography
    •   Summary and Outlook

    10-05-2021

2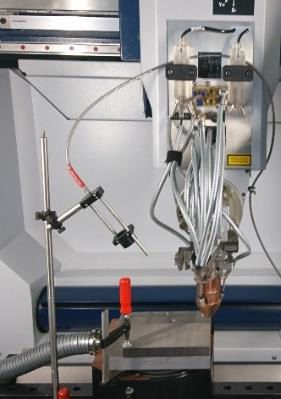
Thermal radiation

    Every object with T>0 emits EM radiation:

                                                              350K                                                                 5900K

                                                                                                               Intensity
                                         Intensity
                                                                                                                                 VIS

             350K                                                                5900K
                                                     Wavelength (µm)                                                       Wavelength (µm)

                         With increasing temperature the maximum of the radiation shifts
                         to smaller wavelengths and increases in intensity

    10-05-2021              Comparison of in-situ OES and thermography in the LMD process

3

    Thermal radiation
    Planck‘s law – Black-body radiation

                        Planck‘s law describes the intensity for black-bodies (100% optical absorption)

                                 5900K                                                                  Problem :

                                                                                            Real objects are not perfect black
     Intensity (a.u.)

                                                                                             (optical absorption < 100%) !
                           2400K
                                                                                                         Effect :

                                  900K                                        Lower optical absorption results in lower thermal radiation
                          VIS

                                                                                                        Solution :
                                           300K
                                                                               Introducing a multiplicative correction term (Emissivity)
                                                                                               in the range of 0 to 1
                                Wavelength (µm)

            Allows to determine the temperature by intensity or shape!

    10-05-2021

4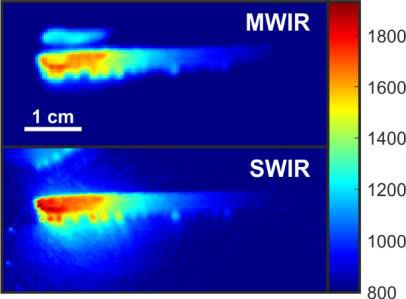
Thermal radiation
    Emissivity

                                                         2400K            Emissivity of the molten pool
                                                                          can depend on:
    Intensity (W/m²m)

                                          ϵ=1
                                                                          •   Material / Oxidation
                                                                          •   State of matter
                                                                          •   Temperature
                                                                          •   Angle
                                                                          •   Surface roughness
                                                                          •   Wavelength

                                ϵ = 0.4                                       The emissivity is needed to
                                                                                      determine
                                                                          the temperature from the intensity
                                       Wavelength (µm)

    10-05-2021

5

    The optical spectrum of molten pools

                        Transmission of the         Thermal Radiation +                       Theoretical
                            atmosphere                Atomic Emission                    Molten Pool Spectrum

    10-05-2021

6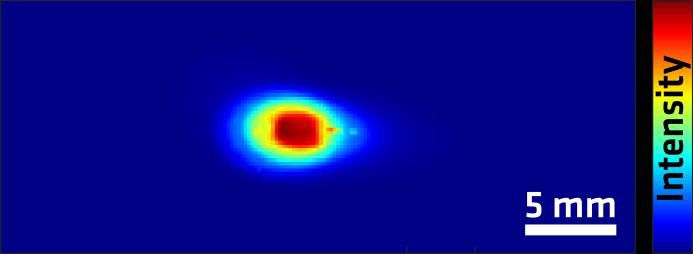
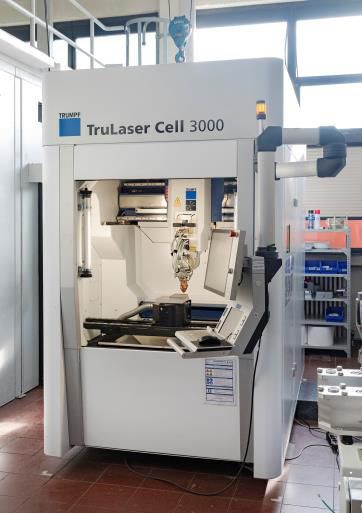
Experimental Setup
    AM-Machine

    Laser metal deposition (LMD):

    TruLaser Cell 3000 (Trumpf)
    + TruDisk 16002 (Trumpf, wavelength: 1030 nm)

    Powder feeder: Flowmotion Twin (Medicoat) with
    oscillating conveyor

    ▪   Build chamber: 800 × 600 × 400 mm³
    ▪   Five-axis-machine
    ▪   Coaxial three-jet-nozzle
    ▪   Max. laser power (LMD): 5 kW
    ▪   Max. focal diameter: 3,8 mm
    ▪   Typ. Welding speed: 20 mm/s

    10-05-2021

7

    Experimental techniques
    Thermography
                                     IR sensitive camera / 2D sensor array:
                                     •   One intensity value per pixel: No spectral data
                                     •   Determination of temperature: Radiometric model
                                     •   Spatialy resolved

8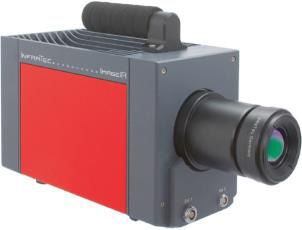
Experimental techniques
                   Thermography

                                                                           MWIR Camera                    SWIR Camera
                                        5900K
                                                                       •                             •   Allied Vision Goldeye
                                 SWIR

                                                                           Infratec ImageIR 8300

                                                    LWIR
                                                                       •   3 - 5 µm                  •   0,9 - 1,7 µm
                                                                       •   250 x 120 x 160 mm        •   78 x 55 x 55 mm
                                                                       •   3,3 kg                    •   0,35 kg
     Intensity (a. u.)

                               2400K
                                                                       •   Fixed position            •   Fixed position or moving

                                        900K
                                           MWIR
                         VIS

                                                  300K
                                                                                                               ~30k€

                                        Wavelength (µm)

                                                                                ~100k€

9

                   Experimental techniques
                   Optical Emission spectroscopy
                                                           •   Lens collects radiation analyzed by spectrometer

                                                           •   Spectroscopic data: Emission Lines + Thermal Radiation

                                                           •   Ø ROI ~ 2mm; No spatial resolution

                                                           •   Fixed position or moving with the molten pool

                                                           Spectro
                                                            meter

10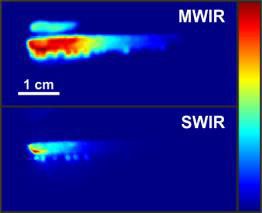
Results
     SWIR vs MWIR thermography

                                                               10 layers single welding line
                                                                     “Wall” structure

                                                       OES, SWIR and MWIR simultaneously!
         Ø laser spot: 2.4 mm
         Laser power: 1.2 kW
         Rate of travel: 21.7 mm/s
         Material: AISI 316L

     10-05-2021         Comparison of in-situ OES and thermography in the LMD process

11

     Results
     SWIR vs MWIR thermography

       Ø laser spot: 2.4 mm                               layer 6
       Laser power: 1.2 kW
       Rate of travel: 21.7 mm/s
       Material: AISI 316L
                                                                                                 Temperature

       Wall build, layer 6

                                                          layer 6
                  Black body temperature

                                Intensity

                                                             Solidification temperature: 1650K
                                                             • MWIR → adjustment of emissivity
                                                             • SWIR → radiometric model

     10-05-2021

12
Results
SWIR vs MWIR thermography
Temperature of the solid phase equal
for SWIR and MWIR
→ SWIR useable
Temperature (K)
Liquid phase shows deviating
temperatures
→ Effect of the emissivity change
Cooling process slows down for higher
layer numbers
layer 1 layer 10 → Effect on microstructure?
layer 6
time (s)
14-05-2019
13
Results
Temperature determination using regression analysis (OES)
Reference: Graphite furnace
1900 K
atmospheric
transmission 1900 K
Lord, S. D., 1992, NASA Technical Memorandum 103957
Fit results 20-50 K to high
10-05-2021
14Results
Temperature determination using regression analysis (OES)
Correction applied at different temperatures:
1500 K 2400 K
1900 K
10-05-2021
15
Results
Temperature determination using regression analysis (OES)
OES fixed relative to molten pool
Cooling
Welding
Solidification plateau
Temperature to high
1800K instead of 1650K
10-05-2021
16Results
Temperature determination using regression analysis (OES)
1650 K
14-05-2019
17
Results
Temperature determination using regression analysis (OES)
2150 K
Solidification plateau
• Emissivity constant in spectral region.
• Accurate Temperature of the liquid phase!
10-05-2021
18Outlook and Summary
OES:
• Accurate temperature of the liquid phase from fit
• No atomic emission lines at normal conditions
• Ongoing work: absorption spectroscopy for plume composition
Thermography:
• Accurate temperature of the solid phase using radiometric model
• Overheating and Cooling curves → Microstructure?
• Shape/Size of molten pool → Balling instability?
Thank you for your attention!
10-05-2021
19You can also read