EXPLORER C50 - iThera Medical
←
→
Page content transcription
If your browser does not render page correctly, please read the page content below
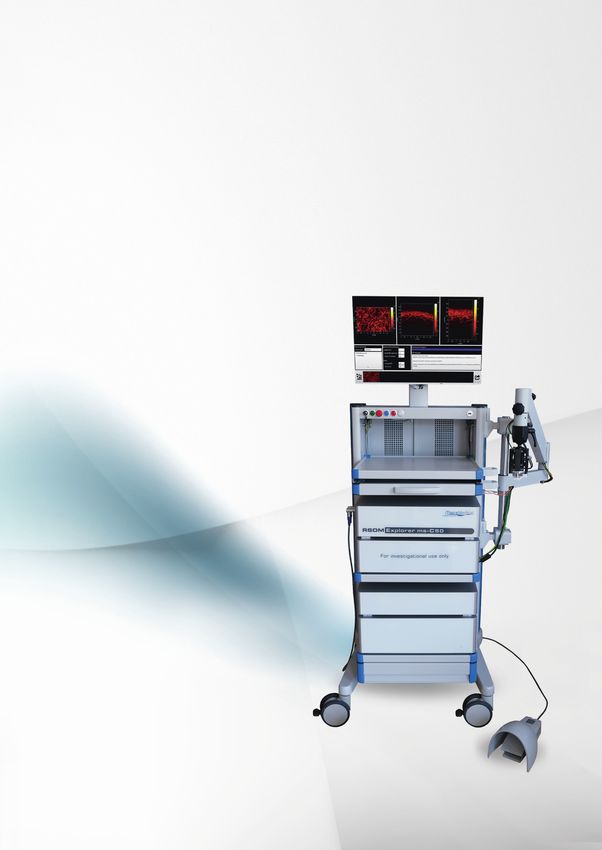
RSOM                                          EXPLORER C50
                          RASTER-
                          SCANNING
                          OPTOACOUSTIC
                          M E S O S CO P Y

RSOM Explorer  C50
RSOM Explorer  ms-C50
• Optoacoustic mesoscopy for clinical research
• Up to 10 μm resolution at 1-2 millimeters depth
• Visualization of microvasculature

The device is for investigational use only.

                                                     Listening to Molecules
TECHNOLOGY
IMAGE GENERATION
• Illumination of tissue with nanosecond laser pulses
• Ultra-wide bandwidth acoustic signal detection
• Live preview of full cross-section

RECONSTRUCTION
• Fast multi-frequency-band image reconstruction
• Low-frequency band (11-33 MHz) for larger vessels
• High-frequency band (33-99 MHz) for capillaries

VISUALIZATION
• MIP (maximum intensity projection) and 3D visualization
• Imaging depth up to 2 mm with 10 µm axial resolution
• Data and image export to 3rd party software

MULTISPECTRAL
• Laser with 4 wavelengths (532, 555, 579, 606 nm)
• Spectral unmixing for oxy- and deoxy-hemoglobin, melanin
• Map and quantify oxygen saturation

    OPTIONS AND                 Options:                        Accessories:
                                • Multispectral illumination   • Coupling membranes
    ACCESSORIES                 • Advanced user training        • L aser safety goggles

IMAGING WORKFLOW
                 LASER EXCITATION
                         +                                                                             MULTISPECTRAL IMAGING
              ULTRASOUND DETECTION
                                                                                                            Laser wavelengths
                                                                                                                                         532 nm
                                                                 absorption coefficient (cm-1)

                                                                                                                               Melanin
                                                                                                 300                             HbO 2
                                                                                                                                   Hb    555 nm
                                             raster scan                                                                                 579 nm
                                                                                                 200
                                                                                                                                         606 nm

                                             human skin
                                                                                                 100

                                                                                                   0
                                                                                                   450     500    550    600       650
                                                                                                            wavelength (nm)

       FREQUENCY BAND RECONSTRUCTION

                                                                                                             Hb
                                                                                                                                               Hb
                                                                                                                                             HbO 2
                                                                                                                                           Melanin
                  11-33 MHz             33-99 MHz                                                                                              100%
                                                                                                                   rSO 2 map
                                                                                                           HbO 2
                                                                                                                                                  HbO2 saturation

                     Merge                     3D                                                        Melanin   500 µm
                                                                                                                                                   0%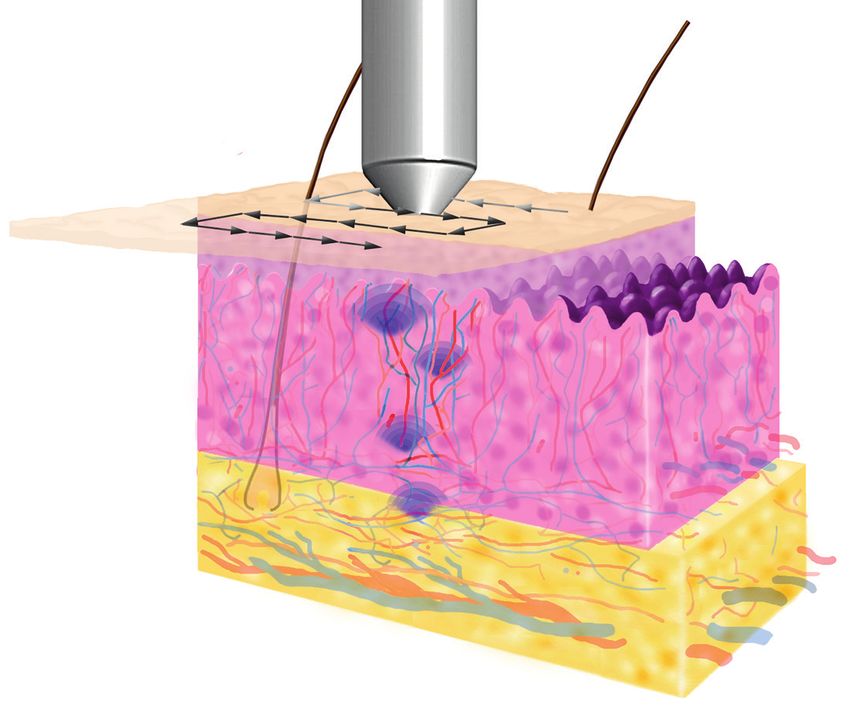
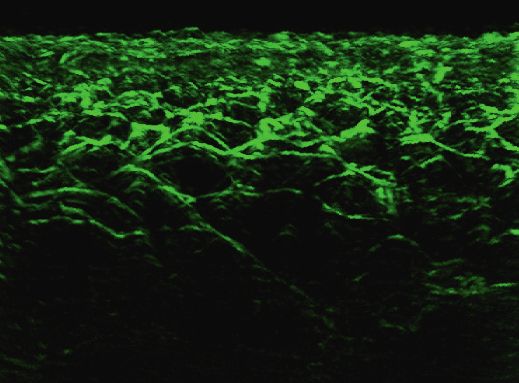
APPLICATIONS
RSOM has been applied in a variety of clinical applications, including the examples below:
Psoriasis plaque Healthy skin
INFLAMMATORY SKIN DISEASE
hair
Assess disease biomarkers in psoriasis1 EP EP
By comparing psoriatic and healthy human skin, researchers
identified epidermal thickening and increased dermal blood
volume. Using label-free biomarkers, investigators established DR DR
non-invasive quantitative metrics that correlated well with
500 µm
gold standard assessments such as the PASI index.
EP = epidermis / DR = dermis
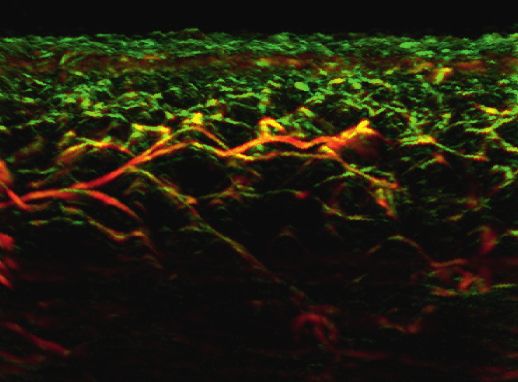
Diabetes Healthy skin
MICROCIRCULATION
EP EP
Use skin as a surrogate for systemic disease2
Diabetes mellitus affects the microvasculature of several DR DR
organs. However, the skin is the most accessible organ and
therefore could offer a window into this systemic disease.
Dermal microvascular density, total dermal blood volume and 500 µm
epidermal parameters were used to study disease severity.
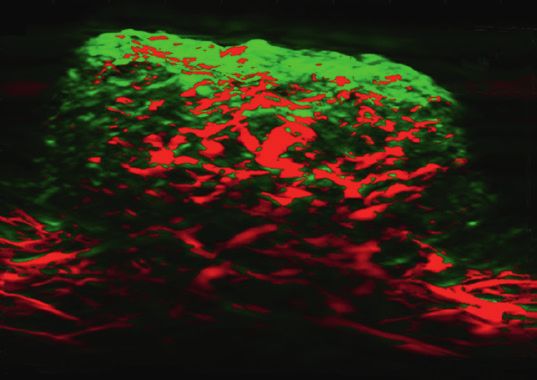
Baseline Occlusion Release
OXYGENATION
Monitor oxygen delivery in microvasculature3 EP
Using currently available clinical imaging tools, it is difficult
to non-invasively observe hemodynamic regulation in the
DR
peripheral vessels. Vascular occlusion demonstrated the
ability to monitor oxygen saturation changes in systemic vas- 500 µm
cular disease and potentially during therapeutic interventions. Hb HbO 2 Eumelanin
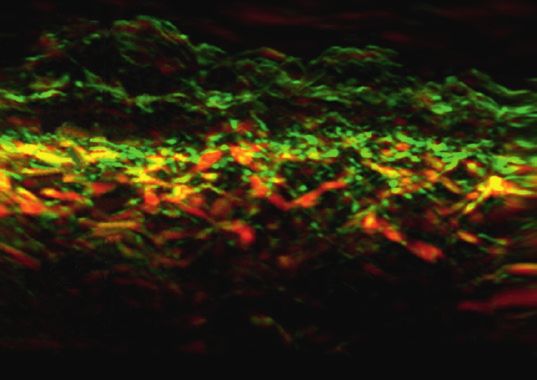
Pigmented nevus Melanoma lesion
SKIN CANCER
Visualize angiogenesis in high resolution 4 EP EP
Tumor growth and metastasis depend on angiogenesis.
Visualizing vascular characteristics in 3D over time can allow DR
DR
the study of microcirculation in tumors and downstream
effects such as hypoxia and acidosis. These patterns could
potentially improve diagnostics and assessment of thera- 500 µm
peutic efficacy. Hemoglobin Melanin
Healthy skin Allergic reaction
SKIN AGING
Quantify new microvascular biomarkers 5 EP
EP
Aging of the skin, driven in part by age-dependent changes
in the immune system, involves atrophy of the dermis and DR
DR
epidermis. Changes in skin structure and vascularity have
been visualized by RSOM in allergic patch testing and fol- 200 µm
lowing ultraviolet light exposure.
1) A guirre J et al., Precision assessment of label-free psoriasis biomarkers with ultra-broadband optoacoustic mesoscopy,
Nature Biomedical Engineering volume 1, Article number: 0068 (2017).
2) H
e H et al., Optoacoustic skin mesoscopy opens a window to systemic effects of diabetes,
medRxiv, June 2020. https://doi.org/10.1101/2020.06.29.20142273.
3) A
ttia ABE et al., Microvascular imaging and monitoring of hemodynamic changes in the skin during arterial-venous occlusion using
multispectral raster-scanning optoacoustic mesoscopy, Photoacoustics. 2021 Apr 20;22:100268.
4) H
e H et al., Fast raster-scan optoacoustic mesoscopy enables assessment of human melanoma microvasculature in vivo,
submitted, medRxiv preprint available, 2021.
5) H
indelang et al., Optoacoustic mesoscopy shows potential to increase accuracy of allergy patch testing,
Contact Dermatitis. 2020 Sep;83(3):206-214.
The device is for investigational use only.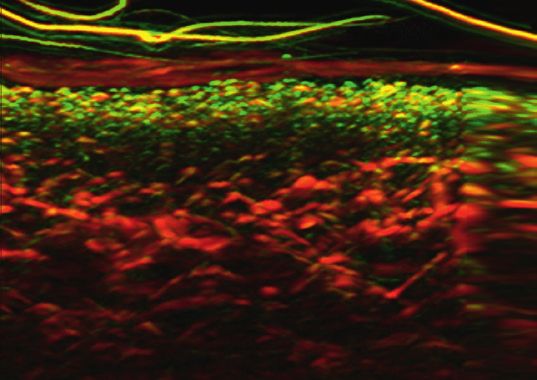
TECHNICAL SPECIFICATIONS

Specifications                                       RSOM Explorer C50                                       RSOM Explorer ms-C50
Imaging acquisition
 Field of view                                                                        Up to 6 x 6 x 3 mm
 Penetration depth                                                     Typically 1-2 mm (application-specific)
 Axial/lateral resolution                                                           up to 10 µm / 40 µm
 Acquisition time (FoV: 4 x 2 mm)                                ~35 s                                          ~120 s (4 wavelengths)
Key system components
Laser (operational parameters)
 Wavelengths                                                   532 nm                                           532, 555, 579, 606 nm
 Pulse repetition rate                                               ~1 kHz (set to measure below MPE limits)
 Pulse energy                                                                                 10-15 µJ
 Pulse width                                                    100%
General technical specifications
                                                                        Intel Xeon E3-.1225v6, 64 GByte RAM,
 Hardware scanner console
                                                                        4 TByte HDD data storage, 24’’ screen
 Operating system                                                                         Windows 10
 External interfaces                                               1 GBit Ethernet, remote interlock connector

                                                         70 x 74 x 175 cm                                           70 x 74 x 175 cm
 Dimensions (width x depth x height)                          135 kg                                                     165 kg

 Power                                                                   110–230 V, 50/60 Hz, max. 1,600 VA
 Laser classification                                                                         Class 3B

                                                                WARNING                                                    WARNING
                                                                LASER                                                      LASER
                                                                  3B                                                         3B
                                                     Maximum output: 100 μJ, 2.7 kHz                              Maximum output: 50 μJ, 2 kHz
                                                Pulse duration: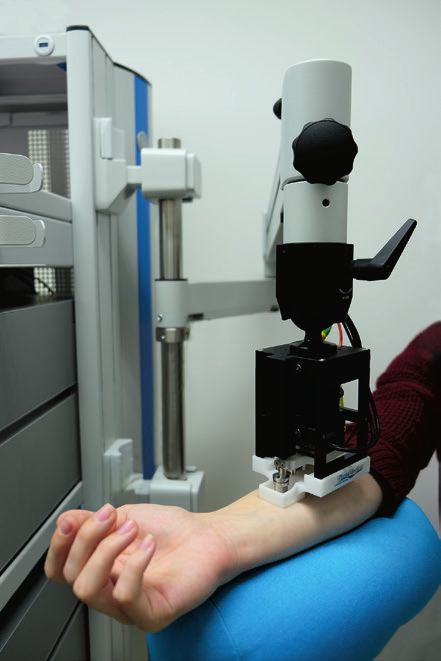
You can also read