Cytotoxicity assessment using automated cell imaging and live/dead assays
←
→
Page content transcription
If your browser does not render page correctly, please read the page content below
APPLICATION NOTE

Cytotoxicity assessment using automated
cell imaging and live/dead assays
Matthew Hammer and Oksana Sirenko, PhD | Applications Scientists | Molecular Devices

Introduction                                                                                 Benefits
Live/dead assays are utilized in a wide         kit enables characterization of a full     • U
                                                                                              tilize an efficient no-wash
variety of research applications including      concentration-response profile of test       homogenous assay protocol to
investigation of cytotoxic effects of various   compounds. The no-wash, homogeneous          measure cell viability
compounds, treatments, or changes in            assay eliminates washing steps that
gene expression. Automated cellular             can wash away dead and dying cells.        • Q
                                                                                              uantify live or dead cells
imaging and analysis provides an optimal        Fluorescent signals from calcein and         accurately
method to assess cell viability and             EthD-III can be detected and utilized to   • Generate statistically
cell death. In this application note, we        produce high quality images and analysis      relevant results quickly with
describe the use of the ImageXpress®            using the ImageXpress Pico system and         preconfigured analysis modules
Pico Automated Cell Imaging System and          CellReporterXpress software.
CellReporterXpress Automated Image
Acquisition and Analysis Software to image
cells treated with EarlyTox™ Live/Dead
                                                Materials
                                                • EarlyTox Live/Dead Assay Kit
Assay Kit.
                                                  •	Explorer Kit (2-plate size,
The EarlyTox Live/Dead Assay Kit contains            Molecular Devices P/N R8340)
markers for mammalian live and dead cells.        •	Bulk Kit (10-plate size,
Viable cells are stained with an intense             Molecular Devices P/N R8341)
green fluorescence in the cytosol by
                                                • HeLa cells (ATCC P/N CCL-2)
calcein AM. Non-fluorescent Calcein AM
permeates the intact cell membrane where        • HeLa media
the acetoxymethyl (AM) group is cleaved           •	Minimum Essential Medium complete
by intracellular esterases, yielding the             media supplemented with glutamine
fluorescent calcein molecule. The dead cell          and serum
marker, Ethidium homodimer-III (EthD-III),      • Staurosporine (Sigma P/N S5921)
is non-fluorescent and non-permeable            • Mitomycin C (Sigma P/N M4287)
to an intact plasma membrane. When              •	384-well black, clear-bottom
cell membrane integrity is compromised             microplates (Corning Falcon
in association with cell death, EthD-III           P/N 62406-490)
enters the cell and binds to nucleic acids,
                                                •	ImageXpress Pico Automated
resulting in a bright red fluorescence in
                                                   Cell Imaging System and
dead cells. Cytotoxic events that affect
                                                   CellReporterXpress software
cell membrane integrity can be accurately
assessed using this method. The assay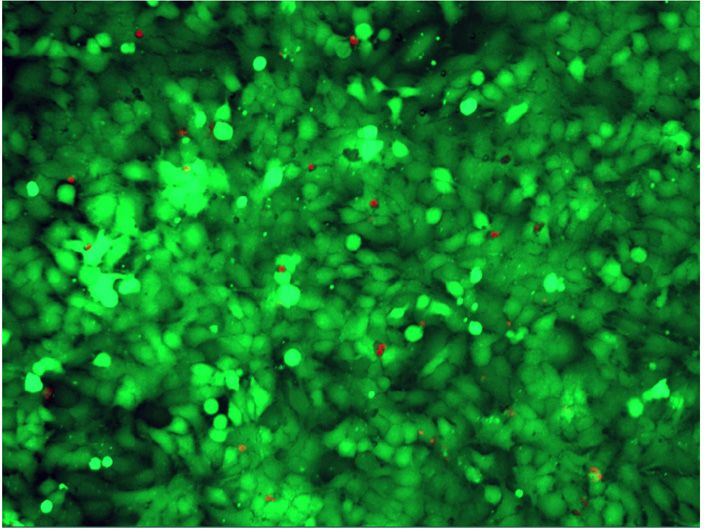
Methods Images Masks
HeLa cells, plated at 5,000 cells/well into
a black, 384-well clear-bottom microplate,
were grown overnight in a 37°C, 5% CO2
incubator. The cells were treated for 24
hours with staurosporine (general protein
Control
kinase inhibitor and potential anti-cancer
therapeutic) or mitomycin C (potent DNA
crosslinker and chemotherapeutic) in
quadruplicates with a 1:3 serial dilution
starting at highest concentrations of 10 µM
staurosporine and 300 µM mitomycin C.
After the compound treatment, the cells
were stained with the Live/Dead assay
kit reagents in combination with Hoechst
Staurosporine
33342 nuclear dye (Thermo Fisher). Half
of the volume in each well was removed
and replaced with a 2x stain solution
of Calcein AM and EthD-III. The final
concentrations of stains were 2 µM Calcein
AM and 3 µM EthD-III. The plates were
then incubated at 37°C, 5% CO2 for 30
minutes prior to the addition of Hoechst
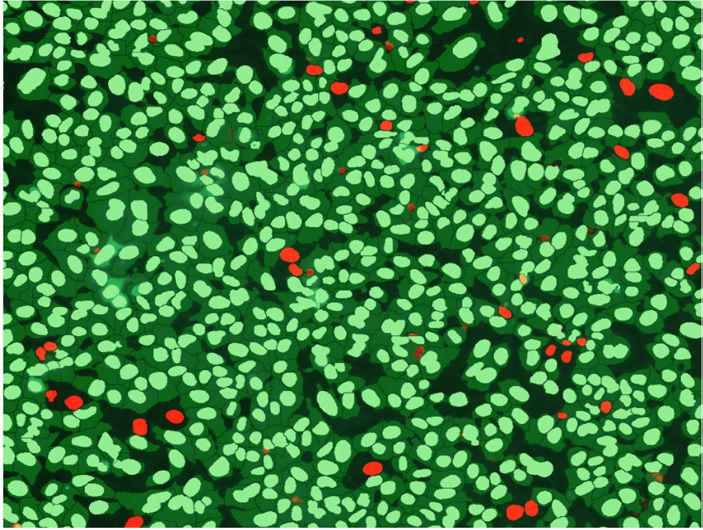
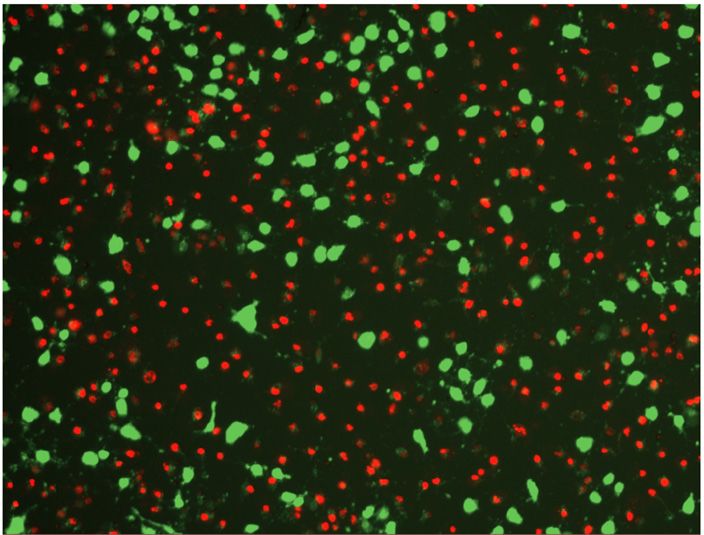
(6 µM final concentration). The cells were Figure 1. Representative images of negative control cells and cells treated with 0.1 µM of
staurosporine. Left: 10x images of Hoechst nuclei stained (blue), Calcein AM-stained (green) and
incubated at 37°C, 5% CO2 for an additional EthD-III-stained (red) HeLa cells. Right: Analysis masks show nuclei of live cells in green and nuclei of
15 minutes. Immediately after the final dead cells in red.
incubation, the plates were imaged on the
ImageXpress Pico system using a 10X Plan
Fluor objective and the FITC, Texas Red,
and DAPI channels for imaging Calcein AM,
EthD-III, and Hoechst dyes, respectively.
At this magnification, one field-of-view can
capture up to 4000–4500 cells in a single
image, yielding statistically relevant results.
Percent live or dead cells
Image analysis using Cell
Scoring module
Images were analyzed using the
Cell Scoring analysis module in
CellReporterXpress software. The module
identifies and differentiates live or dead
cells. The Hoechst staining was used
to identify total cells, and then cells
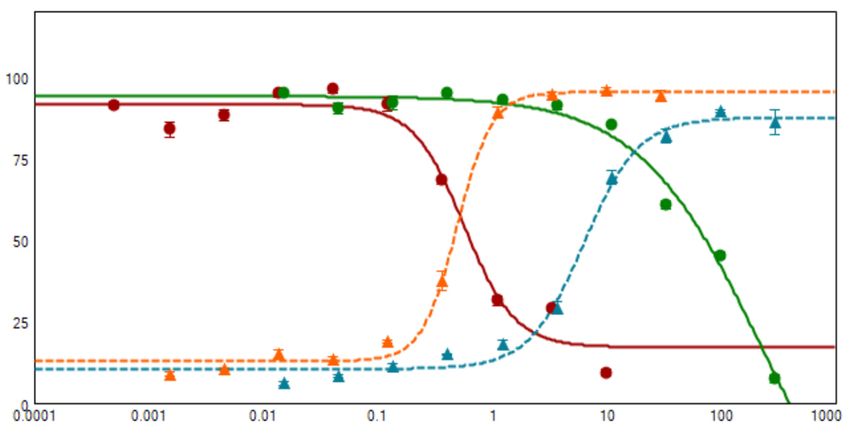
were scored positive or negative for the Concentration (µM)
specific stains, Calcein AM or EthD-III. • Staurosporine (% live cells) p Staurosporine (% dead cells)
Figure 1 shows images of positive and • Mitomycin C (% live dells) p Mitomycin C (% dead dells)
negative controls treated with and without
staurosporine and the associated analysis Figure 2. Concentration dependencies of the percentages of live and dead cells for HeLa cells
treated with different concentrations of staurosporine or mitomycin C. Averages and standard
masks indicating positive and negative deviations were derived from quadruplicates. The EC50 values produced by these curves are as
cells. Separate analyses were performed follows: 0.569 µM staurosporine and 223 µM mitomycin C for % live cells, and 0.492 µM staurosporine
to define the numbers and percentages and 6.305 µM mitomycin C for % dead cells.
of live (Calcein AM-positive) or dead
(EthD-III-positive cells) cells.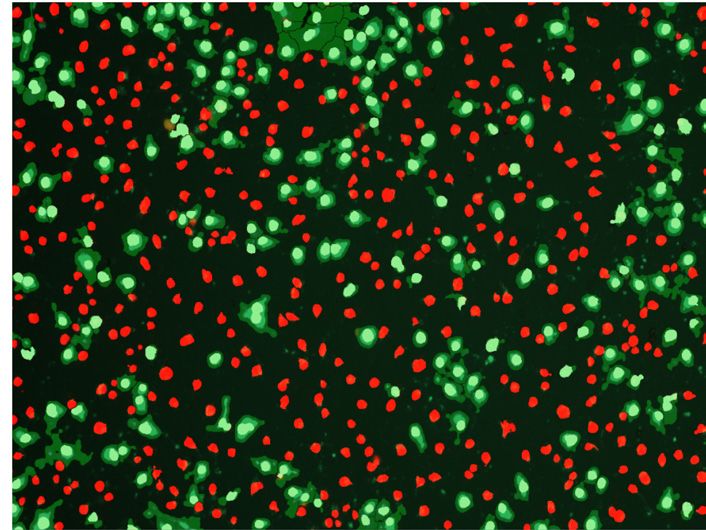
EC50 toxicity calculation from                 Conclusion
dose-response curves                           The EarlyTox Live/Dead Assay Kit, in
Live and dead cells were imaged, and           conjunction with the ImageXpress Pico
quantitative cell scoring analysis was         system and CellReporterXpress software,
performed based on cells staining              enabled an accurate measurement of live
positive for either Calcein AM (green          and dead cells with an easy and efficient
fluorescence) or EthD-III (red fluorescence)   workflow. The automated imaging and
(Figure 1). Treatments of HeLa cells           quantitative analysis allows for the testing
with staurosporine and mitomycin C             of cytotoxic compounds and is suited for
both showed concentration-dependent            assessment of cell viability for numerous
increases in percentage of dead cells          biological assays.
and decreases in percentage of live cells.
Dose response curves displayed in Figure
2 plot the percentage of live cells versus
compound concentration with EC50 values
of 0.569 µM for staurosporine and 223
µM for mitomycin C. The percentage of
dead cell curve produced EC50 values of
0.492 µM for staurosporine and 6.305 µM
for mitomycin C.
Contact Us
Phone: +1.800.635.5577
Web:      www.moleculardevices.com
Email:    info@moldev.com
Check our website for a current listing
of worldwide distributors.                                                                          The ImageXpress Pico system features optics by Leica Microsystems.

The trademarks used herein are the property of Molecular Devices, LLC or their respective owners.   ©2018 Molecular Devices, LLC
Specifications subject to change without notice. Patents: www.moleculardevices.com/productpatents   2/18 2164A
FOR RESEARCH USE ONLY. NOT FOR USE IN DIAGNOSTIC PROCEDURES.                                        Printed in USA
You can also read