Breathing Unequally: environmental justice and transport-related air pollution - Gordon Walker
←
→
Page content transcription
If your browser does not render page correctly, please read the page content below
Breathing Unequally:
environmental justice and
transport-related air pollution

Gordon Walker
Lancaster Environment Centre
Lancaster University

THE RIGHT TO EQUAL AIR QUALITY

THE RIGHT TO GOOD ENOUGH AIR
QUALITY

THE RIGHT TO PROTECTION FROM
POOR AIR QUALITY FOR THE MOST
VULNERABLE

THE RIGHT TO PARTICIPATION IN AQM
STANDARD SETTING AND DECISION
MAKING

THE RIGHT TO NOT BE EXPOSED TO
MORE POOR AIR QUALITY THAN YOU
ARE RESPONSIBLE FOR
Environmental justice and air
quality: politics and research
Justice and evidence in claim
making
Social distribution of poor air quality
5 ‘BUTS’
Conclusions (and the Queen)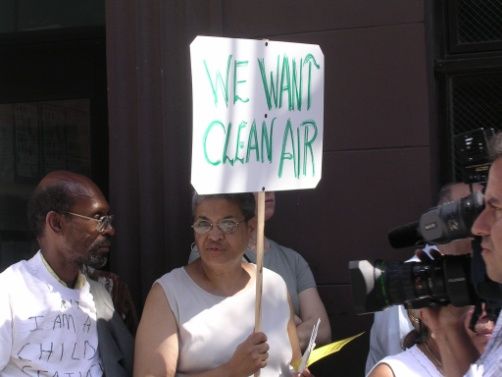
Air quality key focus of EJ
political campaigning in the US
e.g. against
new industrial facilities
existing industrial plants and
incinerators
major transport routes
transport depots
Focused on health risks
(asthma especially) and who is
suffering from these; in racial
terms in particular
Substantial research and
scholarship
“Environmental justice is
the idea that everyone has
the right to a decent
environment and a fair
share of the Earth’s
resources” (FoE Scotland)
Including focus on air
quality in relation to
deprivation and poverty;
Growing research base“This book is about the intertwining of environment and social difference. How for some people and some social groups the environment is an intrinsic part of living a ‘good life’ of prosperity, health and well being. While for others the environment is a source of threat and risk, and access to resources such as energy, water and green space is limited or curtailed. It is also about how some of us consume key environmental resources at the expense of others, often in distant places, and about how the power to effect change and influence environmental decision- making is unequally distributed. Most fundamentally it is about the way that people should be treated, the way the world should be”.
Claim making
Claim making
Claim making
multivalent,                              multiple
many viable                               forms of
justice claims                            inequality,
and                                       overlapping
resolutions                               patterns

                 ought - is distinction
Socio-spatial patterns of exposure
to poor air quality
Range of analyses undertaken in
the UK – national, regional and city
scales – for different pollutants (N02,
PM10, CO, Benzene for traffic)
Examining patterns in relation to
deprivation, poverty
Variety of outcomes –
methodological and scale
dependenciesAir quality Population
data census
data
Where AQ
Where
is good
people live of
and bad
different
Geographical classes,
Information System ethnicities etc
Socio-spatial
Who lives with
distribution good and bad air
of AQ quality34
Mean annual NO2 (ug/m 3) 32
30
28
26
24
22
5 10 15 20 25 30 35 40
Per cent households in poverty (Breadline Britain Index)
Annual mean NO2 concentration against deprivation for
British wards in 1999. Source: Mitchell and Dorling 200345
Mean ward mean NO2 concentration 40
35
30
25
(ug/m3)
20
15
10
5
0
1 2 3 4 5 6 7 8 9 10
Deprivation decile
Distribution of Nitrogen dioxide by Deprivation in
England, 2001. Source Walker et al 2003.45
Mean ward mean NO2 concentration
40
35
30
(ug/m 3)
25
20
15
10
5
0
1 2 3 4 5 6 7 8 9 10
Deprivation decile
Figure 5.3: Distribution of Nitrogen dioxide in Wales by
Deprivation, 2001 (Source: Walker et al 2003)Air quality – annual mean values for NO2 and
PM10:
SCOTLAND:
Fairburn et al 2008
30
annual mean value ug/m3
25
20
15
10
5
0
1 2 3 4 5 6 7 8 9 10
Deprivation Decile
Nitrogen dioxide PM10 An unevenness and an inequality in
the social distribution of poor air
quality
an injustice?
THE RIGHT TO EQUAL AIR QUALITY
Justice as equality in the distribution of
air quality‘BUT’ NO 1
Does the variation in air quality
matter?
THE RIGHT TO GOOD ENOUGH AIR
QUALITY
Justice as minimum standards for all in
the distribution of air quality45
Mean ward mean NO2 concentration
40
35
30
(ug/m 3)
25
20
15
10
5
0
1 2 3 4 5 6 7 8 9 10
Deprivation decile
Figure 5.3: Distribution of Nitrogen dioxide in Wales by
Deprivation, 2001 (Source: Walker et al 2003)45
Mean ward mean NO2 concentration 40
35
30
25
(ug/m3)
20
15
10
5
0
1 2 3 4 5 6 7 8 9 10
Deprivation decile
Distribution of Nitrogen dioxide by Deprivation in
England, 2001. Source Walker et al 2003.900
Thousands of people
800
Population (thousands) in NO2
exceedence ward 700
600
500
400
300
200
100
0
1 2 3 4 5 6 7 8 9 10
Deprivation Decile
Distribution of ward mean NO2 exceedences for England
(2001). Source: Walker et al 2003‘BUT’ No 2
Are all bodies equal?
variation in sensitivity to exposure
age, pre-existing health conditions
accumulative and synergistic effects
‘double/triple jeopardy’ for vulnerable
populations; poor socio-economic
conditions interact with both poor
health and a poor living environment
THE RIGHT TO PROTECTION FROM POOR
AIR QUALITY FOR THE MOST VULNERABLE
Justice as care and protection of the most
vulnerable“whilst the triple jeopardy of deprivation, increased potential for exposures to environmental pollution and impaired health certainly exists …the additive effects of deprivation and environment on general health status are usually not strong, and not always negative” (Briggs et al 2008: 15)
‘BUT’ No 3
Are air quality standards a good
enough metric of significance?
sub-threshold effects
‘average white male’
peaks and variation not picked up by
monitoring networks
accumulative and synergistic effects
THE RIGHT TO PARTICIPATION IN AQM
STANDARD SETTING AND DECISION MAKING
Justice as access to information, to decision
making processes, to research processes‘BUT’ No. 4
Does it matter who is responsible
for creating the air pollution?
Are the polluters suffering the
consequences of their own actions
Or those most exposed or vulnerable
suffering from a problem caused by
others?
THE RIGHT TO NOT BE EXPOSED TO MORE
POOR AIR QUALITY THAN YOU ARE
RESPONSIBLE FOR
Justice as ‘desert’ or proportionality38
36
Annual mean NO2 (ug/m 3)
34
32
30
28
26
24
22
0 10 20 30 40 50 60 70
Per cent households with no car
Annual mean NO2 concentration against car ownership
amongst potential drivers for British wards in 1999. Source:
Mitchell and Dorling 2003Conclusion
Value of distinguishing between
inequality and injustice
(in)Justice in air quality emerges as
involved, multifaceted potentially
accumulative
The evidence – justice interrelation,
in claim-making needs to be
constantly at work“We cant afford to cut pollution –
Spelman “ (Guardian 28/2/11)
Air pollution costs UK £10b/yr, 925,000
people exposed over NO2 limit
London has constant breaches of NO2
and PM10 standards; linked to 1in 5 of
all deaths
Argued by government that too costly
to achieve standards even by 2015
There is a ‘Kensington’ effect; but does
the interrelation of exposure,
vulnerability, responsibility and mobility
also make this a matter of injustice??“We are most concerned with the most deprived wards, as residents here are much more constrained (economically), in their choice of residential location, and hence unlike their more affluent counterparts, are not able to flee the poor air quality, or trade it off against other benefits of that location. By way of illustration, consider the Queen. Whilst at Buckingham Palace, she is resident in the ward with the third worst air quality in England (excluding unpopulated City of London wards). However, she trades off this cost against the benefits of living at the palace, and is also economically able to relocate to areas with much better air quality (which she does do for some of the year - e.g. to Balmoral in the Scottish highlands)” (ibid: 104) THE RIGHT TO REGULARLY ESCAPE POOR AIR QUALITY BY MOVING OUT TO ONE’S COUNTRY ESTATES
You can also read