Community Assessment 2021 - Clackamas County Children's ...
←
→
Page content transcription
If your browser does not render page correctly, please read the page content below
Community Assessment 2021
Community Assessment Update

• This is year 4 of a 5 year community assessment cycle.
• This year consists of a smaller update to the data that
  helps determine the direction of our programs that
  support the community.
Performance Standard
• 1302.11 Determining community strengths, needs and
  resources.
 • (2) A program must annually review and update the community
   assessment to reflect any significant changes including increased
   availability of publicly-funded pre-kindergarten (including an
   assessment of how the pre-kindergarten available in the
   community meets the needs of the parents and children served by
   the program, and whether it’s offered for a full school day), rates
   of family and child homelessness, and significant shifts in
   community demographics and resources.
Availability of Publicly-Funded
Preschool
•Significant shifts due to Student Success Act
 • CCCC reduced Head Start by 47
 • CCCC increased Duration by 100
 • CCCC increased Early Head Start by 64
 • Preschool Promise increased preschool slots by 161
   throughout the county

 • Across Clackamas County, programs have seen a decrease
   in enrollment. The number of slots haven’t changed –
   demand has changed due to the pandemic.
CCCC Head Start Waitlist
Center Name   Feb 2017-18   Feb 2018-19   Feb 2019-20
Barlow        5             7             3
CCC           13            15            3
Estacada      4             4             5
Gladstone     24            8             2
Marylhurst    3             0             1
Mulino        7             3             0
Oak Grove     4             2             0
OCVM          21            11            3
River Road    21            17            12
Sandy Ridge   5             8             6
Wichita       49            41            20
King          0             0             1
Molalla       0             0             6
Total         156           116           62
CCCC Early Head Start Waitlist
Center Name      Feb 2017-18   Feb 2018-19   Feb 2019-20
CCC EHS          10            17            18
Wichita EHS      28            12            14
HB East County   6             5             2
HB Mid County    7             6             2
HB N County Bi   22            18            6
HB N County Sp   2             1             3
HB S County Bi   5             2             3
HB S County Sp   4             3             2
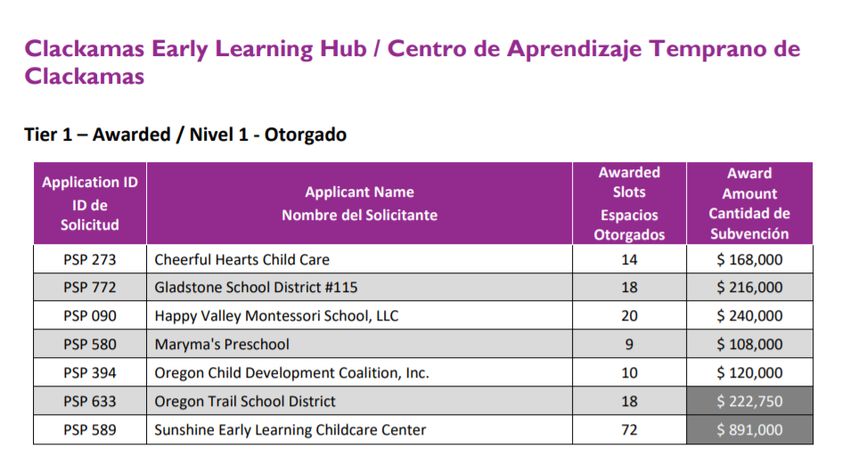
Preschool Promise Awards from
SSA (161 total)
• This information is unchanged from last program year.
Other Publicly-Funded
Preschools
Program            Location               # of Slots            Funding

OCDC Migrant       Clackamas County       94                    Region 12
Seasonal
OCDC – EHS         Clackamas County       32                    Region 12

OCDC – Preschool   Clackamas County       10                    State
Promise
Head Start to      Mt. Scott Elementary   96                    State OPK
Success (CESD)
Head Start to      Ackerman Center        72                    State OPK
Success (CESD)     Preschool
Head Start to      Sandy Grade            54 (18 full day and 36 State OPK
Success (CESD)     Preschool              part day)
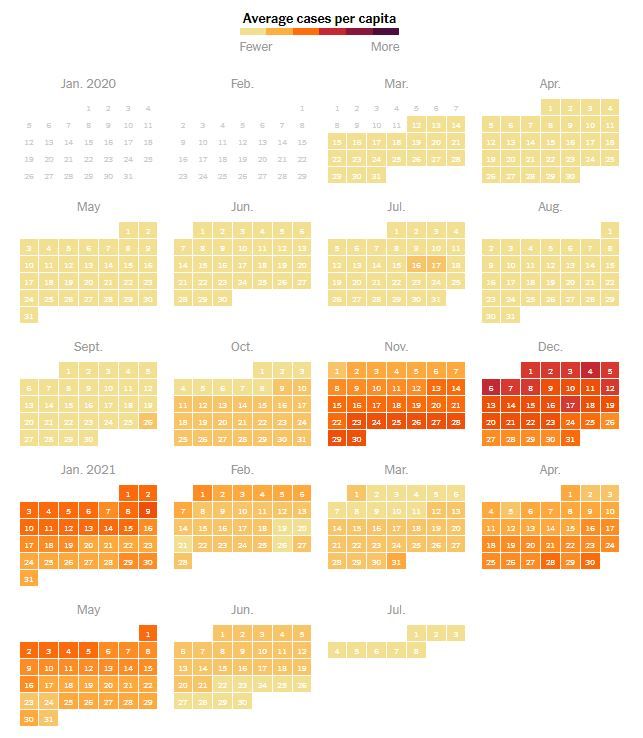
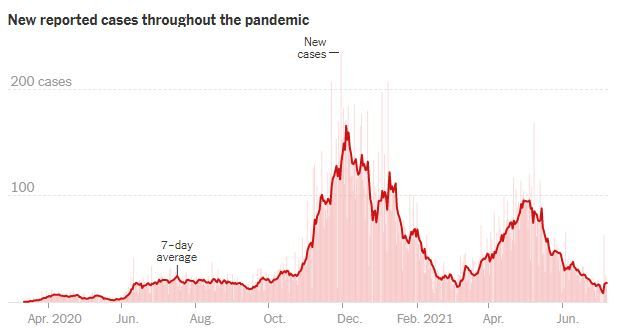
COVID in Clackamas County
• In Clackamas County, over 19,000 cases of COVID-19 were
  reported.
• Approximately 1 in 22 county residents have reported
  having COVID-19.
• Clackamas County remains at high risk for unvaccinated
  residents.

• Source: NY Times COVID Tracker
COVID in Clackamas County
Source: NY Times COVID Tracker
Rates of Homelessness
• https://www.clackamas.us/homelessness/homelesscount.
  html
• Clackamas County typically updates its rates of
  homelessness data every two years. This update was
  scheduled to be available by now, but that has not
  occurred.
• The most recent data is from the 2019 Point in Time count
  done by Clackamas County.
• From that data, we learned the following about our
  community:
Rates of Homelessness
• The number of people counted who experience
  homelessness in Clackamas County in 2019 was 1,166, a
  9% increase from 2017.
• There was a significant decrease in the number of
  unsheltered people counted, likely because Clackamas
  County operated more warming shelters during the winter
  of 2018-19. The count of unsheltered people includes
  anyone who doesn’t have permanent, stable housing.

• Source: Clackamas County Point in Time Count
Rates of Homelessness
• People of color are disproportionately experiencing
  homelessness in our county.
• Unaffordable rent, unemployment, eviction, interpersonal
  conflict and mental or emotional health issues were the
  most common problems faced by those who reported
  what caused them to leave their last living arrangement.
• The majority of those surveyed have been Clackamas
  County residents for two or more years, and primarily live
  in Oregon City, Clackamas, Molalla, Milwaukie, Sandy,
  Estacada or Canby.
• Source: Clackamas County Point in Time Count
Rates of Homelessness
• It’s unclear how the pandemic impacted rates of
  homelessness.
• One important piece of information is that the state placed
  a moratorium on evictions for nonpayment and evictions
  without cause. This moratorium likely prevented many
  individuals and families from entering homelessness.
• This moratorium ended July 1, 2021. A limited extension
  was created, but does not protect all renters.
CCCC Rates of Enrolled
   Homeless Families
                 2020-21 HS 2020-21 EHS   2019-20 HS   2019-20 EHS   2018-19 HS   2018-19 EHS
# of families
experiencing
                    173         77           335           59           375           78
homelessnes
      s
# of children
experiencing
homelessnes         207         91           288           21           404           81
      s

 # of families
  who found
   housing          18           8           25            12           35            7
  during the
program year
Significant Shifts: Demographics and Resources • Source: www.blueprintclackamas.com • Housing rates continue to rise – average cost of a home in Clackamas County increased 15% in the last year. • Continued increase to minimum wage • Communities with the highest needs: Milwaukie, Gladstone, Mulino and Molalla • Families living in poverty greater in minority populations • Approximately 10% of children under six years old are living at or below poverty.
Poverty Rates
• 9.3% of children under six years old are living at or below
• Minority families are living in poverty at a much greater
  rate than the average:

 • Hispanic/Latino – 16.5%
 • Black/African American – 16.4%
 • Other Race/Ethnicity – 14.4%
 • Asian – 11%
 • White/non-Hispanic – 7.9%

 • Source: Blueprint for a Healthy Clackamas County
Food Insecurity
• Food insecurity – when someone is unable to acquire
  enough food to meet their needs, or is uncertain of where
  their next meal might come from.
• Local statistics on food insecurity have been incredibly
  difficult to locate. However, we know the pandemic has
  had an impact on families we serve anecdotally from
  direct-service staff.
Food Insecurity
• In Clackamas County, all school districts offered all
  students free school lunches during the 20-21 school year.
  Several districts are extending this offer throughout the
  21-22 school year as well (Molalla River, Estacada

• Nationally, the data supports the local experience:
Food Insecurity
Pre-pandemic:
• 10.5% of US households experienced food insecurity
  (Source: USDA) – approximately 35 million people.
• Households with children were even more likely to
  experience food insecurity – 13.6% according to the USDA.
• For about 1/3 of those families, access to food was so
  limited that their eating patterns were disrupted and food
  intake was reduced.
Food Insecurity
Mid-pandemic:
• According to researchers at Northwestern University, food
  insecurity more than doubled as a result of the economic
  crisis brought on by the COVID outbreak – 23% of
  households experiencing food insecurity.
• Households with children were impacted more severely –
  nearly tripling to 29.5% of households with children who
  experience food insecurity.
Food Insecurity

• Black and Hispanic Americans are particularly
  disproportionately affected.
• According to the USDA, 19.1% of Black households and
  15.6% of Hispanic households experienced food
  insecurity.
• White households experienced food security at a rate of
  7.9%, below the national average.
Unemployment in
Clackamas County
• Over a four year period from January 2016 to January
  2020, the unemployment rate in Clackamas County
  typically hovered in the 3-4% range.
• Between February 2020 and April 2021, that average
  doubled to 7.3% during that span.
• This included three months (April, May and June 2020)
  where the unemployment rate was over 10% in the
  county.
• April 2020 was the highest single month at 12.2%.

• Source: US Bureau of Labor Statistics
Summary
• CCCC continues to support communities who
  demonstrate the greatest needs in the county.
• Unemployment rates have risen, making safe and reliable
  child care even more crucial to families.
• Food insecurity has increased greatly – CCCC’s Nutrition
  services will continue to be a crucial support for the
  families we serve.
You can also read