Q4 and Full-Year 2020 Earnings Presentation - February 25, 2021 - Stantec
←
→
Page content transcription
If your browser does not render page correctly, please read the page content below

Q4 and Full-Year 2020
Earnings Presentation
February 25, 2021
Cautionary Statement

          This presentation contains non-IFRS
          measures and forward-looking statements,
          including a discussion of our business
          targets, expectations, and outlook.
          We caution readers not to place undue
          reliance on our forward-looking statements
          since a number of factors could cause actual
Q4 2020

          future results to differ materially from the
          targets and expectations expressed.
          For a discussion of risk factors and non-IFRS
          measures, see our 2020 Annual Report
          available on SEDAR, EDGAR, and
          stantec.com.

 2
Agenda
          Gord Johnston
          Opening Remarks
          Strategic Progress
          Business Performance

          Theresa Jang
Q4 2020

          Q4 and Full-Year 2020 Financial Performance
          2021 Targets

          Gord Johnston
          Concluding Remarks

 3
 3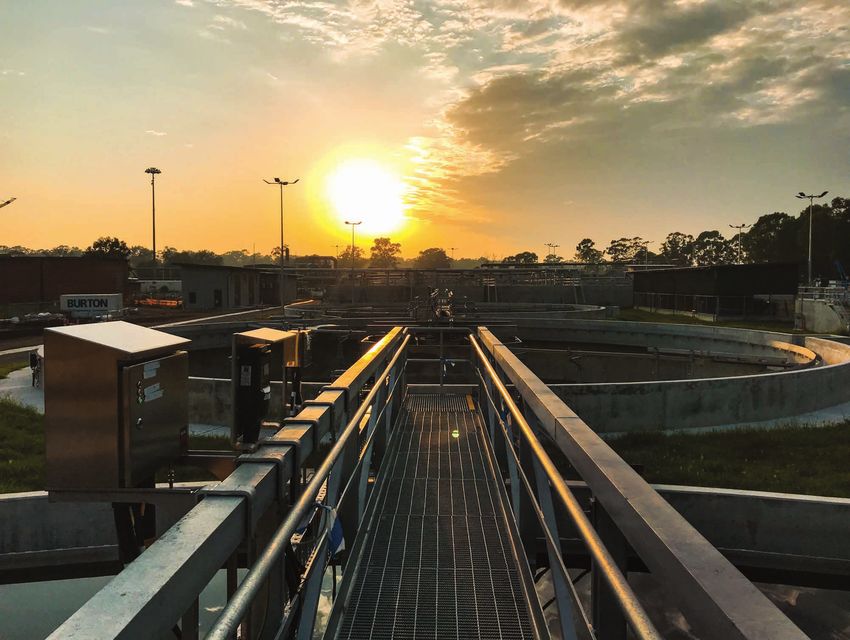
Executing our strategy

                                   Adjusted EBITDA              Record Adjusted
                                   Margin                       Diluted EPS                 Backlog

                                   15.7%                        $2.22                       $4.4B
Q4 2020

                                   Adjusted EBITDA margin       2020 Adjusted diluted EPS   Backlog grew organically
                                   increased by 0.2% to 15.7%   increased 9.9%.             by 3.1% year over year.
                                   from 15.5% in 2019.                                      (11 months of work.)

 4
Executing our strategy

                                   Real Estate
                                   Optimization

                                   30%
Q4 2020

                                   2023 Real Estate Strategy
                                   targets 30% reduction in
                                   existing real estate footprint

 5
We are a proven sustainability leader

                            Net Zero                                                    #5                                                           #1
                            Carbon neutral                                              Ranked fifth                                                 Ranked most
LEADERS IN SUSTAINABILITY

                            for 2022, then                                              most sustainable                                             sustainable
                            net zero for 2030                                           corporation                                                  corporation
                                                                                        in the world                                                 in North America

                            Our Operational Pledge                                      2021 Corporate Knights Global 100

                            CDP (1)                                                 ISS ESG (2)                                                   Sustainalytics (3)
                            Score                                                   Quality Score                                                 ESG Risk Rating

                              2020        2019        2018                                  E             S            G

                               A-          A-           A-                                  1             1             1                                            Low

                                      Notes: (1) CDP Website - October 14, 2020   (2)   ISS Sustainability Suite - February 5, 2021   (3) Sustainalytics   website - January 7, 2021
      6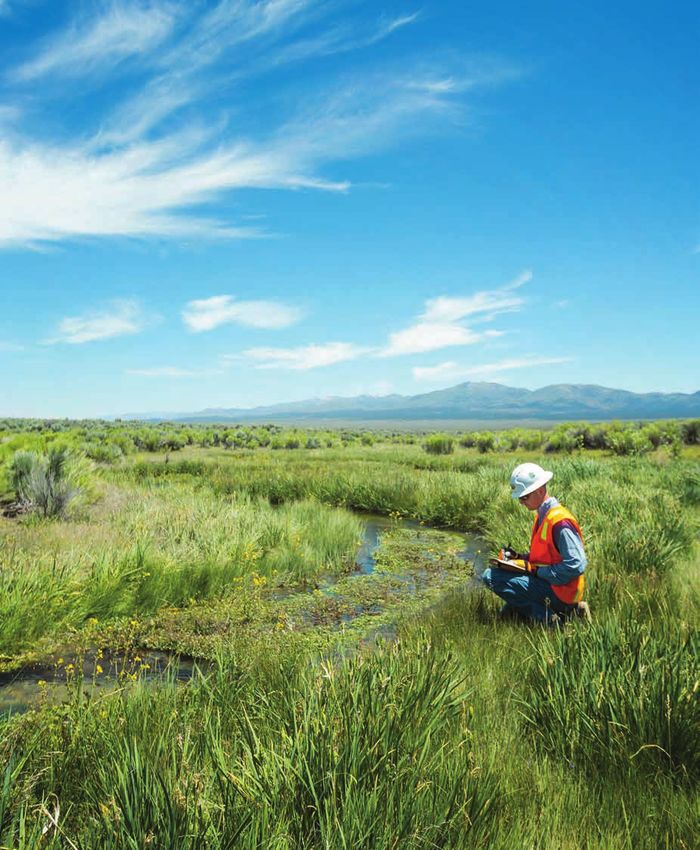
Q4 2020

          Business Performance

 7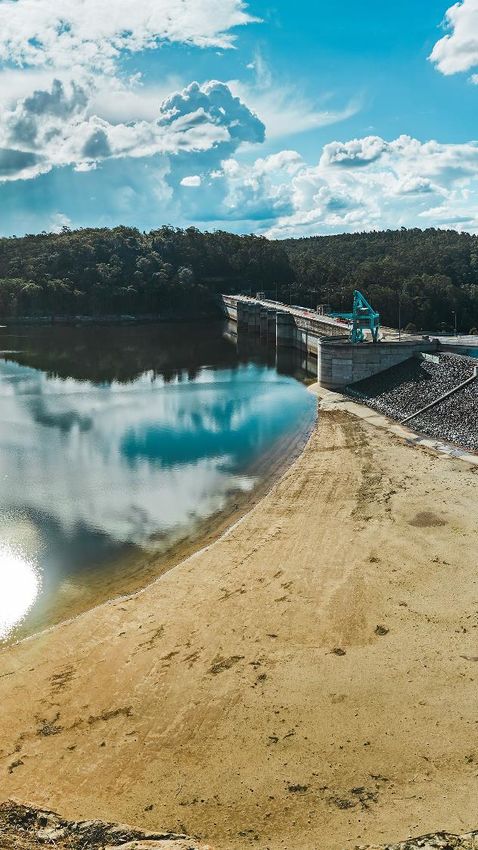
United States
Backlog
$2.5
Billion
Q4 2020
Gross Revenue Net Revenue
Q4 Project Wins
• Pure Water San Diego
Phase 1 of the US$3 billion program to supply sustainable water to 1.4M people
• Design for 6 public schools
In Prince George’s County, Maryland
• 9 bridge and 2 roadway projects
Including three bridges on the Maple River, North Dakota
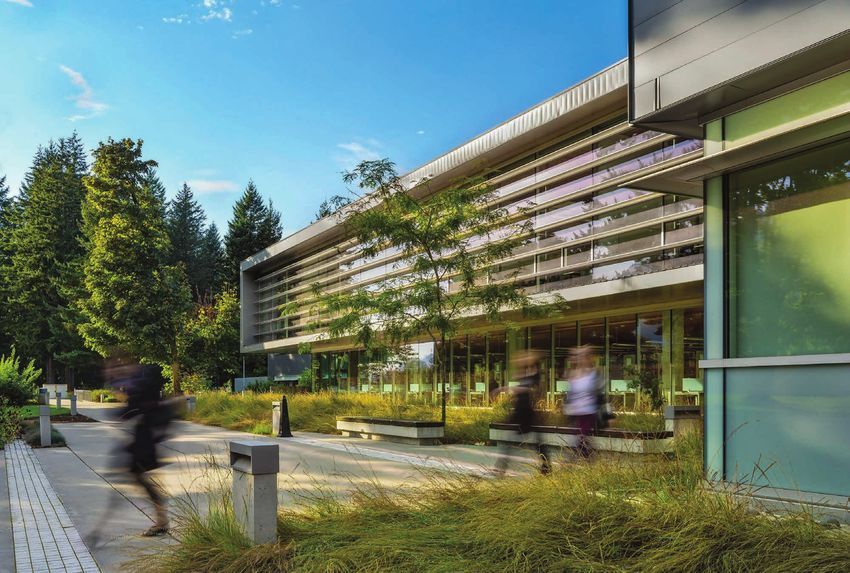
Denver Water Administration Building
LEED Certified Platinum
8 Denver, Colorado, USA
Canada
                                                                                    Backlog

                                                                                   $1.1
                                                                                  Billion
Q4 2020

                                  Gross Revenue     Net Revenue

          Q4 Project Wins
          • 3 hospitals for ~ $53 million in net revenue
            Including St Paul’s Hospital in Vancouver, British Columbia

          • Geotechnical Surveillance – Energy & Resources
            For ~$33 million in net revenue

          • 360 Transit Alliance
            A joint venture overseeing an estimated $28.5 billion in capital investment in
            Toronto’s transit infrastructure
                                                                                              Brentwood Town Centre – Phase One
 9                                                                                            Burnaby, British Columbia, Canada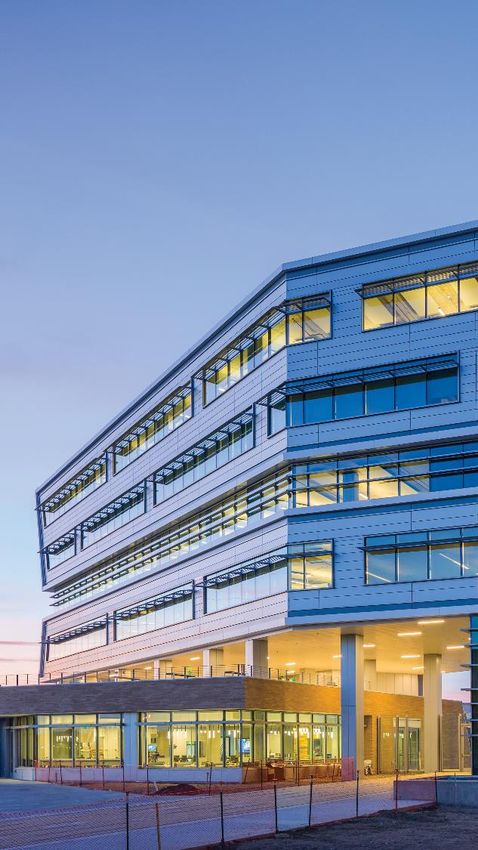
Global
                                                                               Backlog

                                                                              $0.8
                                                                              Billion
Q4 2020

                                 Gross Revenue    Net Revenue

          Q4 Project Wins
          • West Africa’s Regional Transport Governance Project
            The European Commission selected Stantec to support Ghana in enhancing the
            stability and security of the movement of goods and people across West Africa

          • SEQwater’s Somerset Dam
            Dam improvement project in Queensland, Australia.

          • Kiritimati Island Port – With support of European Union
            Preparation and conceptual design of multi-purpose port.
                                                                                            Warragamba Dam
10                                                                                          Warragamba, New South Wales, Australia
Q4 2020
Q4 and Full-Year 2020
Financial Performance
Theresa Jang - Executive Vice President and Chief Financial Officer
11Q4 2020 Results Adjusted EBITDA and margin
($ millions, %)
Q4 2020 Q4 2019 Change
% Year-
(In millions of Canadian dollars, except per share amounts and over-year
percentages) $ $ change
Net revenue 861.7 901.0 (4.4)
Gross margin 455.0 486.3 (6.4)
Administrative and marketing expenses 317.5 348.5 (8.9)
Q4 2020
EBITDA from continuing operations(1) 141.3 140.0 0.9
Adjusted Net Income and EPS
Net income from continuing operations 14.9 42.4 (64.9) ($ millions, $ per share)
Diluted earnings per share (EPS) from continuing
0.13 0.38 (65.8)
operations
Adjusted EBITDA from continuing operations(1) 138.5 142.8 (3.0)
Adjusted net income from continuing operations(1) 67.0 52.3 28.1
Adjusted diluted EPS from continuing operations(1) 0.60 0.47 27.7
EBITDA, adjusted EBTIDA, adjusted net income, and adjusted diluted EPS are non-IFRS measures discussed in the
(1)
Definitions section of Stantec's 2020 Annual Report.
12Adjusted EBITDA and Adjusted Net Income
2020 Results
margin and margin
($ millions, %) ($ millions, %)
2020 2019 Change
% Year-
(In millions of Canadian dollars, except per share amounts and over-year
percentages) $ $ change
Net revenue 3,684.5 3,711.3 (0.7)
2019 2020 2019 2020
Gross margin 1,930.5 2,008.4 (3.9)
Administrative and marketing expenses 1,352.9 1,433.6 (5.6)
Q4 2020
EBITDA from continuing operations(1) 573.3 576.0 (0.5) Adjusted Diluted EPS Adjusted ROIC
($/share) (%)
Net income from continuing operations 159.1 194.4 (18.2)
Diluted earnings per share (EPS) from continuing
1.42 1.74 (18.4)
operations
Adjusted EBITDA from continuing operations(1) 578.9 574.4 0.8
Adjusted net income from continuing operations(1) 248.9 225.0 10.6
Adjusted diluted EPS from continuing operations(1) 2.22 2.02 9.9
EBITDA, adjusted EBTIDA, adjusted net income, and adjusted diluted EPS are non-IFRS measures discussed in the
(1)
2019 2020 2019 2020
Definitions section of Stantec's 2020 Annual Report.
13Balance sheet strength
Net debt to adjusted EBITDA(1)
0.7x at Dec 31, 2020
Target range
1.0 - 2.0x
Q4 2020
Days sales outstanding (1)
75 days at Dec 31, 2020
Target
90 days
Net debt to adjusted EBTIDA and days sales outstanding are non-IFRS measures discussed in the
(1)
Definitions section of Stantec's 2020 Annual Report. Net debt to adjusted EBITDA is calculated using debt at
14
the end of the period divided by adjusted EBITDA for the trailing twelve months.Liquidity and capital allocation Quarterly and TTM Free cash flow(1)
($ millions)
• $440 million Free cash flow
• $80 million in share repurchases
• $300 million bond offering closed on October 8, 2020
Q4 2020
Capital returned to shareholders
($ millions)
• $800 revolving credit facility largely undrawn
• 6.5% increase in annual dividend
(1) Free cash (out)flow is defined as operating cash flows less capital expenditures and net payment of lease obligations.
152021 Outlook
Real Estate Strategy expected to contribute ~$0.10 to 2021 EPS
2021 Targets - Updated Geography 2021 Regional Outlook
2020 Performance 15.7%
Adjusted EBITDA(1) 14.0% 15.0% 16.0% 17.0% • Muted organic growth absent
(% of net revenue)
US stimulus spending
6.8%
United States
Adjusted net income(1)
2021 OUTLOOK
5.0% 6.0% 7.0% 8.0%
(% of net revenue)
9.9%
• Low single-digit organic growth
Adjusted Return on • Muted economic growth
8.0% 9.0% 10.0% 11.0%
invested capital
0.7x Canada
Net debt to adjusted EBITDA 0.0 1.0 2.0 3.0
• Mid-single digit organic growth
• Strong water market
(1)
Adjusted EBITDA, adjusted net income, and ROIC are non-IFRS measures (discussed in the Definition
section of our 2020 Annual Report)
• Stimulus funds
Global
2021 Adjusted diluted EPS expected to grow, on a percentage basis, by low to mid-single digits.
2023 Real Estate Strategy, continued strong execution to more than offset ~$0.10/share from Q4 2020 non-recurring items.
16Q4 2020
Concluding Remarks
Gord Johnston – President and Chief Executive Officer
17Committed to our strategic targets for 2023
Net Adjusted Earnings
Revenue per Share
>10% >11%
CAGR CAGR
Q4 2020
Adjusted EBITDA Adjusted Return on
Margin Invested Capital
16-17% >10%
Of Net Revenue Maximizing long-term, sustainable value
through our value creators
1819
Q4 2020
Q&AYou can also read