Radio & Gamma-ray correlation of the blazar PKS 1424-418 during it's flaring state
←
→
Page content transcription
If your browser does not render page correctly, please read the page content below
Radio & Gamma-ray correlation of
the blazar PKS 1424-418 during
         it's flaring state

 44TH YOUNG EUROPEAN RADIO ASTRONOMY CONFERENCE
                   (YERAC 2014)

                        BY: PFESESANI VAN ZYL
  Dr Michael Gaylard (The late), Prof Sergio Colafrancesco & Dr Alet deWit

       HARTEBEESTHOEK RADIO ASTRONOMY OBSERVATORY
                        (HARTRAO)
Outline
Introduction to blazars
Why are we interested in blazars?
Introduction to my research topic
Observations & Data reduction
Results
Conclusion
Future work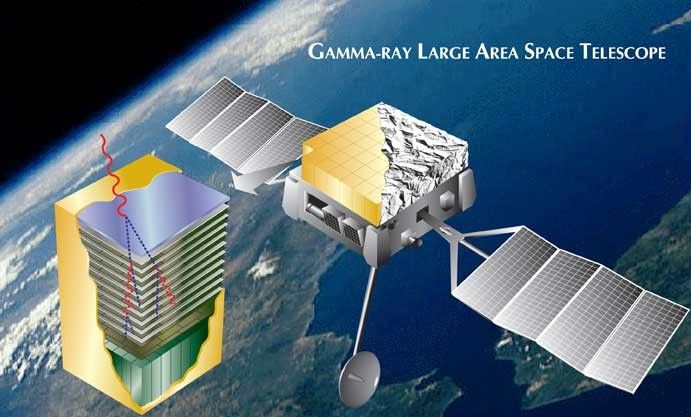
Introduction to blazars
BLAZARS AGN UNIFICATION SCHEME
Subclass of AGN sources
Harbor black hole (SMBH) at
core (M > 10^6 Msol)
More than 1000 times brighter
than MW, E > 10^40 erg s^-1
Fuel – accretion of ISM matter
SPECIAL CHARACTERISTICS
Show strong polarizations in both
the optical and radio λ's
Radiate their energy at all λ's
across the EM spectrum
Viewed when radio jet
Image credit: http://www.nasa.gov/centers/goddard/images/content/182566main2_1agn_LO.jpg
is along observers line of sight
Highly variable at all λ's, compact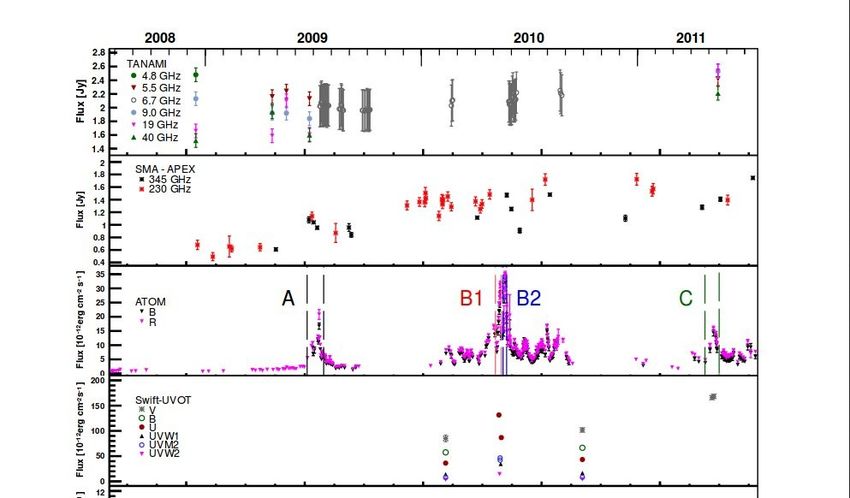
Introduction to blazars
SPECTRAL ENERGY DISTRIBUTION (SED) BLAZAR SED
SED characterised by 2 broad peaks
LBL – low energy peaking
blazars known as FSRQ sources
Emission spectra
HBL – High energy peaking
blazars known as BL Lac objects
Feature less spectrum
ENERGY EMISSION
Two main sources: Sync IC
Synchtrotron (Sync) emission
Peaking in (IR-Opt) LBL Image credit: Giommi P, Colafrancesco S, Cavazzuti E,
Perri M and Pittori C, 2006.
Peaking in (UV-X-rays) HBL
Inverse Compton (IC) emission
Peaking in Gamma-rays (GeV) LBL
Peaking in Gamma-rays (TeV) HBL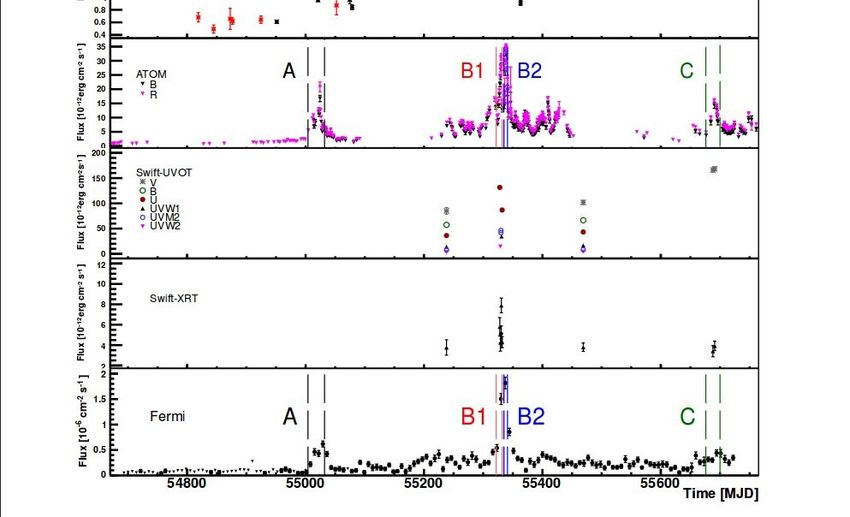
Introduction to blazars
Two main sources:
Synchtrotron (Sync) emission
(RADIO EMISSION)
e- spiralling around B-field
Inverse Compton (IC) emission
(GAMMA_RAY EMISSION)
Low energy photons boosted to
relativistic energies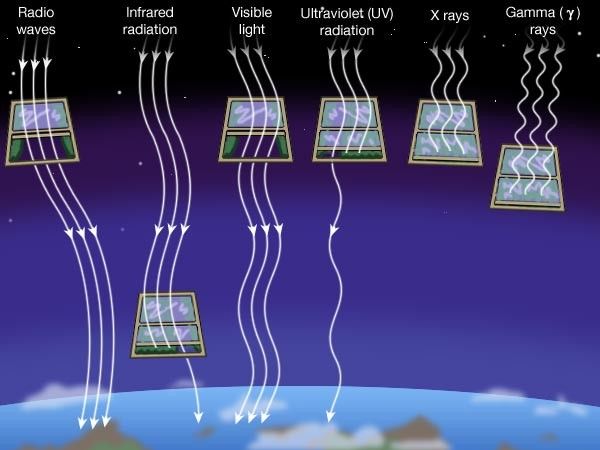
Introduction to blazars
Two main sources:
Synchtrotron (Sync) emission
(RADIO EMISSION)
e- spiralling around B-field
Not the only sources!
Hadronic models
Protons and e- main particles for Gamma-ray
generation
Bottcher et al. 2013
Inverse Compton (IC) emission
(GAMMA_RAY EMISSION)
Low energy photons boosted to
relativistic energies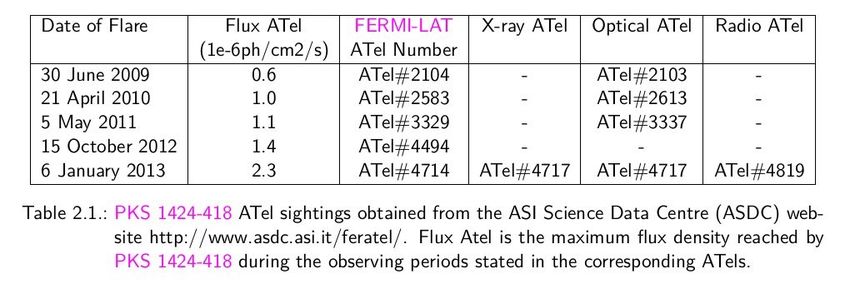
Why are we interested in blazars?
Blazars: the only sources that JET GEOMETRY OF QUASAR 3C345
allow us to study the emission
jets in detail
Jets: find both high & low energy
particles
Blazar variability:
helps constrain emission
regions (establish physical
Parameters e.g distance
core to jet base) and
Lets us study the behavior of
the region around the BH
Blazar multifrequency:
Still many things we do not yet
understand, e.g. Where the
VLBI flux density plots of 3C345.
HE gamma-ray particles originate Image credit: Kudryavtseva N A, Gabudza D C, Aller M F and Aller H D, 2011
from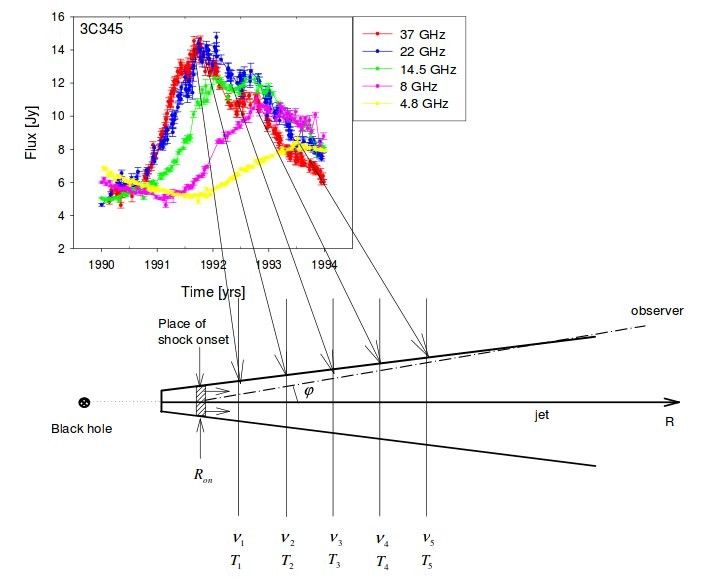
Introduction to research
AIM: RECENT VLBI IMAGE OF PKS 1424-418
Conduct a long-term (1 year)
multi-wavelength study on PKS 1424-418
during its flaring state (Oct '12 – Sep '13)
- Flat spectrum radio quasar (FSRQ)
- z = 1.522
- highly compact core on VLBI scales
- good positional stability – used as
ICRF calibration source
Interests:
Correlation between Radio & Gamma-rays
Time-lags
METHOD:
Conducted flux density observations of the Image credit: Mr Sayan Basu, HartRAO PHD student
source
Used the Discrete correlation function (DCF)
(Edelson & Krolik 1988) to estimate possible
correlations and time-lags between
Gamma-rays & radio waves, and also between the
radio waves themselves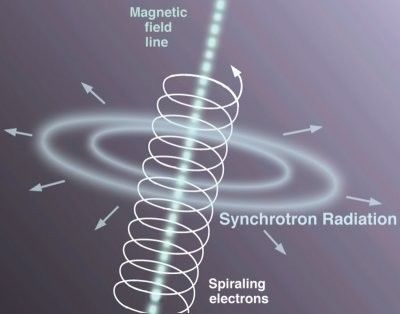
Observations & Data Reductions
Study based on Gamma-rays
and radio waves:
Gamma-rays:
Short wavelengths 10^-12 m
Do not penetrate atmosphere
Require space based telescopes
Radio waves:
Long wavelength (mm - m)
Penetrate Earth's atmosphere
Can observe from Earth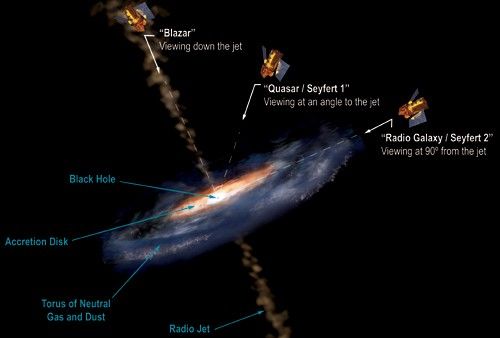
Observations & Data Reductions
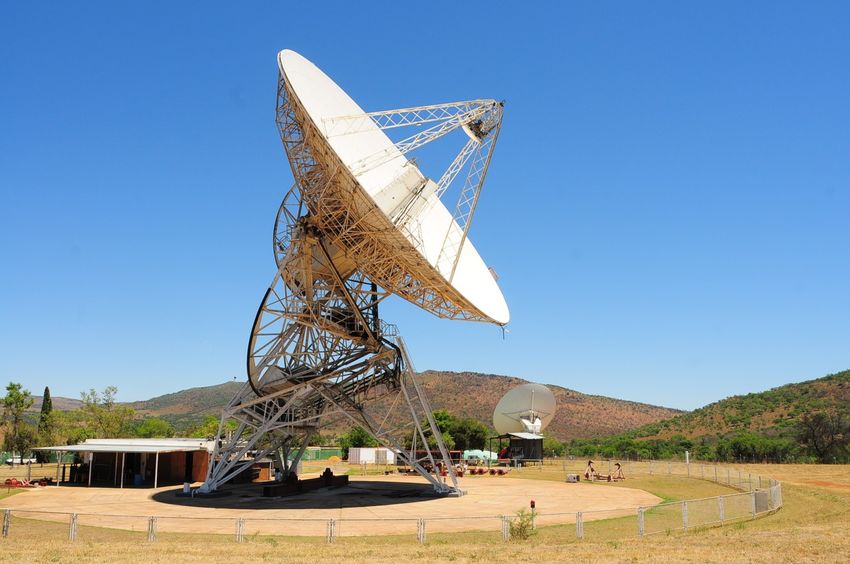
OBSERVATIONS: FERMI-LAT OBSERVATIONS: HartRAO 26m dish
On board the Fermi-GST
26m radio telescope at Hartebeesthoek
Observed Gamma-rays since June 2008
Freq: 2.3 GHz, 4.8 GHz,
8.4 GHz and 12.2 GHz
20 MeV < E < +300 GeV
On average 2 scans per day
Entire sky every 3 hrs in all sky mode
Used Drift-scan techniqueObservations & Data Reductions
DATA REDUCTIONS: HartRAO 26m DRIFT SCAN OF HYDRA A (3C218)
Ran quality checks on scans:
Outliers, RFI, baseline drifts
Data fitting: parabolic fits to top 20%
Source calibrated against a known
calibrator source Hydra A (3C218)
using equations from Ott et al. 1994
to estimate flux density of Hydra A
Made plots of the flux density of
PKS 1424-418 vs time to evaluate
the source behaviorResults: Flux density PKS 1424-418 FERMI GAMMA-RAY DATA MULTIWAVELENGTH FLUX DENSITY PLOTS Results of the gamma-ray observations conducted by Fermi-LAT as they appear On the Fermi website, Results of the multiwavelength observations. The top level is the Fermi-LAT data http://fermi.gsfc.nasa.gov/FTP/glast/data/lat/catalogs/asp/current and levels 2, 3, 4 & 5 are HartRAO data @ 12.2, 8.4, 4.8 & 2.3 GHz respectively. /lightcurves/PKS1424-41_86400.png
Results: Flux density
PKS 1424-418 FERMI GAMMA-RAY DATA                                             MULTIWAVELENGTH FLUX DENSITY PLOTS

                            Freq (GHz)                ~Min Flux (Jy) ~Max Flux (Jy)                              ~% Change
                                  12.2                         6.4                          9.5                          67.4
                                   8.4                         5.4                          8.0                          67.5
                                   4.8                         3.2                          6.3                          51.0
                                   2.3                         2.5                          4.8                          52.1

Results of the gamma-ray observations conducted by Fermi-LAT as they appear
On the Fermi website,                                                          Results of the multiwavelength observations. The top level is the Fermi-LAT data
http://fermi.gsfc.nasa.gov/FTP/glast/data/lat/catalogs/asp/current            and levels 2, 3, 4 & 5 are HartRAO data @ 12.2, 8.4, 4.8 & 2.3 GHz respectively.
/lightcurves/PKS1424-41_86400.png
Results: Flux density
Results: Flux density

    Intensity over long term trend - 26.1%
   Intensity over observing period – 60.9%
Other Results: Flux density
Image ref: Buson et al. 2014Other results: Astrogeo (VLBI) Source structure changing over long term on VLBI scales - Each peak accompanied by matter ejection (compact at lower Flux) - Need more data and imaging to follow trend - Images on astrogeo website http://astrogeo.org/cgi-bin/imdb_get_source.csh?source=J1427-4206
Results : Data correlation

- Gamma-ray/radio correlations have been found
      (Pushkarev et al. 2010, Fan et al. 2012,
      Kovalev et al. 2009, Richards et al. 2011)
- can't be confirmed – too little data
- most use
      - VLBI radio data, very little single dish
      - non-quasi simultaneous data
- Consensus - if high Gamma-ray, radio exists
- flares due to shock in jet model
(Sokolov & Marscher 2004) producing both +ve
and -ve lags
Results: Periodogram
Found flare period! PERIODOGRAM OF PKS 1424-418
86.2 days for the flares
Agrees with data
but cannot conclude on this
too few cycles,
need more data
Image credit: Mr Jabulani Maswanganye, HartRAO PHD studentConclusion
Both the Radio & Gamma-rays show some variability over the observing period.
Found Gamma-rays & Radio waves were correlated
− Gamma-rays leading Radio
Found Radio waves were correlated
− Most cases, higher frequencies were leading lower counterparts
Found 86.2 day period between Gamma-ray flares
All results show we need more data, and the importance of continuing with multi-
wavelength observations.Future work
- Continue single dish monitoring on source PKS 1424-418
- Perform (O-C) analysis on gamma-ray data to see if periodicity is real
- Include other southern hemisphere AGN flaring sources for Phd
- Include VLBI data observations and imaging for these sources with the TANAMI group
(Dr Roopesh Ojha – NASA JPL) to monitor stuctrural variability on milliarcsecond
scales
- Conduct spectral index studies on VLBI scalesThank you
You can also read