The usefulness of RGB products: the perspective of the Australian Bureau of Meteorology
←
→
Page content transcription
If your browser does not render page correctly, please read the page content below
" The usefulness of RGB products: the
       perspective of the Australian Bureau of
                   Meteorology "

        Presenter: Bodo Zeschke. Bureau of Meteorology
      Training Centre, Australian VLab Centre of Excellence
                        Point of Contact
  Should you use these resources please acknowledge the Australian Bureau of Meteorology
 Training Centre. In addition, you need to retain acknowledgement in the PowerPoint slides of
the Japan Meteorological Agency, the Australian Bureau of Meteorology and any other sources
                                         of information.
Contents of this session
1                                        2

The new capabilities of Himawari-8 / 9        True Colour RGB: Volcanic Ash

3                                        4

                                             Day Convection
                 Night Microphysics               RGB:
                   RGB: Fog/Low              Thunderstorms,
                       Cloud                 Tropical Storms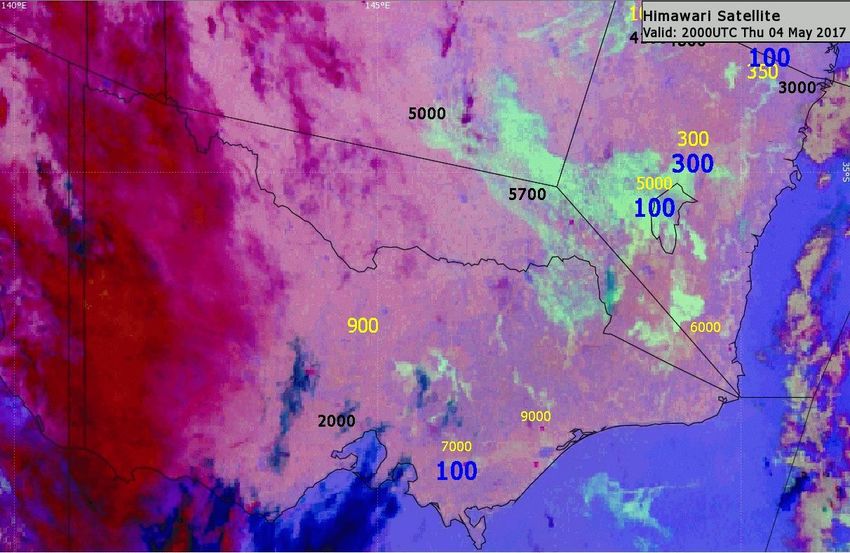
Himawari-8
  Changes from MTSAT-2 to
        Himawari-8
                                                                                             MTSAT-2

                                                              10 minute images in colour
                                                                                            Hourly / half
                                                                                           hourly images
                                                                                            in greyscale

satellite images courtesy Japan Meteorological Agency (JMA)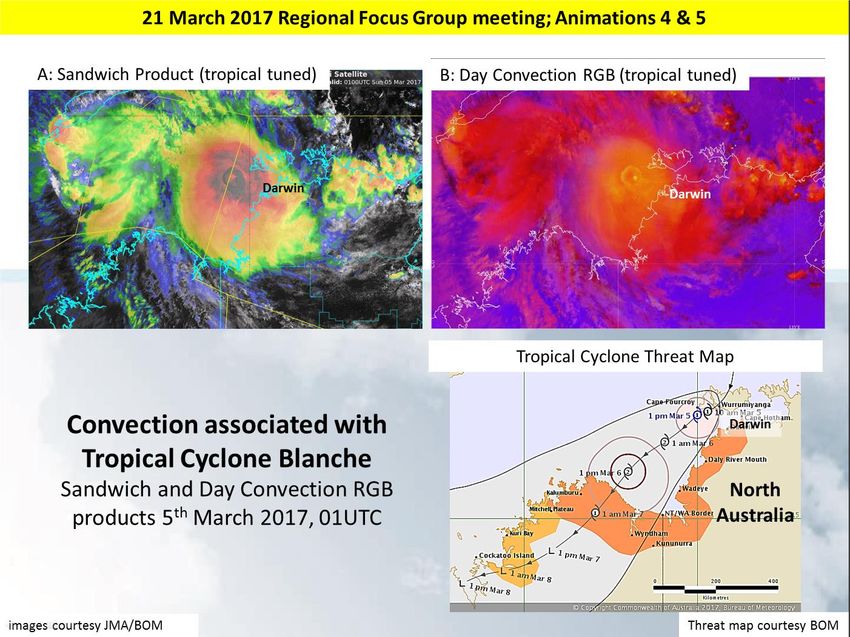
Question to 115 Australian Bureau of Meteorology
       staff*: Compare the usefulness of Himawari-8 data to
                  MTSAT-2 data when forecasting.

                                          4
                        20                                                                 More useful

                                                                                           Same

                                                                                           Not used MTSAT-2 data
                22                                                   69
                                                                                           Other comments

* Results to be published in the research paper "How Himawari-8 data has revolutionised the work of Bureau Forecasters", Zeschke et al. 2018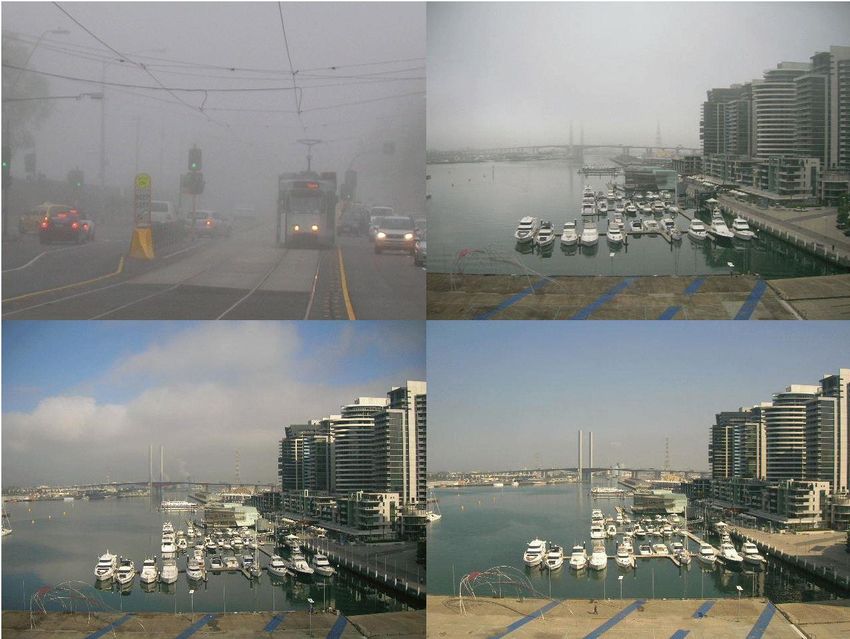
Forecaster use of Himawari-8 data

                              Day / night product transition

                                                                Adapting the EUMETSAT tuned products to
                                                               Himawari-8 data by regional forecasters and
Various speeds of animation      Multi-panel displays
                                                                          other operational staff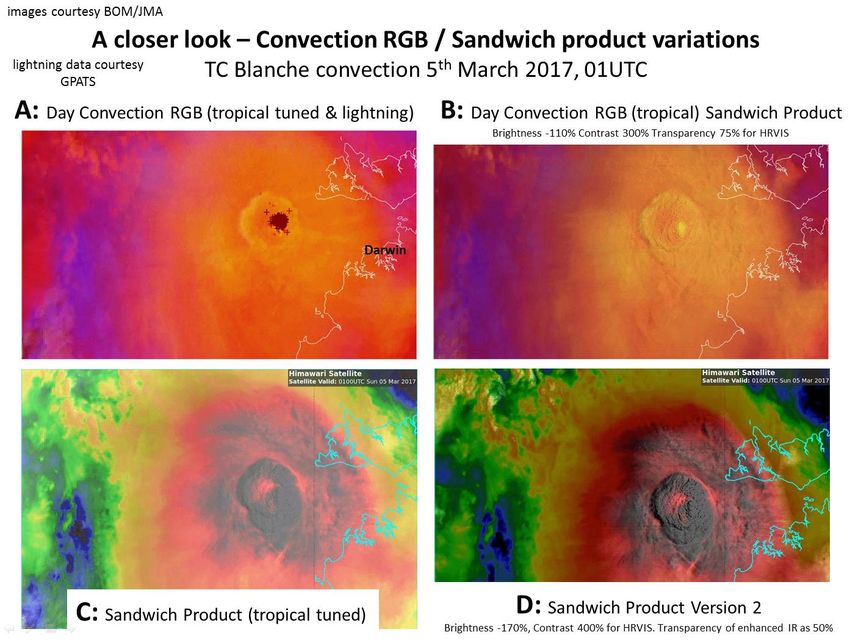
Adapting the EUMETSAT tuned products to Himawari-8 data by
       regional forecasters and other operational staff
 http://www.virtuallab.bom.gov.au/archive/regional-focus-group-recordings/

     There are a lot of resources pertaining to WMO RAV stakeholders
  development of Himawari-8 data and data products posted on this web
                                    page.

 This includes the recordings of over four years of monthly Australian VLab
            Centre of Excellence Regional Focus Group meetings.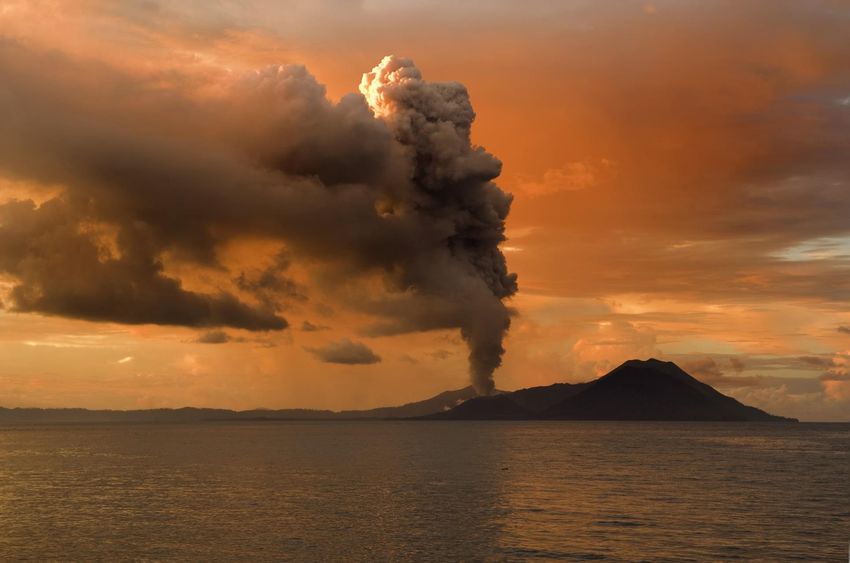
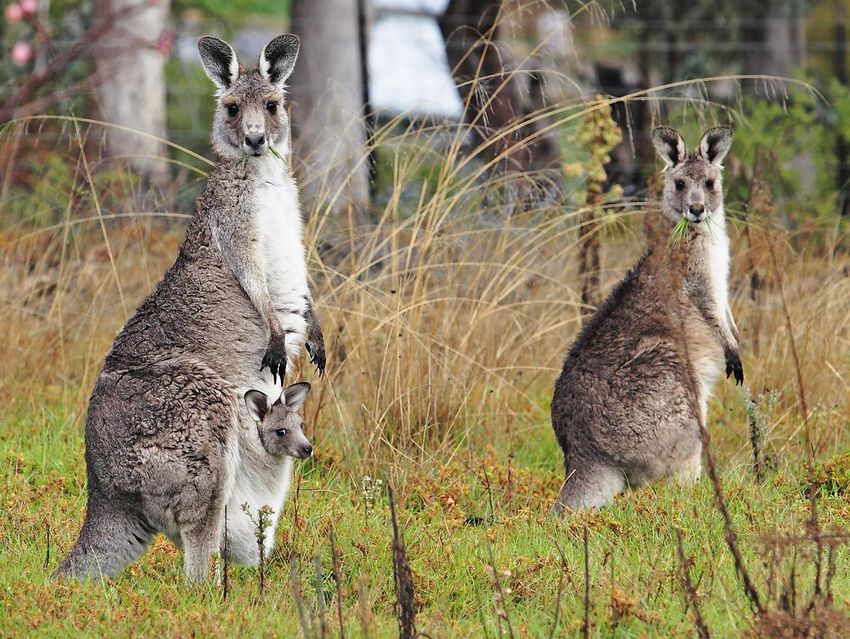
True Colour RGB: Detection and monitoring of volcanic ash
           Tavurvur eruption, Papua New Guinea, June 2009

                   image from Wikimedia Commons (author Taro Taylor)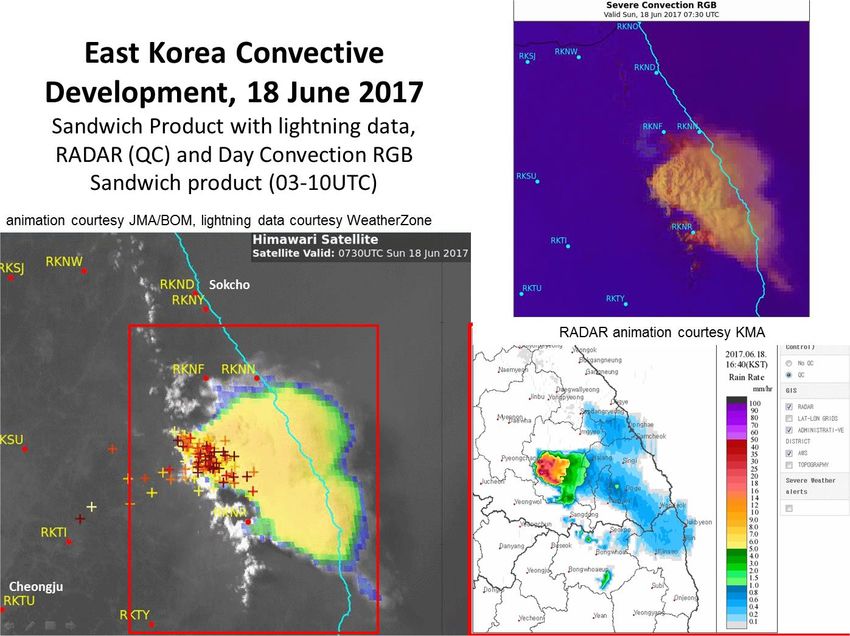
images courtesy JMA/BOM

               MTSAT-2 greyscale visible channel compared to
                       Himawari-8 True Colour RGB
                       Manam volcanic eruption of 31st July 2015 0135 to 0225UTC

  MTSAT-2
 hourly data
 (start of scan time
        given)

 Himawari-8
 True Colour
   RGB 10
 minute data
 (start of scan time
        given)

   10 minute Himawari-8 data permits the eruption to be captured in near real time
      The Himawari-8 product shows the brown volcanic ash and the white cloud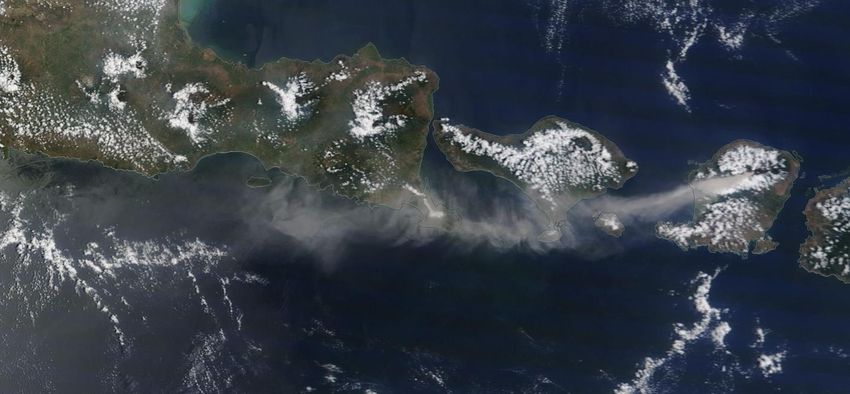
Some limitations in monitoring volcanic ash eruptions by
  images courtesy JMA/BOM
                          satellite             image courtesy NASA

  Himawari-8 Band 3                        Ash RGB product                MODIS True Colour

                                                                                                      AI

           Small plumes (Bagana, PNG 30 May 2016)                           Ash coated with ice (AI)
  Forwarded to Darwin VAAC by Luth Boroh                                  (Manam, PNG 24 October 2004)
                                                                              Photo courtesy of David Innes, Air Niugini

                                                 Terra MODIS image

              Thin ash                                        Ash below cloud – to FL330
(Rinjani eruption, 3 November 2015)                          (Manam eruption, 10 November 2004)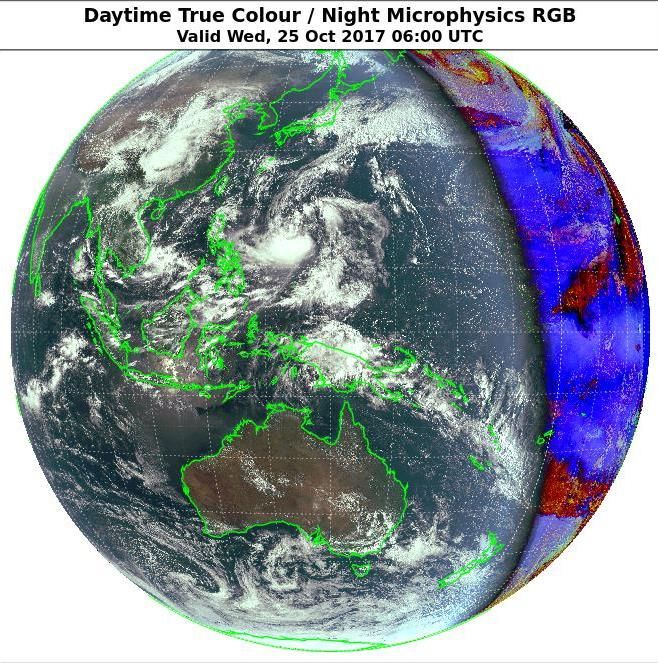
Rinjani eruption: MODIS image and pilot report
Note: the satellite monitors the plume in the near vertical whereas pilots observe the plume
 obliquely. Due to the longer path length of radiation passing obliquely through the plume,
  Pilots may see evidence of volcanic ash where this is not detectable in satellite imagery.

image courtesy NASA/EOSDIS/Lance Rapid Response

  TERRA MODIS imager 0310UTC, 4th November 2015.

                                                                Pilot photos from 03UTC,
                                                                   4th November 2015.
                                                                Forwarded to Darwin VAAC by Luth Boroh
Limitations of the True Colour RGB product
Cannot be
used at night
06UTC 25Oct 2017 12UTC 25Oct 2017
03UTC 25Oct 2017 09UTC 25Oct 2017
images courtesy JMAOne solution: using the infrared window
channel (Himawari-8 Band 13) at night
However, Band
13 generally
cannot reveal
low cloud /fog
06UTC 25Oct 2017 12UTC 25Oct 2017
03UTC 25Oct 2017 09UTC 25Oct 2017
images courtesy JMA/BOMA better solution: using the "cats eye" Night
Microphysics RGB product at night
06UTC 25Oct 2017 12UTC 25Oct 2017
03UTC 25Oct 2017 09UTC 25Oct 2017
fog /
low
cloud at
night
animation courtesy JMA/BOMimages courtesy B.Zeschke
Night Microphysics RGB product for fog/low cloud detection
(Melbourne fog clearing 20th April 2009)The Night Microphysics RGB product compared to the infrared product
images courtesy JMA/BOM (Southeastern Australia, 19UTC 27th January 2017)
Melbourne
Melbourne
Eureka Tower,
Melbourne
Night Microphysics RGB formula
Melbourne image courtesy B.Zeschkeimages courtesy JMA/BOM Night Microphysics RGB
The advantages of the Night showing station visibility in meters (yellow) and cloud base height in feet (blue / black)
Microphysics RGB product
Southeast Australia 20UTC 4th May 2017
Melbourne
short wave infrared (3.9micron) Infrared (10.4 micron)Question to 115 Australian Bureau of Meteorology
staff*: How useful have you found the new Himawari-8
data when briefing stakeholders (pilots etc.)?
15
Very useful 5
Useful
No satellite data used 37
Have not conducted
briefings 71
Other comments
* Results to be published in the research paper "How Himawari-8 data has revolutionised the work of Bureau Forecasters", Zeschke et al. 2018image courtesy B.Zeschke The "Hector" thunderstorm of northern Australia
Some satellite products for the monitoring of Convection:
      the BOM version of the "Sandwich Product"
 Upper layer: IR10.4 BT image

 Bottom layer (“background”):                               -20C                     Mid-latitude                       -70C
          HRV image

                                                            -20C                         Tropical                       -80C

 Blending options – applied to                              Upper layer opacity set somewhere between
       the upper layer                                                       40 to 75%
                                                               I have chosen 50% for the Sandwich
                                                                            Product,
      adapted from "Satellite Observations of Storm Tops (part 1)" Martin Setvak, Czech Hydrometeorological Institute
                http://www.eumetsat.int/website/home/Data/Training/TrainingLibrary/DAT_2042885.html
images courtesy JMA
Introducing the Day Convection RGB
Day Convection RGB Range Gamma
6.2 – 7.3 micron -35 to 5 1.0
3.9-10.4 micron -5 to 60 0.5
1.6-0.6 micron -75 to +20% 1.0
CHANNEL COMBINATION (mid-latitude
EUMETSAT recipe)
Himawari-8 channels Small ice
particles
High level cloud
at storm
Small ice particles
top may
indicate
Thin cirrus cloud severe
Large ice particles storms
Thin cirrus cloud
Small ice particles High level cloud
Large ice particlesSome satellite products for the monitoring of Convection:
The Day Convection RGB / Visible Sandwich Product"
Upper layer: Day Convection RGB image
Day Convection RGB Range Gamma
(Mid-latitude)
WV6.2 - WV7.3 BTD -35 to 5 1.0
IR3.9 - IR10.4 BTD -5 to 60 0.5
NIR1.6 - VIS0.6 REFL -75 to 25% 1.0
Day Convection RGB Range Gamma
Bottom layer (“background”): (Tropical)
HRV image WV6.2 - WV7.3 BTD -35 to 5 1.0
IR3.9 - IR10.4 BTD -5 to 75 0.33
NIR1.6 - VIS0.6 REFL -75 to 25% 1.0
Blending options – applied to Upper layer opacity set to 75% for the Day
the upper layer Convection RGB Sandwich Product
The contrast of the HRV layer has been
increased to 300 and the brightness reduced
to -110East Korea Convective
Development, 18 June 2017
Sandwich Product with lightning data,
RADAR (QC) and Day Convection RGB
Sandwich product (0730 UTC)
images courtesy JMA/BOM, lightning data courtesy WeatherZone
RADAR image courtesy KMAFirst cumulus field develops in satellite imagery:
RADAR images satellite images courtesy
courtesy Korea
0340-0350UTC (1240-1250KST) JMA/BOM
Meteorological
Administration (KMA) Sokcho
Cheongju signal
no signal
detected in
detected
the
in the
Himawari-8
radar
dataRADAR images
courtesy Korea
Meteorological First lightning strikes recorded: satellite images courtesy
JMA/BOM
Administration (KMA)
0540-0550UTC (1440-1450KST)
Sokcho
signal
detected in
Cheongju
both the
Himawari-8
and radar
dataimages courtesy JMA/BOM
Monitoring cloud top temperatures and ice
crystal size to determine Tropical Cyclone
intensity and developmentPotentially severe convective outbreak on
the flank of the tropical cycloneQuestion to 115 Australian Bureau of Meteorology staff*:
Limitations in the Himawari-8 data
3
Delay in Data Display
34
Large amount of Data /
high Data frequency
Complexity of Products
87
29 Colour Vision
Deficiency
* Results to be published in the research paper "How Himawari-8 data has revolutionised the work of Bureau Forecasters", Zeschke et al. 2018Summary of the session
1 2
The new capabilities of Himawari-8 / 9 True Colour RGB: Volcanic Ash
3 4
Day Convection
Night Microphysics RGB:
RGB: Fog/Low Thunderstorms,
Cloud Tropical Stormsありがとうございます
Thank You
ありがとうございます
Thank YouYou can also read